To Go with NVivo or Not? (and Partial Checklist for Stopping Usage of NVivo)
NVivo may be used as lightly or as heavily as a researcher or research team needs. In other words, it may be brought in for one small part of a project or the entire project or multiple projects. Whether any researcher engaged in qualitative or mixed methods research chooses to go with a tool like NVivo is a decision based on plenty of local factors. Essentially, a basic cost-benefit calculation may be done for a decision.
A functions-based decision tree
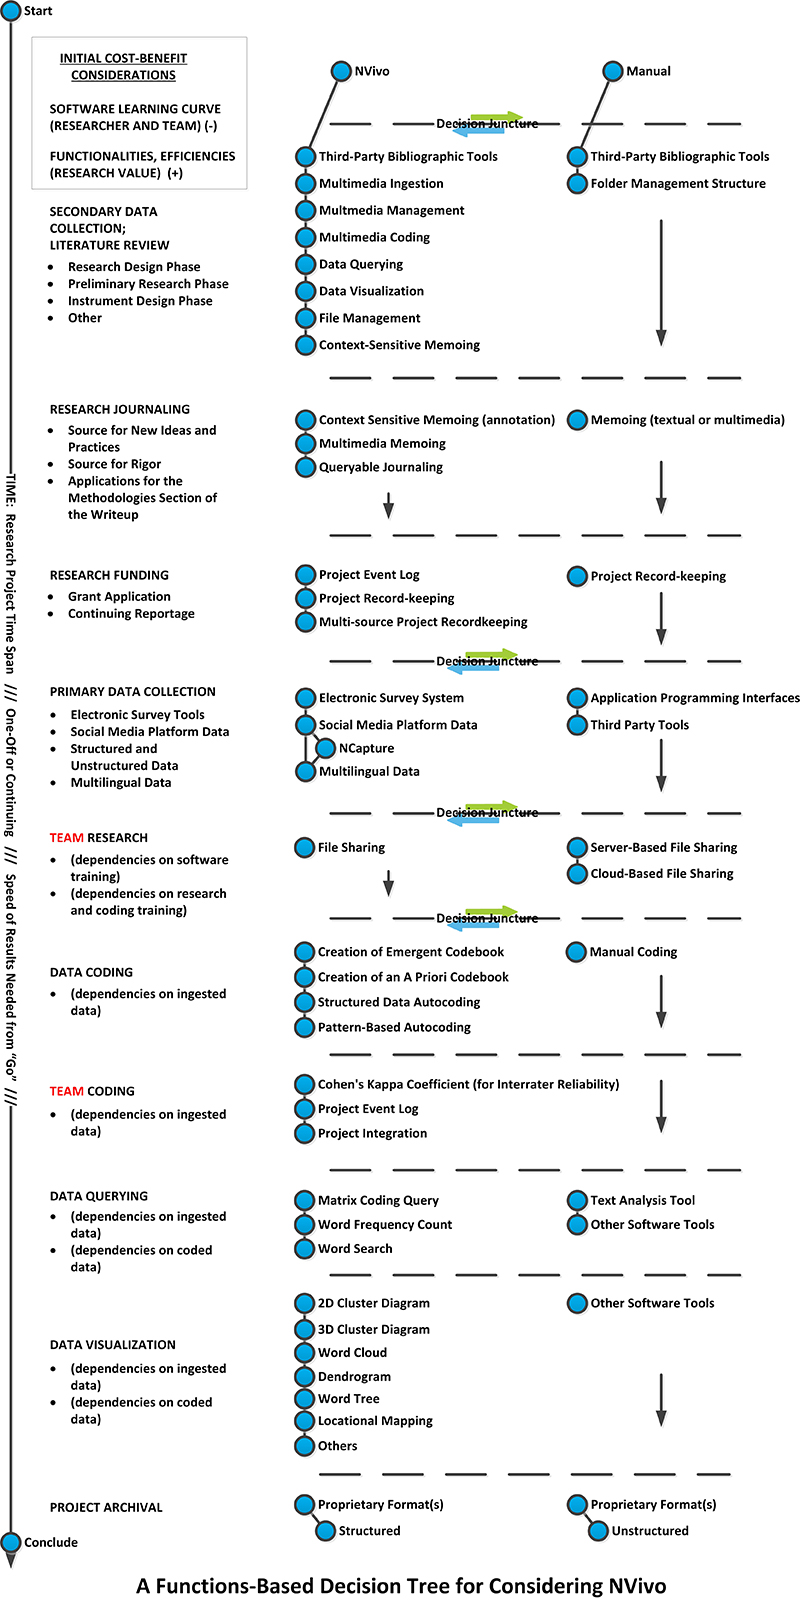
For those who may want a more complex answer, a functions-based decision tree is offered. This decision tree offers a fair amount of complexity based on tool capabilities, but it is wholly possible that only some of these elements are relevant to users. It is also quite possible that there are outside factors not mentioned in this conceptualization. (Note: Please click "Details" for a close-in view of the table. Hold down the CTRL key and hit the plus sign to magnify the view. The image was uploaded into the Scalar platform at a fairly large size, close to the limits that this platform allows.)
At the top-left of the figure, there is a small box labeled “Initial Cost-Benefit Considerations.” Essentially, the formula is simple: the cost involves the learning curve to acquire the software and the potential benefits are the potential functionalities that may be applied to the project. (This is a simplified approach without actual consideration of other related costs to the uses of the software, such as the cost of the software, the server space—if the university is hosting its own version, the Help Desk support, professional trainings, and other elements.) There are practical elements that may be unique to each researcher or research team such as access to necessary technologies in respective fields or locales for the fieldwork. Essentially, each project will have its own cost-benefit conceptualizations based on the researcher, the research tea, the research work, and other elements.
The time elements
A timeline runs down the left side of the visual. This timeline includes three parts: the time length of the project (or its time span), whether the project is a one-off or a continuing one, and then the speed at which the project needs to be completed. The logic here is of the “naïve” sort. The thinking is that if a project is a long-term or multi-year one, it may make better sense to use a software tool which enables data management (including the critical ability to search and find) and handling over time…and which enables a kind of memory (through the automatic event logging if that feature is selected and turned on). Over a long time span, human memory becomes more fallible. An accurate research project would do well to have its resources safely managed with multiple backups and so forth. The intuition about whether a project is a one-off or a continuous one also is relevant. A one-off may not require the long-term memory enabled by digital archival of research information and resources whereas a continuous one would stand to benefit from this feature. Finally, if a project is due speedily, this may be an argument for or against the use of this software. If the researcher or research team were well versed in the tool already, the faster option might be to go with the tool and to let the tool’s many features enable effectively fast work. If a project is due and the researcher or research team do not have the skills to use the tool yet, then the learning curve may be sufficiently high so as to be daunting for a project that has to be completed quickly.
The rest of the visualization then also follows a general time assumption moving from top to bottom. The different strata represent different potential phases in the research—in a very broadly structured way. The time is not assumed to be linear but recursive given how much back-and-forth there is in typical research. There are many subcategories of types of research that may be subsumed under this visualization, but a listing of those will go well beyond the purview of this image.
Some natural decision junctures
In the “decision tree,” a decision may be made at any time to go with either NVivo or a manual solution (albeit with other integrated technologies). More precisely, there are particular decision junctures when a selection may be made to go with NVivo where such a decision may be particularly impactful. One argument could be made that such a decision may be made at the beginning—when the researcher or research team is considering moving forward with the research and are starting to collect secondary research for the grant proposal. Starting at the outset with the use of the tool enables a clear framework from which all the team members may work. This familiarity may enhance the team’s ability to innovate using this platform. A project may be created simply for that initial literature review and its various or specific uses.
Another decision juncture may be when the individual researcher or research team has begun collecting primary data—from surveys, notes, fieldwork, interviews, or any variety or combination of information types. How such primary data is ingested and labeled will affect how that information may be queried and ultimately what may be learned from it in a machine-enhanced way. It stands to reason that such data should be ingested into the project in the most flexibly query-able way. If a research lead is putting together an NVivo project to distribute to the team for various types of close reading and coding, how these projects are set up for the hand-off will be important. This includes how the information is ingested as well as how the coding nodes are set up (if an a priori type of codebook will be used). The structure of the project may skew the work, so it would help to really consider how a project is set up before it is distributed for group coding. (If interrater or inter-annotator reliability is important, then there clearly needs to be work done to help a team “norm” and synchronize with each others’ understandings of the respective codes and the purposes of the work. Team members may also want to have the event logs turned on in case that information will be helpful when sub-projects are integrated into a master project file.)
Another important decision juncture involves the move to the data coding, whether with a pre-determined codebook (or code list), an emergent codebook, or a codebook that is partially pre-determined and partially emergent.
There may well be other important decision junctures, but these were the main ones that were readily apparent in this general sense. [Some may take exception to the assumption in the right column that a “manual” qualitative and mixed methods research approach necessarily includes the use of technologies. It seems reasonable to assume that very little research work done nowadays is purely manual. At some point, research work has to intersect with some technologies, if for no other reason than to present the work to a wider professional audience.] The longer a project goes without a commitment to the software though, the costlier it is in effort to transition. The reason for this is that work that is done manually will have to be digitized in order to be integrated into the software. This means that there will have to be additional work in order to make the transition. The learning curve for the team will not necessarily be less steep. With additional time pressures, the subjective experience of learning the software tool may feel more difficult.
As a refresher of some of the functionalities in NVivo addressed in this e-book, the following offers a visual walk-through of the tool based on some of the visuals from this text. These are placed roughly in the correct category of their appearance, but the images themselves are offered in a more low-resolution way than in the text. These images are not meant for close-up reading but just for a light refresher.
A Digital Photo Album (Fast) Review
As a refresher of some of the functionalities in NVivo addressed in this e-book, the following offers a visual walk-through of the tool based on some of the visuals from this text. These are placed roughly in the correct category of their appearance, but the images themselves are offered in a more low-resolution way than in the text. These images are not meant for close-up reading but just for a light refresher.
Please click on the link here to access the digital photo album. (JavaScript has to be downloaded and enabled in your browser for this digital photo album to work properly.)
One Small Caveat
It's not the fact of having used NVivo on a research project that will strengthen the research work. (A lot of people will fall for the mystique of the tool. Don't.) It's in "how" NVivo is deployed. Some published research papers evoke ("namedrop") the use of the software tool but do not offer sufficient documentary description of their methods and thinking. Or they may sometimes not even be using the tool correctly.
- Was NVivo used to manage research materials? (digital curation)
- Was it used for human coding? Autocoding? A mix of both?
- Was it used for text-based queries and data visualizations? Was the underlying data shared? The metrics of the underlying data?
- Was NVivo used for matrix queries? Matrix coding queries?
- Was it used for model creation (and visualization)?
- Was there team (group) coding?
- Was inter-rater reliability an important factor or not? And if it was important, what was the level of inter-rater reliability?
- Or was the point of team coding for a diversity of understandings and interpretations?
- What is legitimately assertable? What is not assertable? Why and why not?
- Was a codebook exported? Is it included in the paper's appendix?
- How was the codebook created?
- What theories informed it?
- What practices informed it?
- Were the codes emergent or not?
And so on...
Partial Checklist: Stopping Usage of NVivo
For those whose subscriptions to this tool are ending and not being renewed, here are some things to think about, in a checklist.
Data processing
- Have you run all the data queries and autocoding that you want from the projects? If not, do.
NVivo file saveouts
- Have you saved the most up-to-date versions of each project for storage (and potential later resuscitation if needed with a later version of NVivo)?
- Have you copied out or exported versions for the other operating system (Window -> Mac, Mac -> Window) in case the other version is needed?
Data exports, data visualization exports, original file exports, classification sheets, born-digital files, visual model exports, codebook exports
- Have you exported all data tables (to Excel, to SPSS/statistical Package for Social Science) and labeled these accurately?
- Have you exported all data visualizations to the proper data file format and labeled these accurately?
- Do you have all the raw files that you need from the respective projects? (pdf files, word files, audio, video, visuals, maps, etc.)
- Do you have classification sheets that you need to save out?
- Do you have born-digital files from NVivo that should be exported?
- Do you have all the models exported? (and labeled properly)
- Do you have all the codebooks exported? (and labeled properly)
Social media files
- Have you made copies of any necessary .nvcx files from social media platform exports? ]
Is there anything else to save out before the software stops working? (Make your own checklists!)
Will you be able to reconstitute a project if you need to? Will you be able to back up your work and your research assertions? (without having to pony up for a new purchase or a new subscription to the software?)
If you are moving to a different technology, are you able to reconstitute your work in that if you want to run different analytics (or test prior ones)? What are the effortful costs to that transition? (Many projects are not very portable, and CAQDAS tools only interact in limited ways with each other.)
A Final Bit
Choosing a CAQDAS software has huge implications on the work and the experience of the work...so it helps to "know thyself" and those around you and the research context...and to take important factors into consideration.
Of course, multiple CAQDAS tools may be used simultaneously. (One of my favorites is LIWC-22 with its psychometrics and other variables...to be used alongside NVivo.)
Here is a slideshow (from 2022) about CAQDAS software.
With the advent of "artificial intelligence" programs, even greater reaches of analytics are possible. These include various types of neural networks and even ensemble models.
Discussion of "To Go with NVivo or Not? (and Partial Checklist for Stopping Usage of NVivo)"
Add your voice to this discussion.
Checking your signed in status ...