A Research Workflow with NVivo Integrations
As noted in earlier pages, there are a number of ways in which NVivo may be used in qualitative or mixed methods research. This tool may be used for quantitative analytics, too, with its integration with SPSS.
The tool itself is highly flexible in terms of when and how it is used. The researcher can wield much power with the tool, especially if they bring deep expertise and creativity.
To contextualize this discussion, though, an overview of the research method will be presented in the first figure. Then variations in the approach will be addressed.
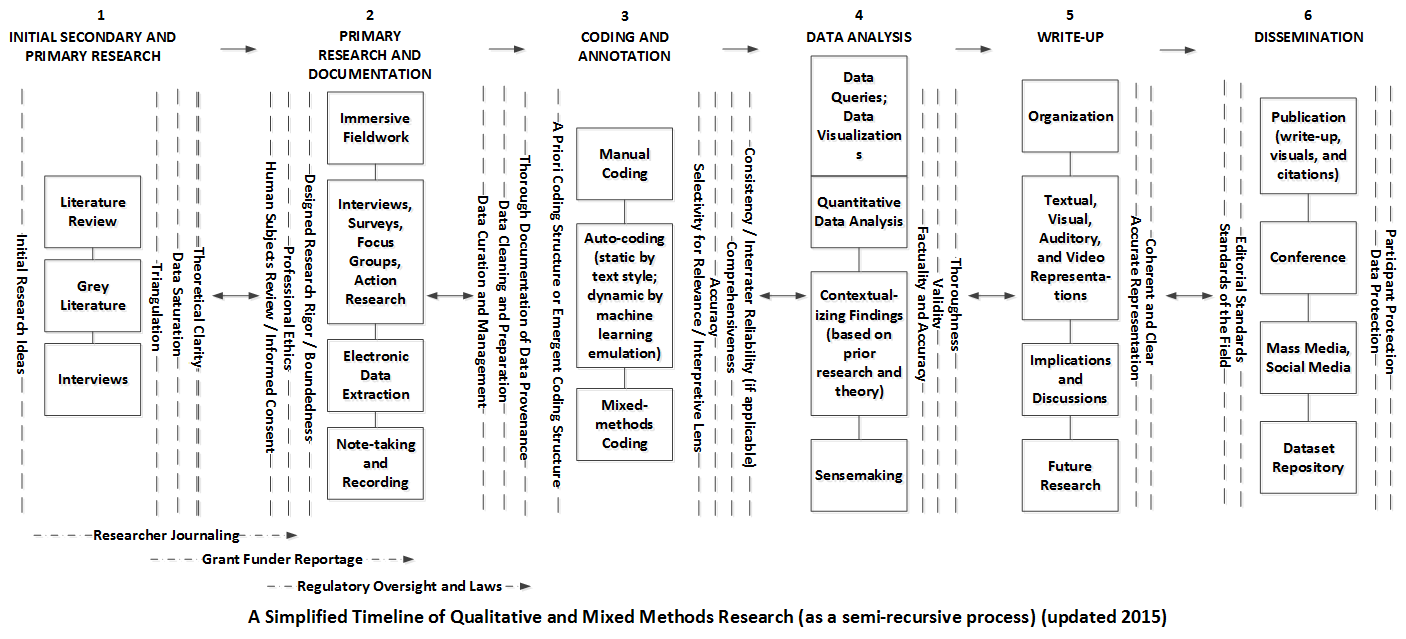
A Simplified Timeline of Qualitative and Mixed Methods Research
“A Simplified Timeline of Qualitative and Mixed Methods Research” is presented as the first image on this page. This visualization suggests that generalized research may occur over six phases:
1. Initial Secondary and Primary Research (data collection and curation)
2. Primary Research and Documentation
3. Coding and Annotation
4. Data Analysis
5. Write-up
6. Dissemination
Recursiveness. The general steps to research are recursive, which means a researchers will move forwards and backwards in the timeline based on needs. For example, if new research on the topic comes out after the literature review (which was initially done to saturation), a conscientious researcher would usually go back to the initial secondary research phase in order to read up on the research and to see if there are possible implications to the research work or the interpretation of the research findings. Or, after data analysis, a researcher may return to the coding and annotation phase in order to highlight particular insights from the analysis.
(Note: This image was first used by the author in a 2014 presentation at a conference hosted by Sloan-C and MERLOT. The image has since been updated. This slideshow was cited earlier.)
NVivo may be brought into play at the very beginning of the project. For example, the researcher or research team may brainstorm ideas for the research in the memos and use the shared space to synthesize their ideas. The tool may be used for the creation of the grant proposal documents.
Then, once funded, the team may collect secondary research as part of the literature review (or even earlier for use in the grant proposal). The software tool may be used to store the primary research—such as interviews, surveys, field notes, and social media platform contents. The ingested contents may be in the forms of various types of digital media: text, image, audio, video, dataset, or other formats.
Summaries of non-digital contents may be captured and placed in the Sources-> Externals folder as "proxy" information to stand-in for those external ("non-digital" in NVivo parlance) data sources. The idea, in a sense, is that the stand-in digitized data is a step removed from the original analog source.
NVivo may be used to code the information from External sources. Concept networks may be extracted from the data. Researchers may conduct "content analyses" of the data, with apparent extracted themes and sentiments, and other insights. Data queries may be made against the collected data and nodes—through text frequency queries, word searches, matrix queries, and various data visualizations. Data visualizations may be created for the analyses as well as for the dissemination of the research. The above then provides a fairly large-scale overview.
In terms of shorter projects, NVivo may also be brought into play. Some of these relatively briefer workflows will be discussed.
For a literature review, a researcher may use integrated third-party bibliography tools to extract both sources and their citations. NVivo may then be used for coding the data, analyzing it, and creating data visualizations and tables for dissemination.
For interviews, a researcher (or research team) may structure the textual data appropriately for auto-coding for efficient matrix analyses (based on interview subject attributes). The interviews may also be coded, analyzed, queried, and data-mined for insightful information.
For online survey processing, surveys may be downloaded from a third-party survey tool or ingested via common file formats (like .xlsx, .xls, .sav, .txt, or other formats). These surveys may be structured for proper ingestion in an auto-coded way, so that the survey queries may be structured by question, by survey respondent characteristics, and other ways. This approach may also be used for an electronic Delphi (eDelphi) study. From there, various types of coding and data queries may be achieved.
Within NVivo, there is a non-destructive form of data cleaning. Data cleaning (processing) may have to be done to omit redundancy or duplication or noise. Text search analyses of text corpuses or stand-alone documents will possibly require additions to the internal “stop words” list, for example. Also, the ingested data may have to be re-structured in order to optimize the query / discovery / analysis tools within NVivo. For example, if a worksheet is ingested into NVivo, it helps to have Row 1A contain labels for the cells below and for Column A1 to contain the unique identifiers for the individual records (whether cases, interviews, or surveys).
Different .nvp and .nvpx (NVivo projects) projects may be created for different parts of a research project and at different times in the workflow. There is not one way to use NVivo for work.
Shorter Research Projects
In terms of shorter projects, NVivo may also be brought into play. Some of these relatively briefer workflows will be discussed.
For a literature review, a researcher may use integrated third-party bibliography tools to extract both sources and their citations. NVivo may then be used for coding the data, analyzing it, and creating data visualizations and tables for dissemination.
For interviews, a researcher (or research team) may structure the textual data appropriately for auto-coding for efficient matrix analyses (based on interview subject attributes). The interviews may also be coded, analyzed, queried, and data-mined for insightful information.
For online survey processing, surveys may be downloaded from a third-party survey tool or ingested via common file formats (like .xlsx, .xls, .sav, .txt, or other formats). These surveys may be structured for proper ingestion in an auto-coded way, so that the survey queries may be structured by question, by survey respondent characteristics, and other ways. This approach may also be used for an electronic Delphi (eDelphi) study. From there, various types of coding and data queries may be achieved.
A Note about Data Cleaning (Processing)
To be clear, data should be "cleaned" before it is input into NVivo, generally speaking. The common practice is to first have a pristine master file folder where all the original data is stored...and protected against any revision. Then, a copy may be used for cleaning and other processing. What may the cleaning entail? It may involve the following:
- removing question text from particular files
- removing garble text
- removing repeated between-page text from social media files
- segmenting different languages into different files (if necessary)
- cleaning auto-transcripted video and audio transcripts, and others
The idea is to not lose the power of the original data through cleaning or through accidents in the cleaning process. Once the files are cleaned, these files are the ones uploaded into NVivo.
Another data cleaning aspect involves de-identification of data or removing personally identifiable information (PII) from the data and ensuring that people's identities cannot be re-identified in any way. In some cases, identities are preserved for the researcher by using randomized codes for the respective individuals, so the individual information like demographics may be used in the research but not revealed in the NVivo project (especially if the project file will be shared upon publication). In other cases, the identities are wholly anonymized into perpetuity to the researcher and everyone else. [Consultation with regulatory agencies overseeing the research at the respective organizations will be helpful.] In NVivo, ingested information is hard to (impossible to) de-identify within the tool especially if the data columns are locked. EXIF data riding with imagery is still active and findable and usable. Uploaded documents may be accessed with their metadata. It is important to be aware of what is riding along data-wise whenever publishing a project file or sharing a project file.
A "destructive" (irrecoverable) form of data cleaning can be done if the data is input as a digital file created in NVivo. In this case, one can delete the whole file or parts of it in irrecoverable ways.
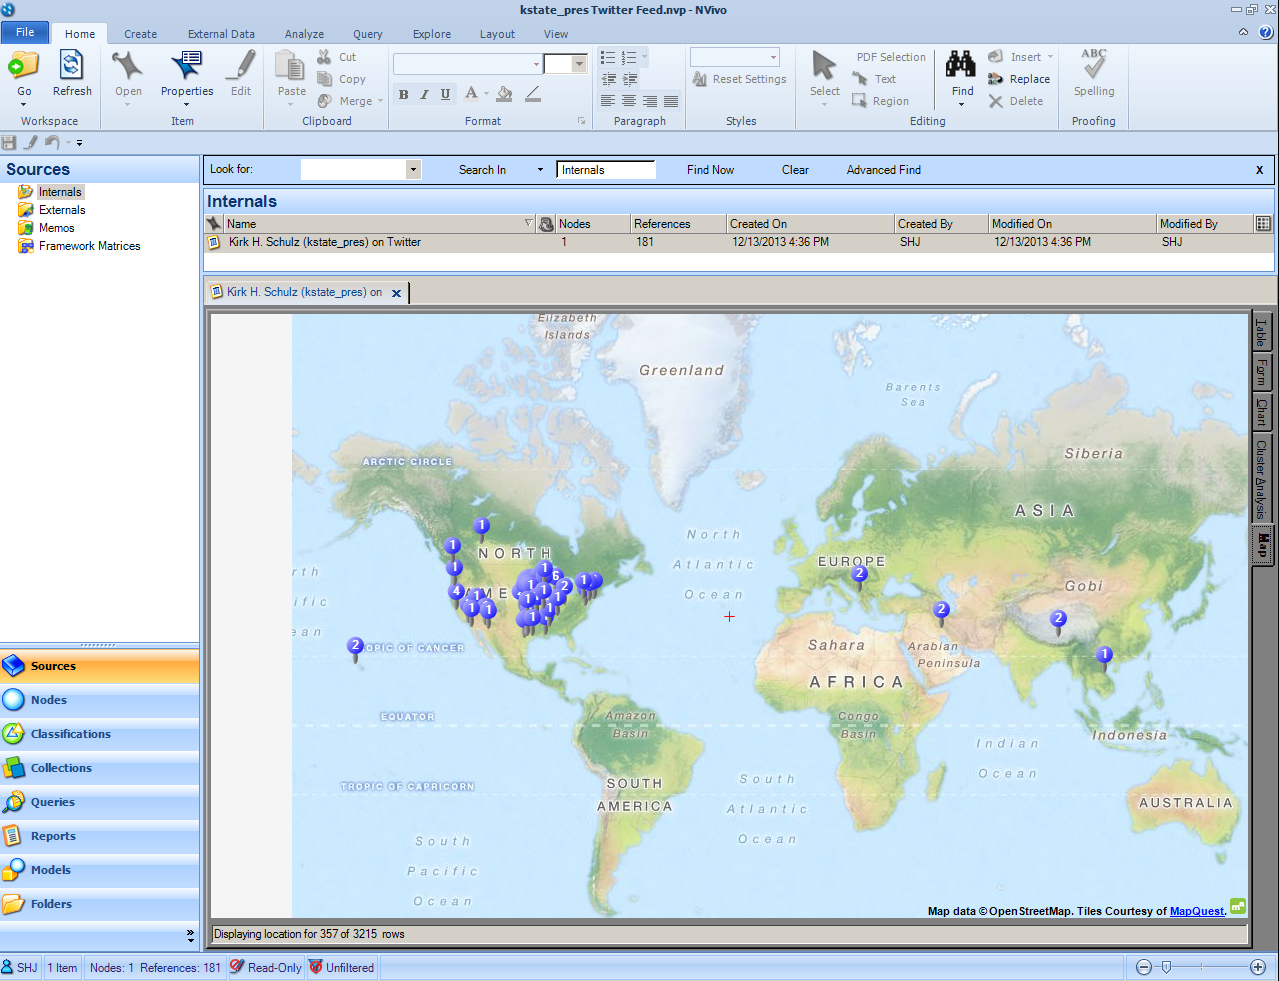
For the analysis of social media platform data, a researcher may use the NCapture plug-in to Internet Explorer (IE) and Google Chrome to extract Tweetstreams, user accounts on Facebook, and specific YouTube videos (by embedded links). From there, various types of coding and data queries may be achieved. (IE is available in Windows 10. Just look for it in the Search. Currently, NCapture is not available for Edge.)
Different .nvp and .nvpx (NVivo projects) projects may be created for different parts of a research project and at different times in the workflow. There is not one way to use NVivo for work.
| Previous page on path | "Using NVivo" Cover, page 1 of 5 | Next page on path |
Discussion of "A Research Workflow with NVivo Integrations"
Add your voice to this discussion.
Checking your signed in status ...