Intro
NVivo is a state-of-the-art data analysis tool for qualitative and mixed methods research. That is the simple version.
Some Common "Use Cases"
A "use case" is a common information technology term to refer to various user-based applications of a technology tool. These are usually applied and real-world. These can also be hypothetical, such as anticipated usages.
This tool is used for various analytical contexts.
Some typical "use cases" of this technology (in my limited experience) are the following:
- A research team is asked to justify their decision-making and analysis from qualitative data for a work submitted for publication. They want to attain some machine back-up in their analysis (originally from human close-reading and manual coding). They decide to use NVivo to model topics from text-based survey responses to justify their extracted themes and subthemes.
- Students are conducting various types of literature reviews for different projects. They use NVivo to sift through mounds of machine-readable .pdf files to identify the main themes of the respective works, so they know which ones to read in-depth. They use their findings for research leads, research design, analytical papers, and other applications.
- A research team dealing with a social topic is interested in some of the public debates going on on social media. They use NCapture (of NVivo) to capture data from several related microblogging sites, and from a major social networking site. They use NVivo to analyze the inter-communications, the social networks, and the sentiment around particular hot-button topics. They use this information in an augmentary way with other research.
- A researcher has been running a multi-year project. She has been evolving a codebook on this topic for years. This codebook is informed by top-down coding (from models, theories, frameworks, research questions)...and bottom-up coding ("grounded theory"). By the way she has ingested data into the project, she is able to query the data in very particular ways and output particular reports that answer very specific questions, including those that she had not conceptualized prior.
- A research team has been seated (impaneled) around the world. The team members have all trained on a particular consensus-created codebook and are now busy coding particular policies related to their own countries based on this codebook. They are all aiming for a Kappa coefficient of .6 to .7, the range which they had achieved in the training based on the codebook and a particular set of data. Now, they are coding different policies, and they code on their own projects, and their projects are collated into a master project file for analytics.
- A research team has co-created a codebook that they want others to be able to inherit and use in NVivo (and other qualitative data analytics software programs). They output their codebook in the Codebook Exchange Format...for interoperability across multiple projects and softwares.
In other words, the research may occur early on in an exploratory way, partway through a research sequence, or post-research. A research project may be all of a piece in one project file, or a research project may be comprised of a number of NVivo project files (each with different data and different queries).
Some Tools and Functionalities
A more in-depth and detailed description is that NVivo involves a suite of tools and functionalities:
- the ingestion of multimedia data (text, imagery, audio, video, and other file types) into a project for curation and management;
- the capability to annotate (memo) all ingested files and built-in-NVivo files;
- the maintenance of research journals (in close proximity to the data);
- the ability to “query” the structured and unstructured data in a variety of ways (word frequency counts, text searches, coding queries, matrix queries, and others);
- the ability to “autocode” data based on either structure or on human-based code patterning (human-supervised machine learning);
- the ability to "autocode" based on theme and sub-theme extraction (unsupervised topic modeling);
- the ability to "autocode" based on sentiments (extracted from a pre-labeled built-in sentiment set);
- the ability to integrate the work of a team co-coding a dataset or mixed datasets;
- the ability to set up and run fine-tuned matrix and cross-tabulation table queries;
- the ability to auto-create related data visualizations (from data queries as well as ingested data);
- the ability to depict relationships between nodes in a project and draw 2D node-link models;
- the ability to auto-create and output reports;
- the ability to archive and search through a variety of multimedia files,
- the ability to output codebooks as Word files and as .qdc files,
- and many others.
These functions may be used in whole or in part. What data is collected, how it is processed, how it is queried, and such, all affect what may be learned from the tool and asserted from the data.
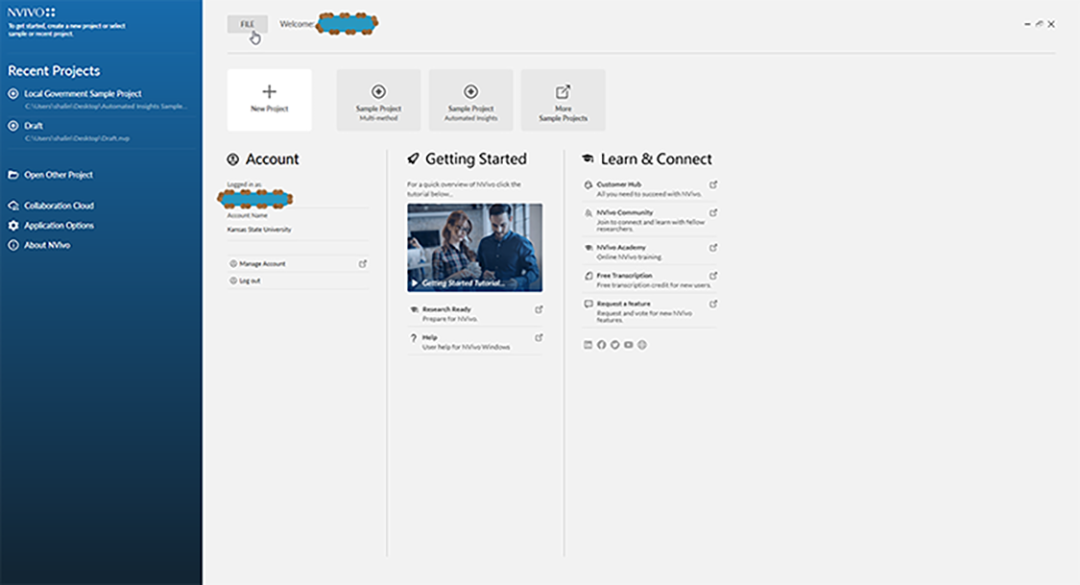
About the E-Book
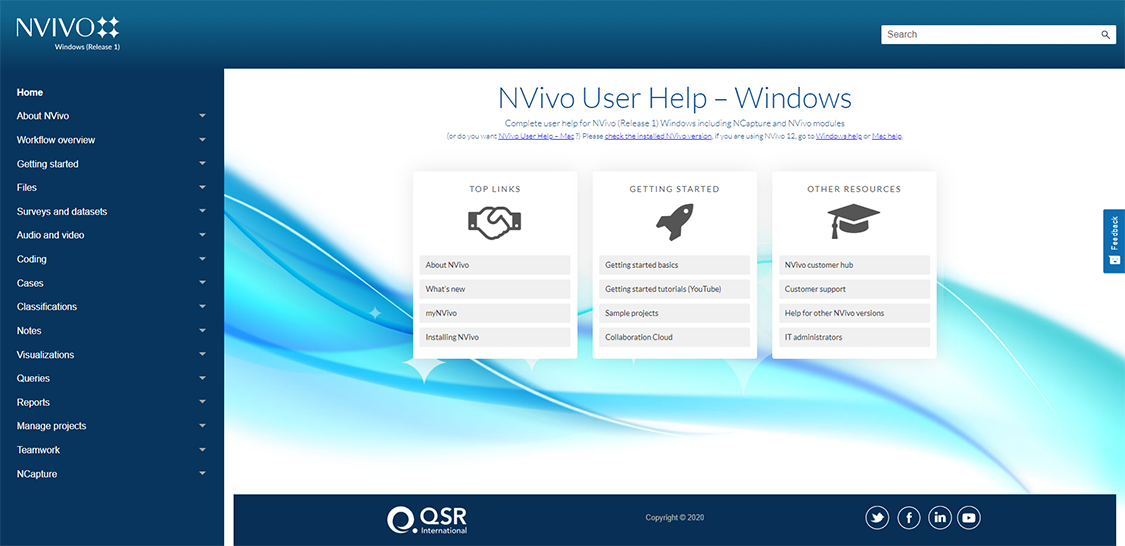
“Using NVivo: An Unofficial and Unauthorized Primer” is a light e-book with the objective of introducing this tool to encourage its use. QSR International, the makers of NVivo, have an excellent website with strong training videos, supportive help documentation, live webinars, and very responsive helpdesk support. This book is in no way competition for what is on the official site. It is conceptualized as a bridge to the more technical resources.
"Using NVivo..." is an informal work with plenty of screenshots and links to resources. This is meant to be easy-to-read and navigate. It is also meant to be presented through one researcher’s eyes, so that optimally others can relate to the work and to approach this tool without fear. (In the parlance of qualitative research, the author hopes to present a “situated” and fully accurate approach to the software tool.)
This e-book will evolve over time. Updates will be made as time allows but likely not necessarily when new versions of the tool are released. There will be some transferability from the learning in this situation to other ones, even as the software evolves. It is possible that there will be a collaborative element here, even though it can be difficult to crowd-source such efforts. Or maybe there will be a response text to this on Scalar, focusing on NVivo or maybe competitor or complementary software.
(Disclaimers: This work is not an advertisement. The writing is not advisement—and is provided for informational purposes only. Users use this at their own risk)
The author hopes to align the terminology with that defined by the software maker but will bring in other terminology as needed for the various research approaches. All sequences will be tested prior before they are described in this work. The screenshots will be taken from a real-world project (with synthetic data included), but will be presented in as generic a way as possible.
The author hopes to align the terminology with that defined by the software maker but will bring in other terminology as needed for the various research approaches. All sequences will be tested prior before they are described in this work. The screenshots will be taken from a real-world project (with synthetic data included), but will be presented in as generic a way as possible.
NVivo for Windows, NVivo for Mac, Server Version
Earlier versions of this text dealt with software versions from NVivo 10 - 11 - 12. This version now will update to NVivo. Some of the work sequences may be the same as in the past.
There are three general versions of the software available:
- NVivo on Windows
- NVivo on Mac
- NVivo on server (including those hosted by QSR International now)
Some of the new features are listed below.
NVivo (on Windows)
- A qualitative cross-tab analysis (for "case nodes" from interviews, focus groups, online surveys, paper surveys, and others)
- Improved data exploration through visual queries (structured data, diagramming, modeling, network graphs)
- Integration with SPSS / Statistical Package for Social Science (by IBM) for data exchanges and cross-analyses
NVivo for Mac (new)
- NCapture browser plug-in for Chrome for social media data extractions (from Twitter and Facebook APIs)
- Integration of digital images as a data source
- Automated capture of EXIF data (if available) on scraped imagery from social media
- Highlighting coding stripes
- Increased range of data query types
- Ability to convert .nvpx files from Mac to Windows project files or .nvp
- Increased data visualization capabilities
More on Sentiment Analysis
Dr. Cynthia Jacobs, NVivo trainer par excellence at QSR International, recently wrote:
"The key thing to understanding the sentiment analysis is that content can be coded to more than one category (both positive and negative). One helpful way of looking at results may be to pull up content that has been coded at both positive and negative, and / or to leave this content out of exploration of the content coded as exclusively positive or negative. This coding is based on a dictionary of terms, by which content is "scored"; hence, the possibility of coding in multiple categories."
She clarified that the sentiment dictionary itself is not customizable. Rather, the sentiment output may be manipulated to add contents to a "stopwords" list to omit it from sentiment consideration.
Author "standing" to address the topic. The author has only worked with the software tool for a few years and only for a few dozen small research projects. The author has not used the tool for any project in totality, from end-to-end, but has drawn on a wide range of tools to achieve the research. The author has also supported a number of faculty, administrators, and graduate students from different colleges and departments at Kansas State University in their learning and use of NVivo 10. In that spirit, this book is also created as a resource to support the training endeavors.
On SlideShare, the author has archived a presentation made about NVivo at a national conference:
“Setting up a Qualitative or Mixed Methods Research Project in NVivo 10 to Code and Analyze Data” (Sloan-C and MERLOT)
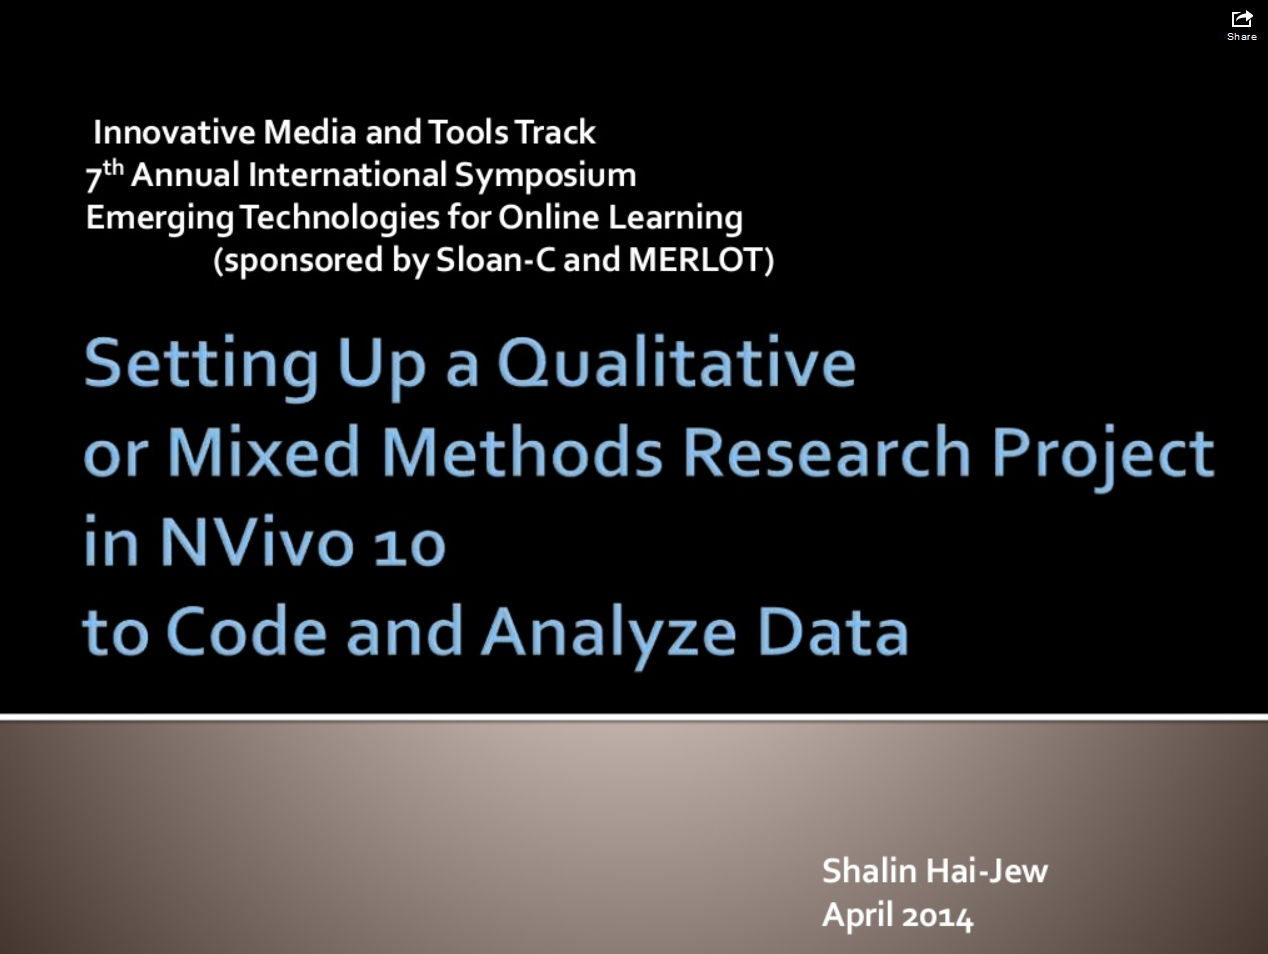
That said, the title is clear that this work is "unofficial" and "unauthorized." The author also has no tie to QSR International. The author has no financial incentive to create or update this work. However, the author is interested in trying to be as accurate as possible.
Discussion of "Intro"
Introduction
I think the introduction is the best and helps students as well as me to have a better idea of the software. The work of Cynthia Jacobs is best introduced. I also started learning Pajek. Thank a lot.Posted on 9 November 2019, 11:13 pm by Prabhakar Krishnamurthy | Permalink
Add your voice to this discussion.
Checking your signed in status ...