Matrix Coding Query
Matrix Coding Query
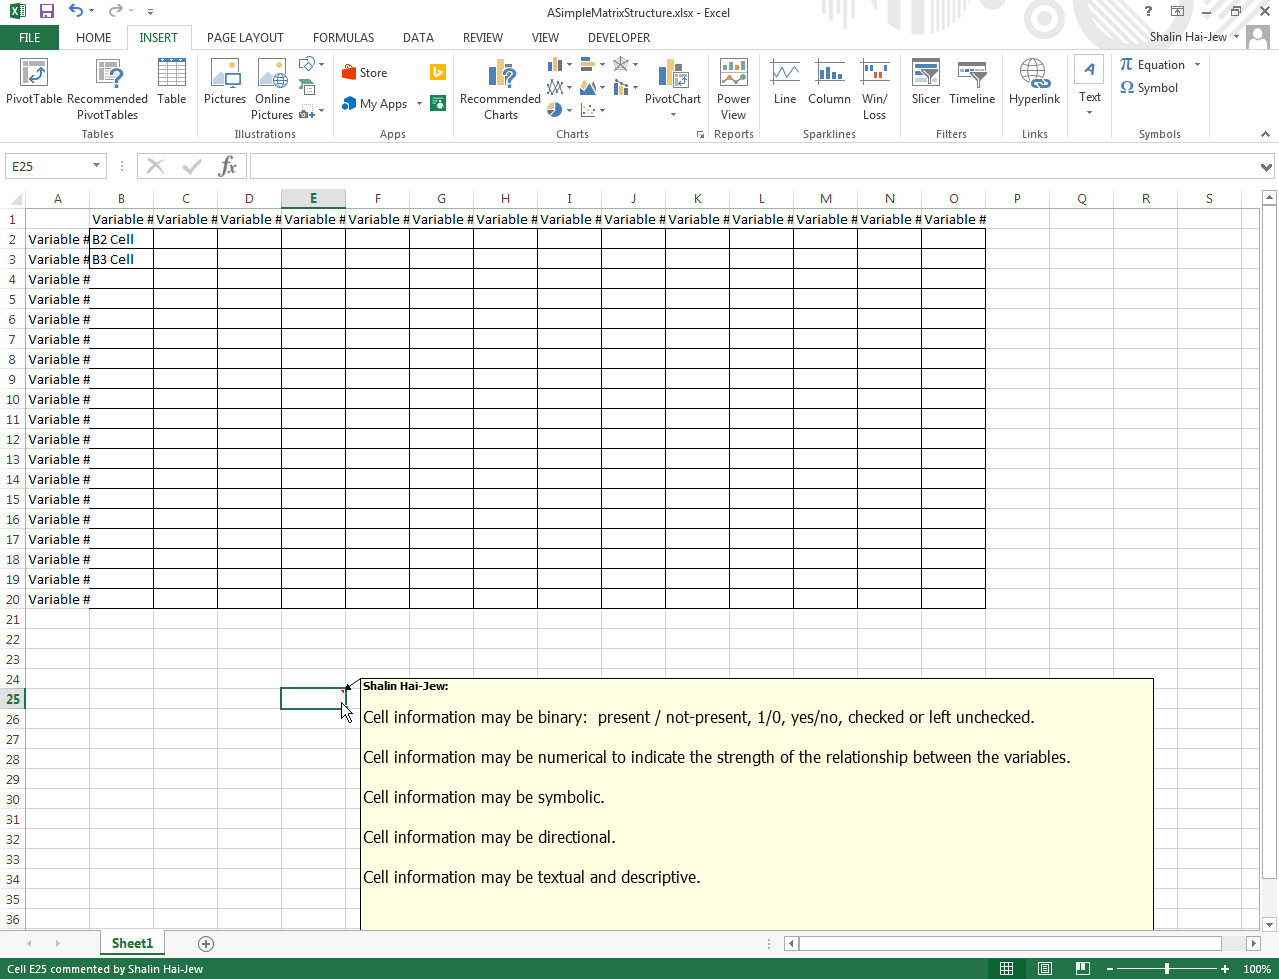
It is important to understand what a basic matrix structure looks like. Basically, there are rows and columns of variables, and the cells contain data at the intersections of the rows and columns. Matrices are usually of a certain type in terms of how the information is represented. As noted in the visual below, cell information may be in the following forms (one type per matrix--not mixed types):
binary: such as present / not present, 1/0, yes/no, checked or unchecked
numerical: (such as to indicate strength of relationship)
symbolic: (such as any symbolic indicator representing information)
directional: ->, <-, -, <->, or other (such as one variable in relation to another)
textual and descriptive: described with words
or some other method...
The cells where the data would go were highlighted for clarity.
The matrix coding query in NVivo is described with the following verb phrase: “Cross-tabulate the coding intersections between two lists of items.”
To conduct a matrix coding query in NVivo, go the Query tab in the ribbon. A Matrix Coding Query window will open.
The “Add to project” feature saves the parameters of the matrix coding query as a re-usable macro. If that box is checked for this feature, then users will be asked to title the macro and to add a textual description of it.
Next, it is important to define the rows. In the row tab, one will be able to see the folder structure in the small window to the left. If one wants to select subfolders, then one can check “Automatically select subfolders.” If one wants to use a node structure and include all descendent nodes, one has that option by checking “Automatically select descendent nodes.” It is important to try to come out with a matrix that is useful, so it cannot be too simple nor too complex. Click OK.
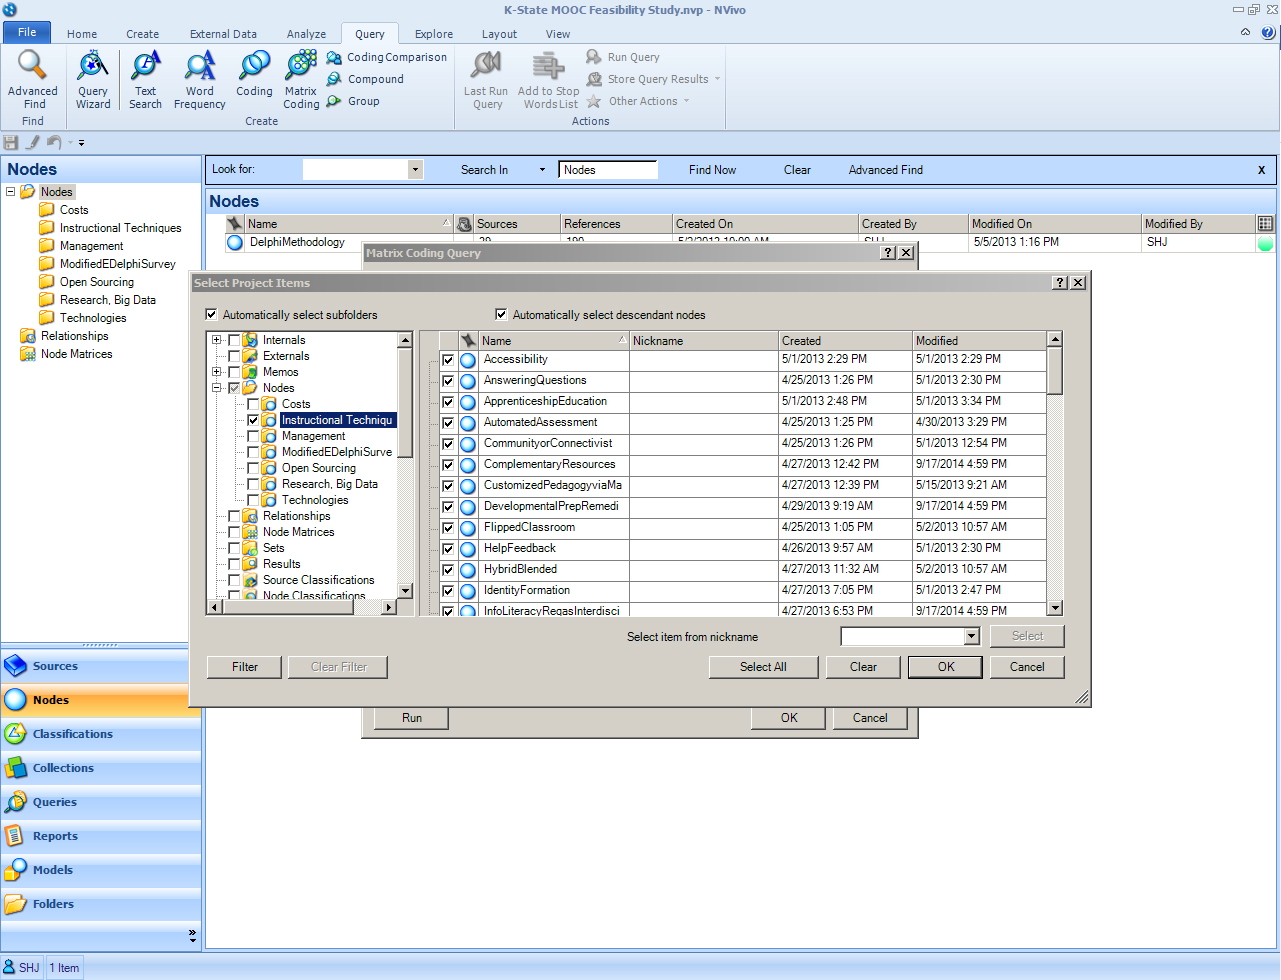
Then click Add to List. The rows are then populated.
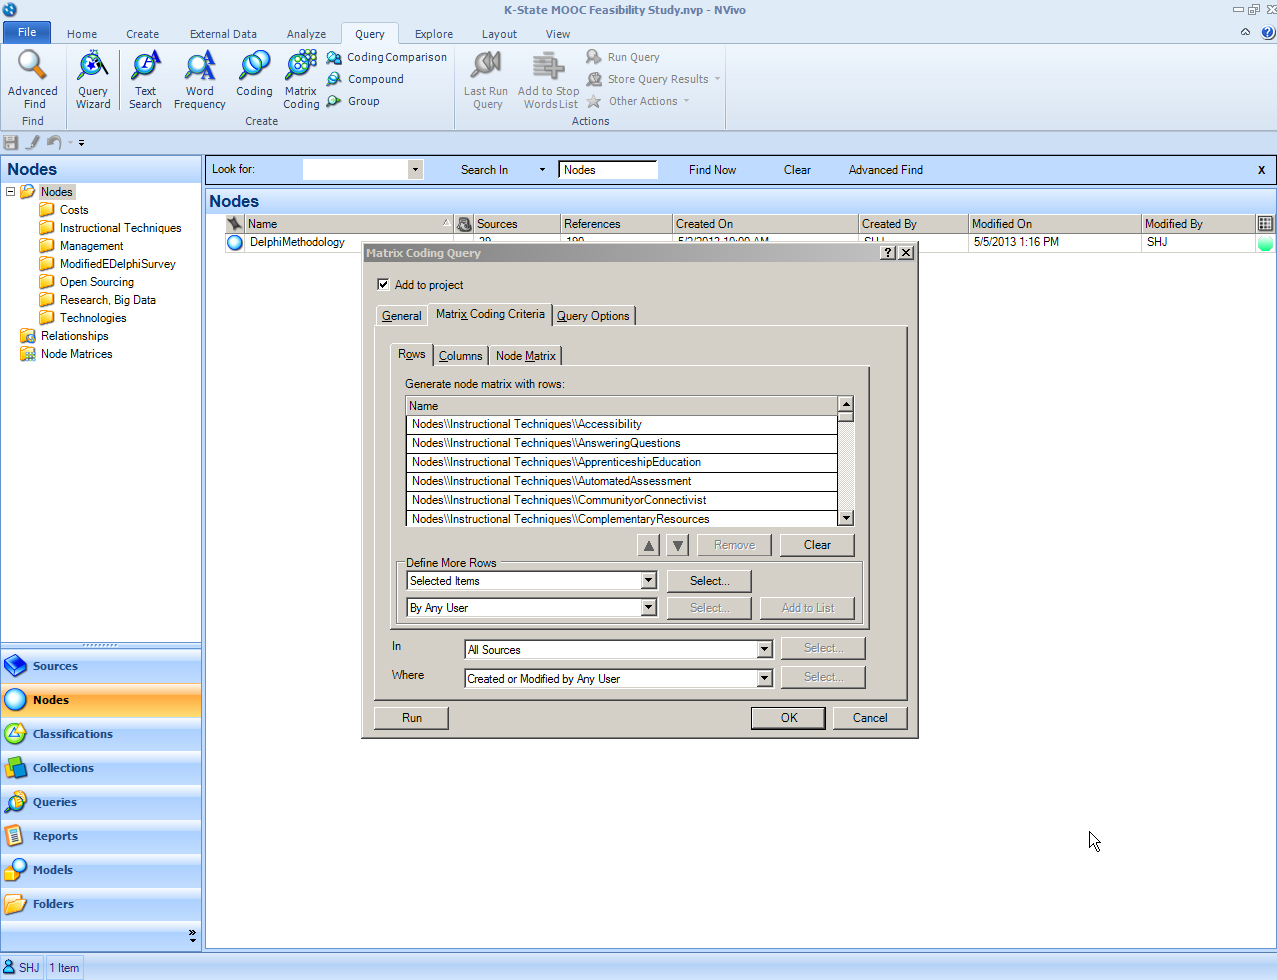
The next step then is to define the columns within the Matrix Coding Criteria tab. Cluck on the Columns sub-tab. Click on the Select button. Indicate which variables are required for the column variables.

Click OK.
Click “Add to List.”
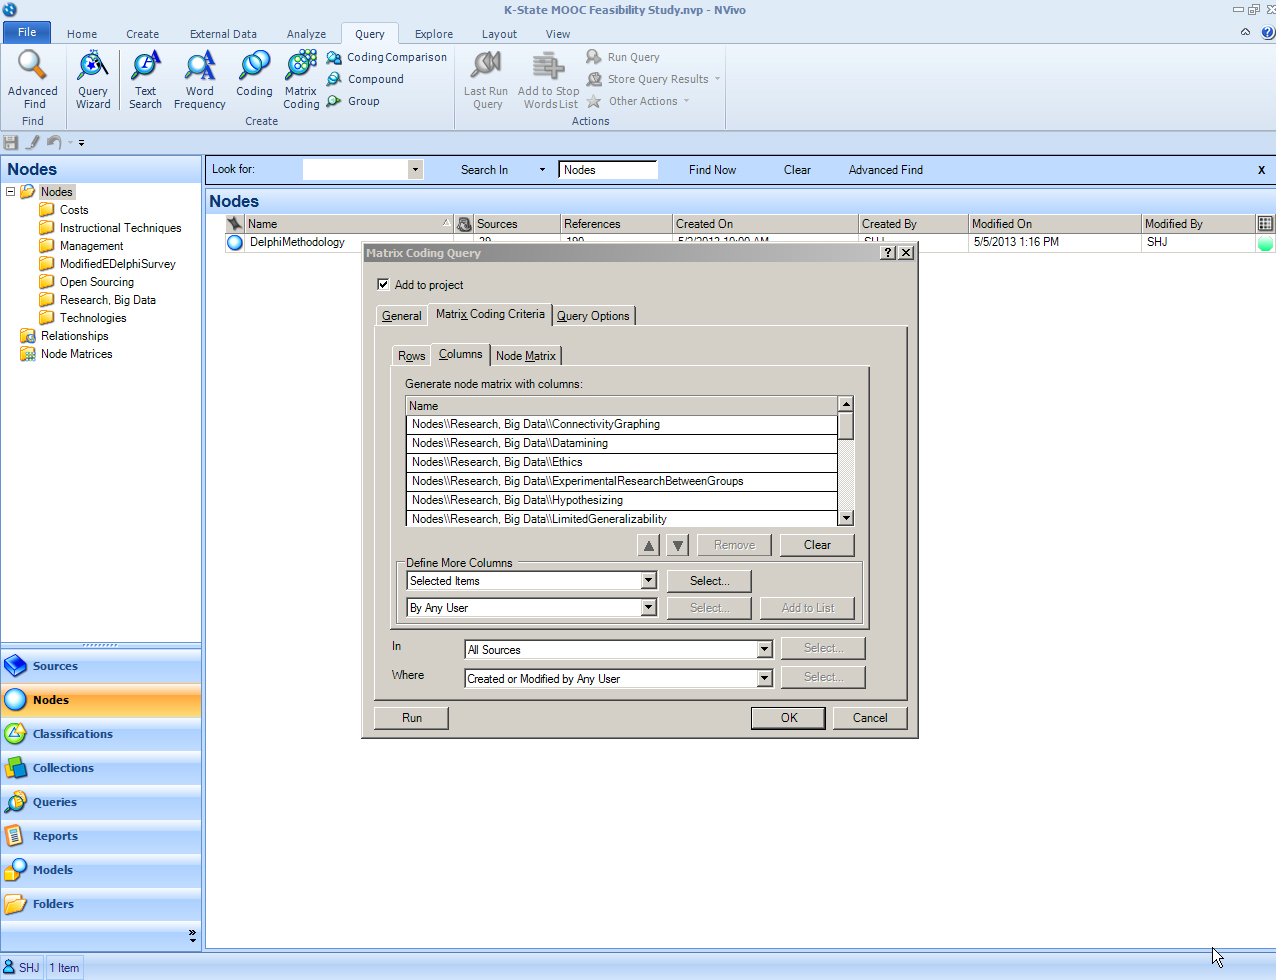
The researcher may still select which rows and which columns to include. For this visualization, everything was accepted.
In the “Node Matrix” tab within the Matrix Coding Query, users may choose to show results in either single or multiple rows and columns. In this case, multiple rows and multiple columns were selected.
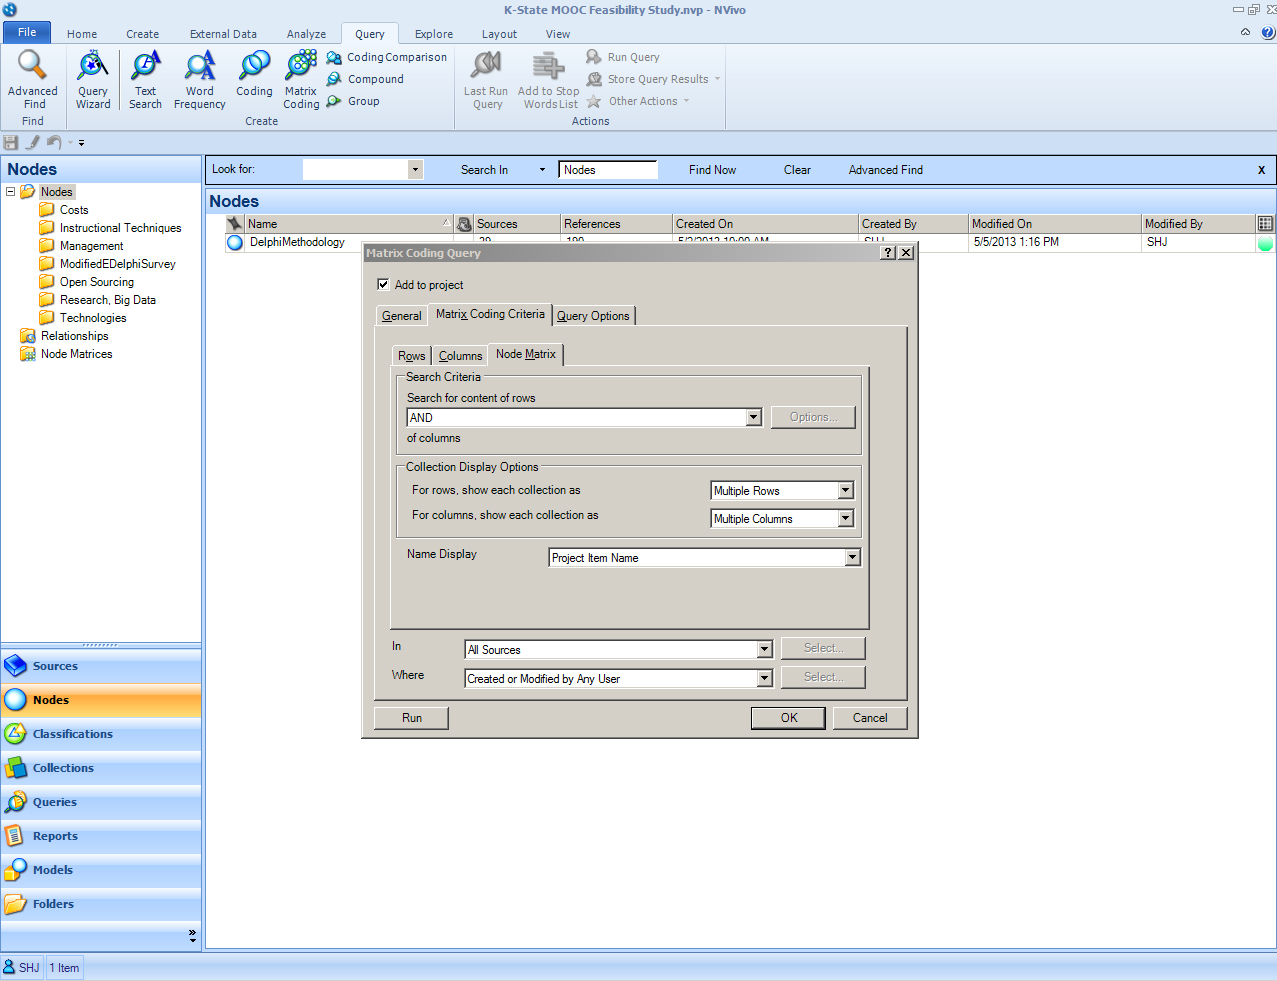
Once these parameters are satisfactorily set, click on the “Run” button at the bottom left. NVivo codes the matrix in real-time and shows its results in near-real-time. (Note the status / progress bar at the bottom left.)
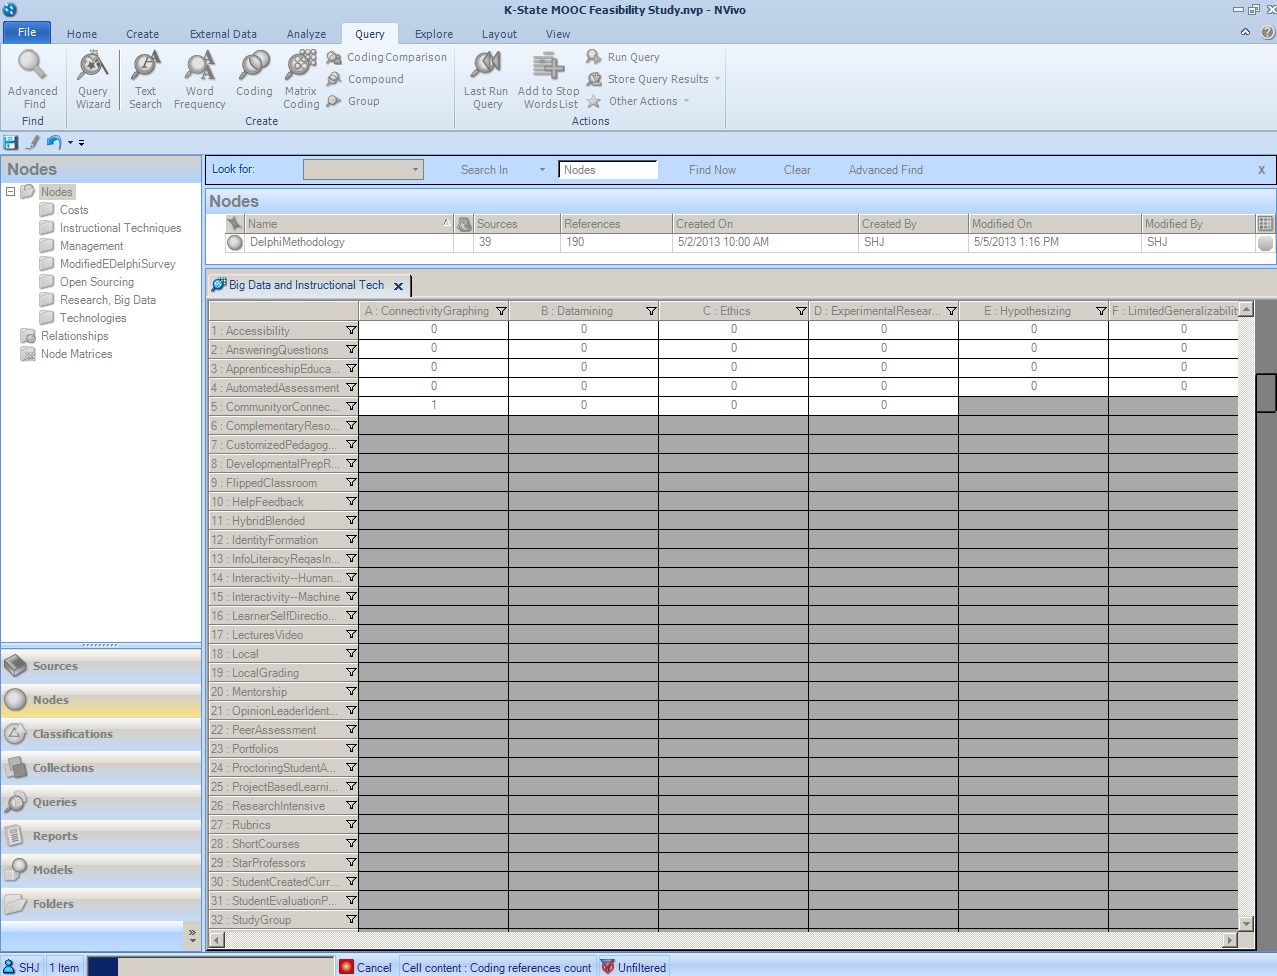
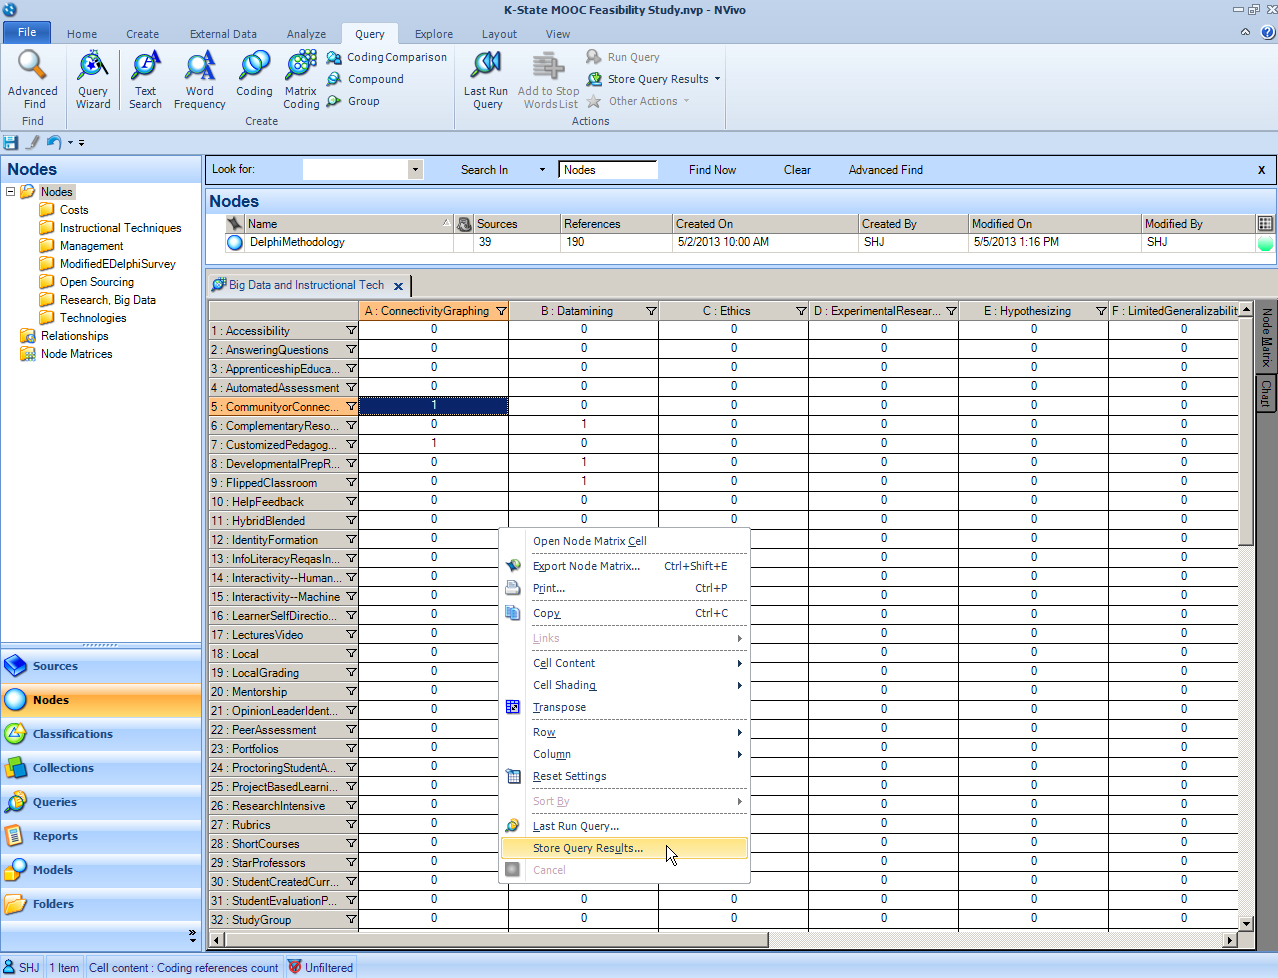
The matrix that is finally created shows a “1” if there is some overlap in textual information for the variables. It shows a “0” if no relationship was found. An intersection is highlighted below in the fully populated matrix. Note that there is a slider bar on both sides to enable viewing all the data.
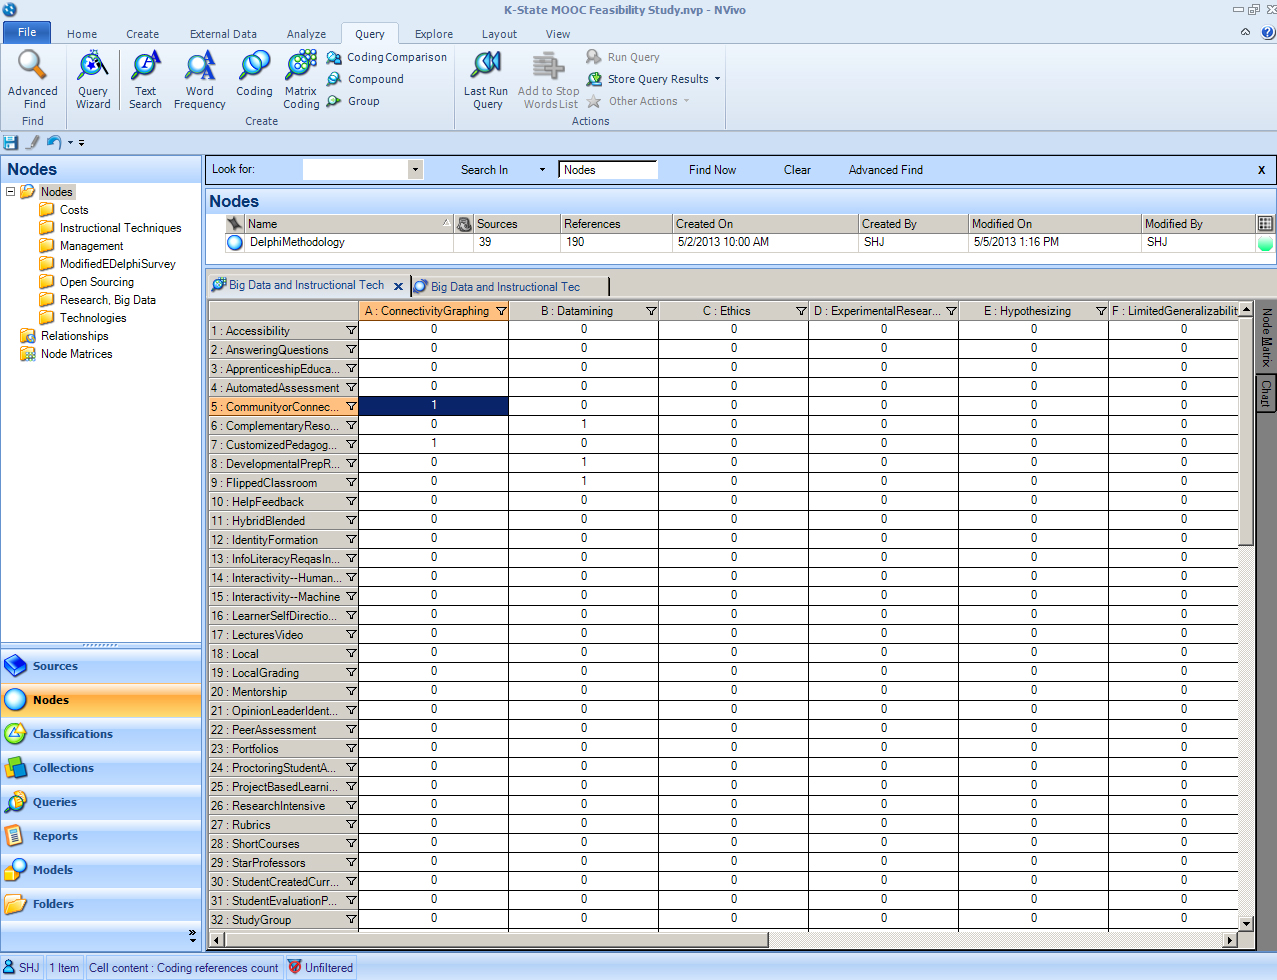
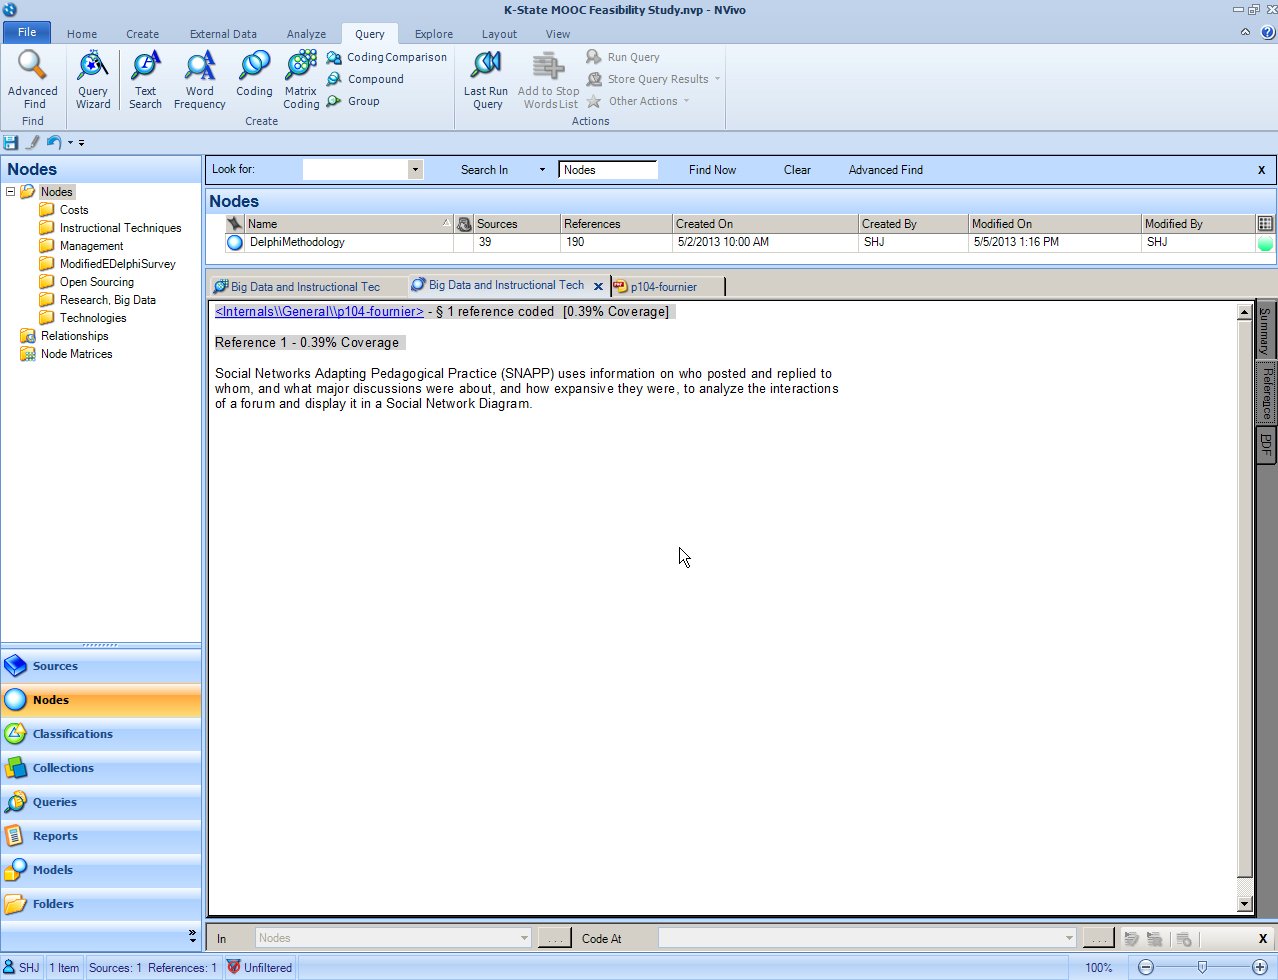
A double-click on the highlighted cell will bring up the textual coding where the two variables intersect / overlap. A click on the link “<internals…” in the active window will bring up the original sources.
To store the query results, right click on the matrix. Click on the Store Query Results.
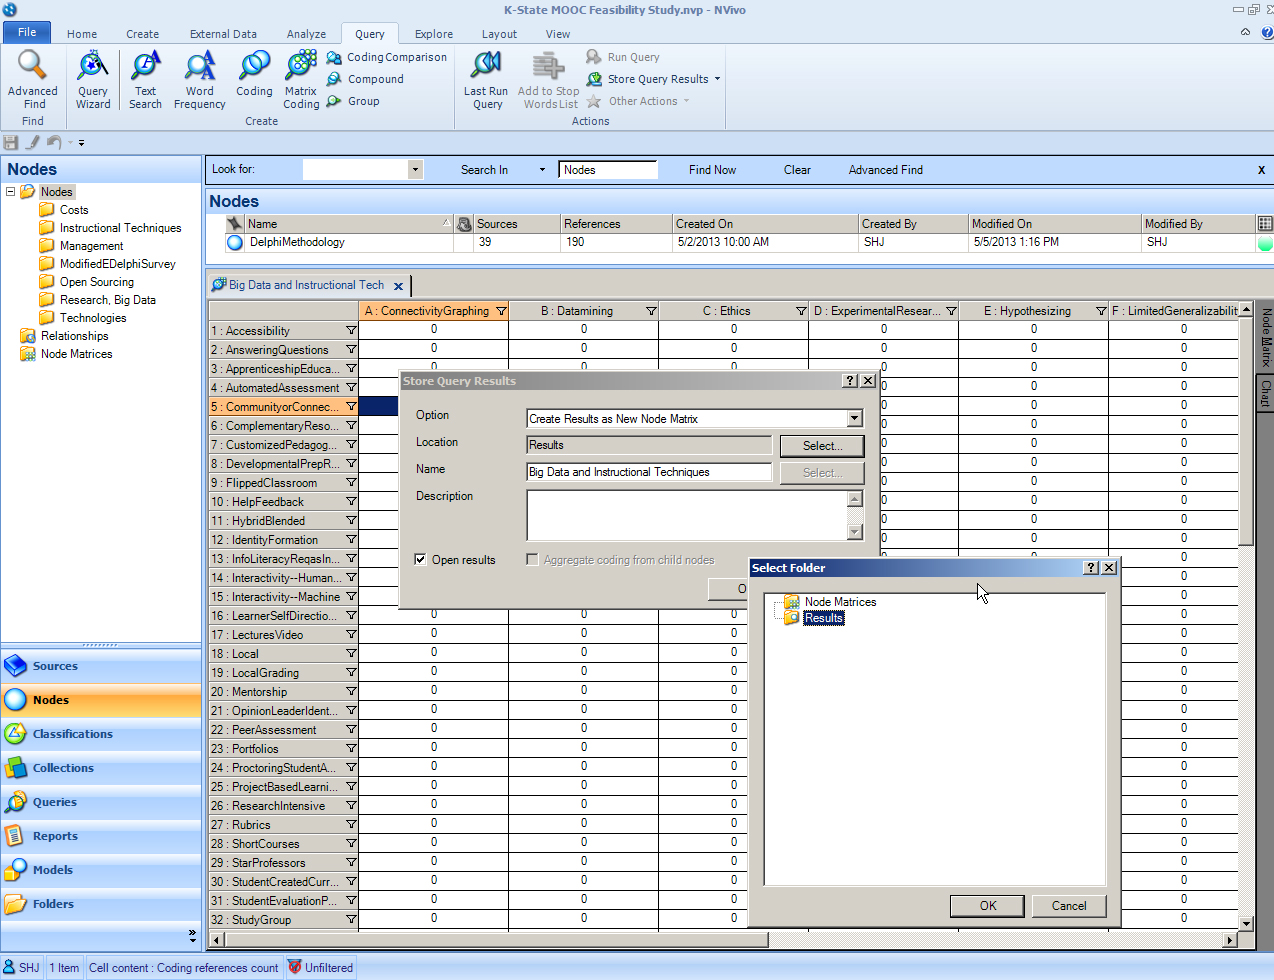
A window will open to allow users to indicate the location of the stored results. Otherwise, the default setting will be in the Node Matrices -> Results folder.
| Previous page on path | Conducting Data Queries... (Part 2 of 2), page 4 of 7 | Next page on path |
Discussion of "Matrix Coding Query"
Add your voice to this discussion.
Checking your signed in status ...