Data Query: Matrix Coding Query
Matrix Coding Query
There are no fixed canons for constructing a matrix. Rather, matrix construction is a creative yet systematic task that furthers your understanding of the substance and meaning of your database, even before you begin entering information.
M.B. Miles, A. M. Huberman, and J. Saldaña, in Qualitative Data Analysis: A Methods Sourcebook (2014)
---
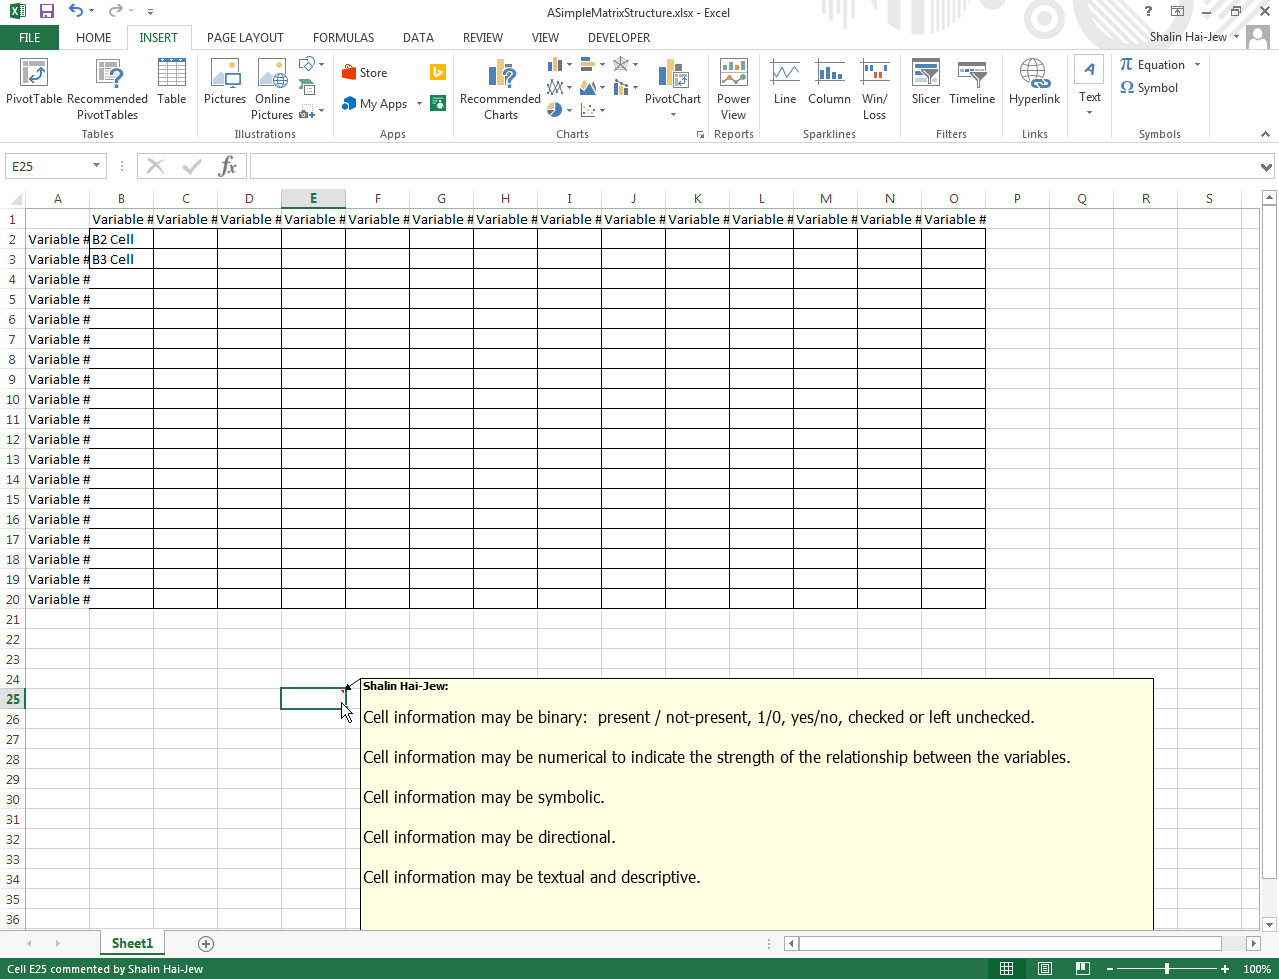
It is important to understand what a basic matrix structure looks like. Basically, there are rows and columns of variables, and the cells contain data at the intersections of the rows and columns. Such matrices do not have to be symmetrical; they may be "ragged" or "irregular," with different numbers of rows and columns and irregularities in filled / unfilled cells.
Matrices (as data structures) are usually comprised of a certain type in terms of how the information is represented. As noted in the visual below, cell information may be in the following forms (one type per matrix--not mixed types):
Matrices (as data structures) are usually comprised of a certain type in terms of how the information is represented. As noted in the visual below, cell information may be in the following forms (one type per matrix--not mixed types):
binary: such as present / not present, 1/0, yes/no, checked or uncheckednumerical: (such as to indicate strength of relationship)symbolic: (such as any symbolic indicator representing information)directional: ->, <-, -, <->, or other (such as one variable in relation to another)textual and descriptive: described with words
or some other data type...
The cells where the data would go were highlighted for clarity.
The matrix coding query in NVivo is described with the following verb phrase: “Cross-tabulate the coding intersections between two lists of items.”
To conduct a matrix coding query in NVivo, go the Query tab in the ribbon. A Matrix Coding Query window will open.
The “Add to project” feature saves the parameters of the matrix coding query as a re-usable macro. If that box is checked for this feature, then users will be asked to title the macro and to add a textual description of it.
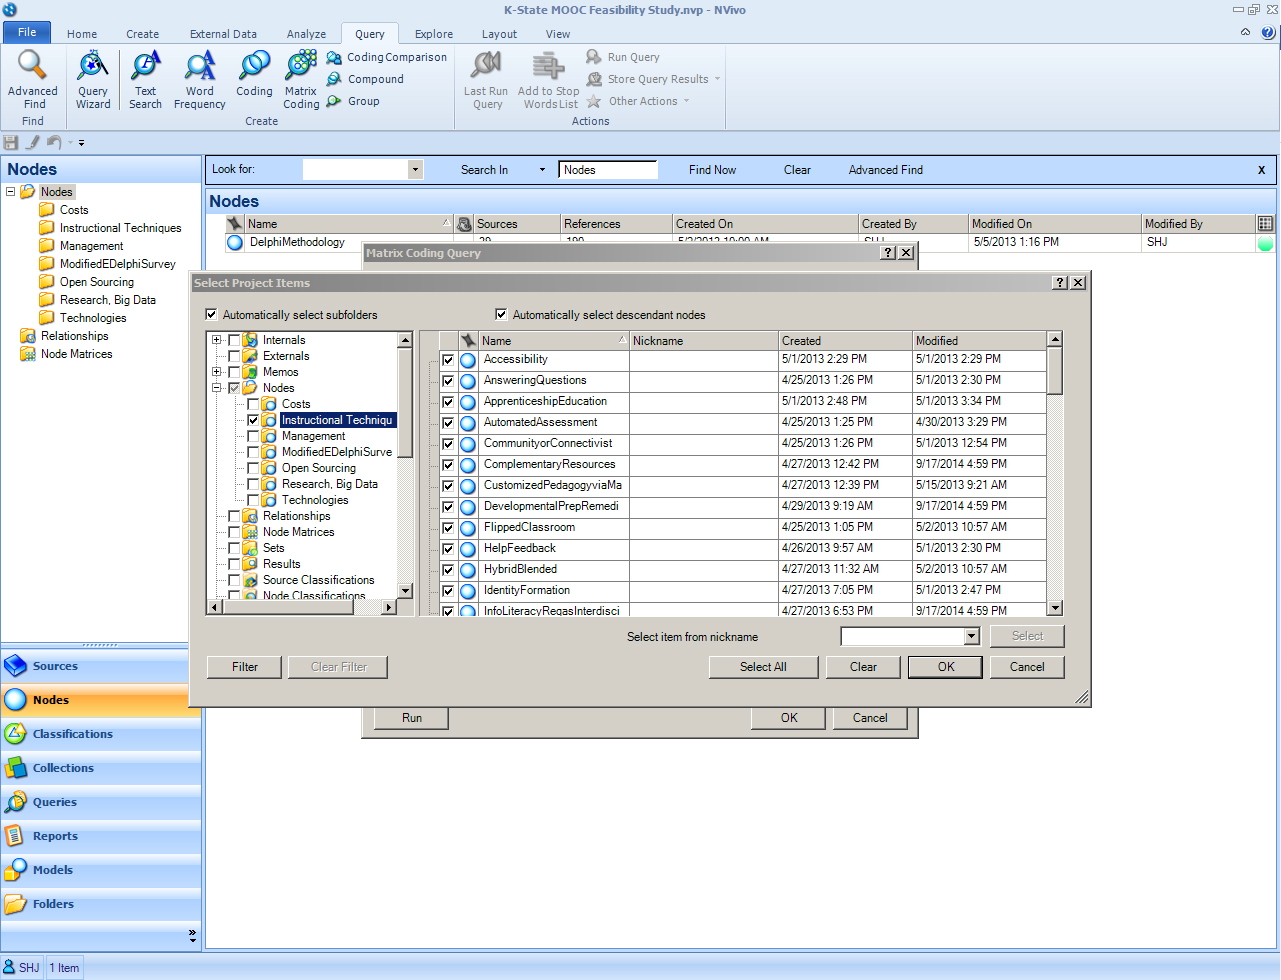
Next, it is important to define the rows. In the row tab, one will be able to see the folder structure in the small window to the left. If one wants to select subfolders, then one can check “Automatically select subfolders.” If one wants to use a node structure and include all descendent nodes, one has that option by checking “Automatically select descendent nodes.” It is important to try to come out with a matrix that is useful, so it cannot be too simple nor too complex. Click OK.
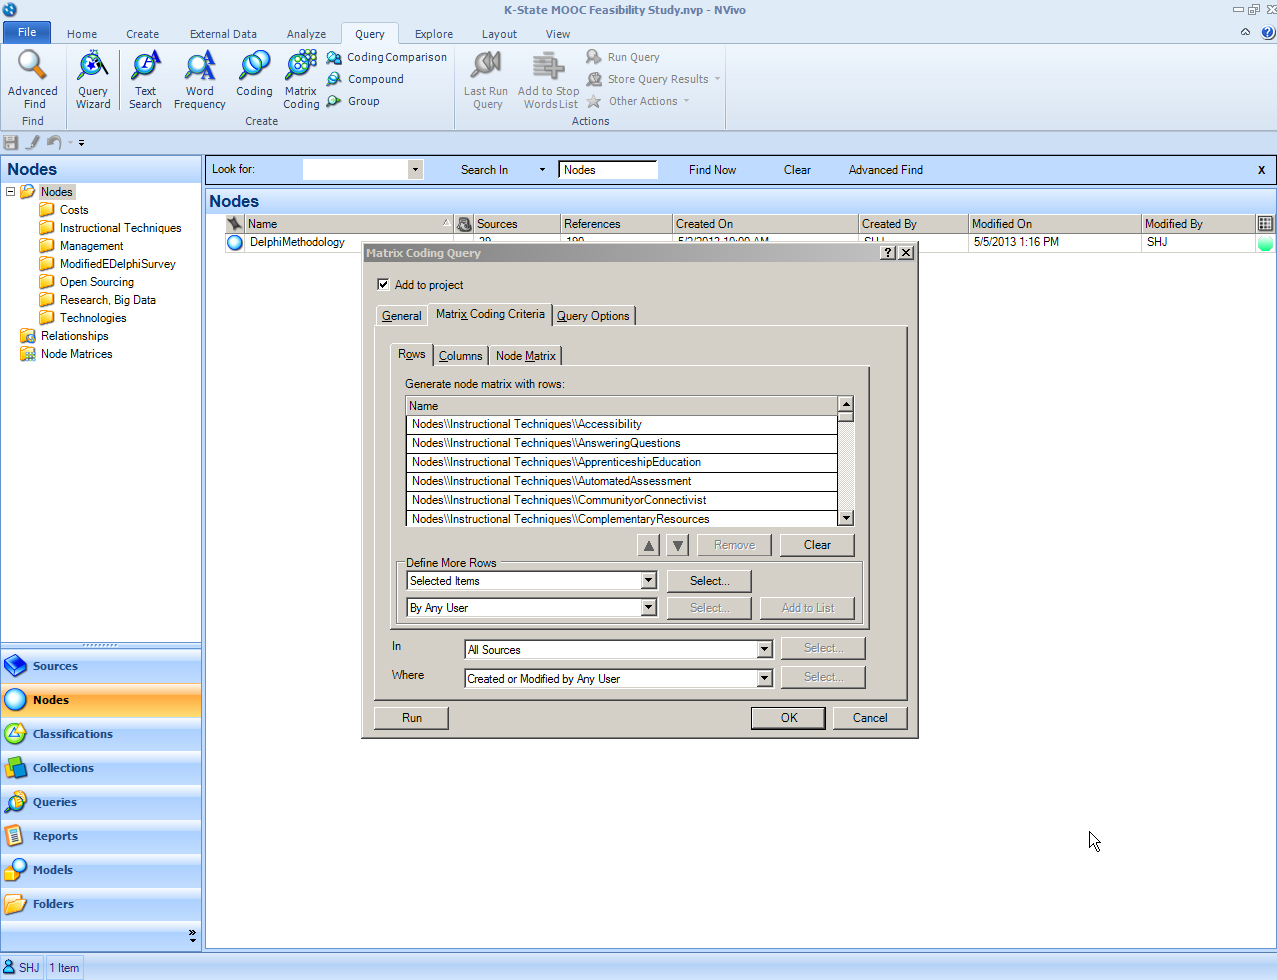
Then click "Add to List."
The rows are then populated.
The next step then is to define the columns within the Matrix Coding Criteria tab. Cluck on the Columns sub-tab. Click on the Select button. Indicate which variables are required for the column variables.
Click "OK".
Click “Add to List.”
The researcher may still select which rows and which columns to include. For this visualization, everything was accepted.
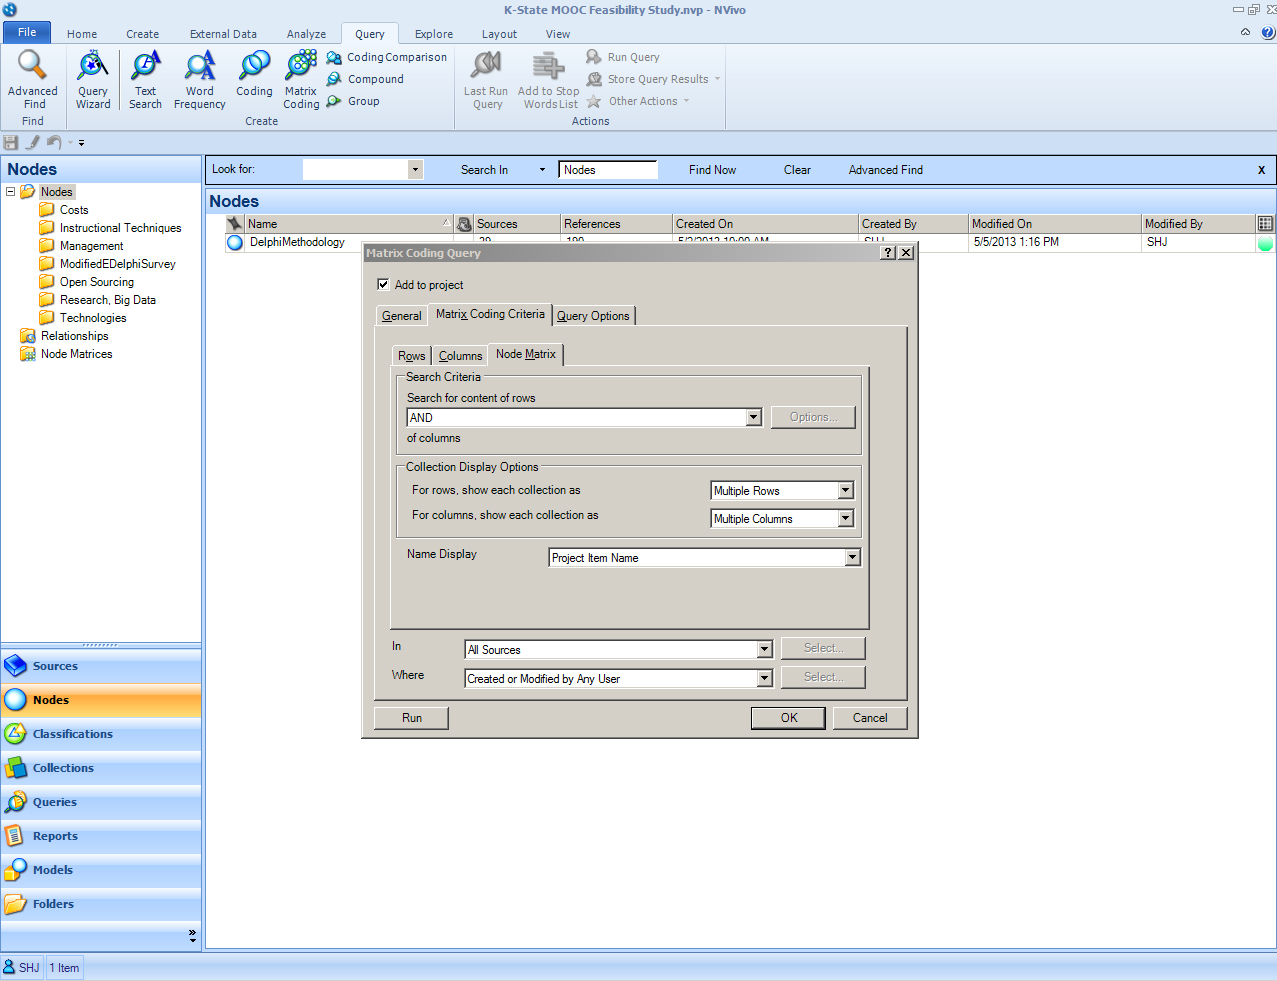
In the “Node Matrix” tab within the Matrix Coding Query, users may choose to show results in either single or multiple rows and columns. In this case, multiple rows and multiple columns were selected.
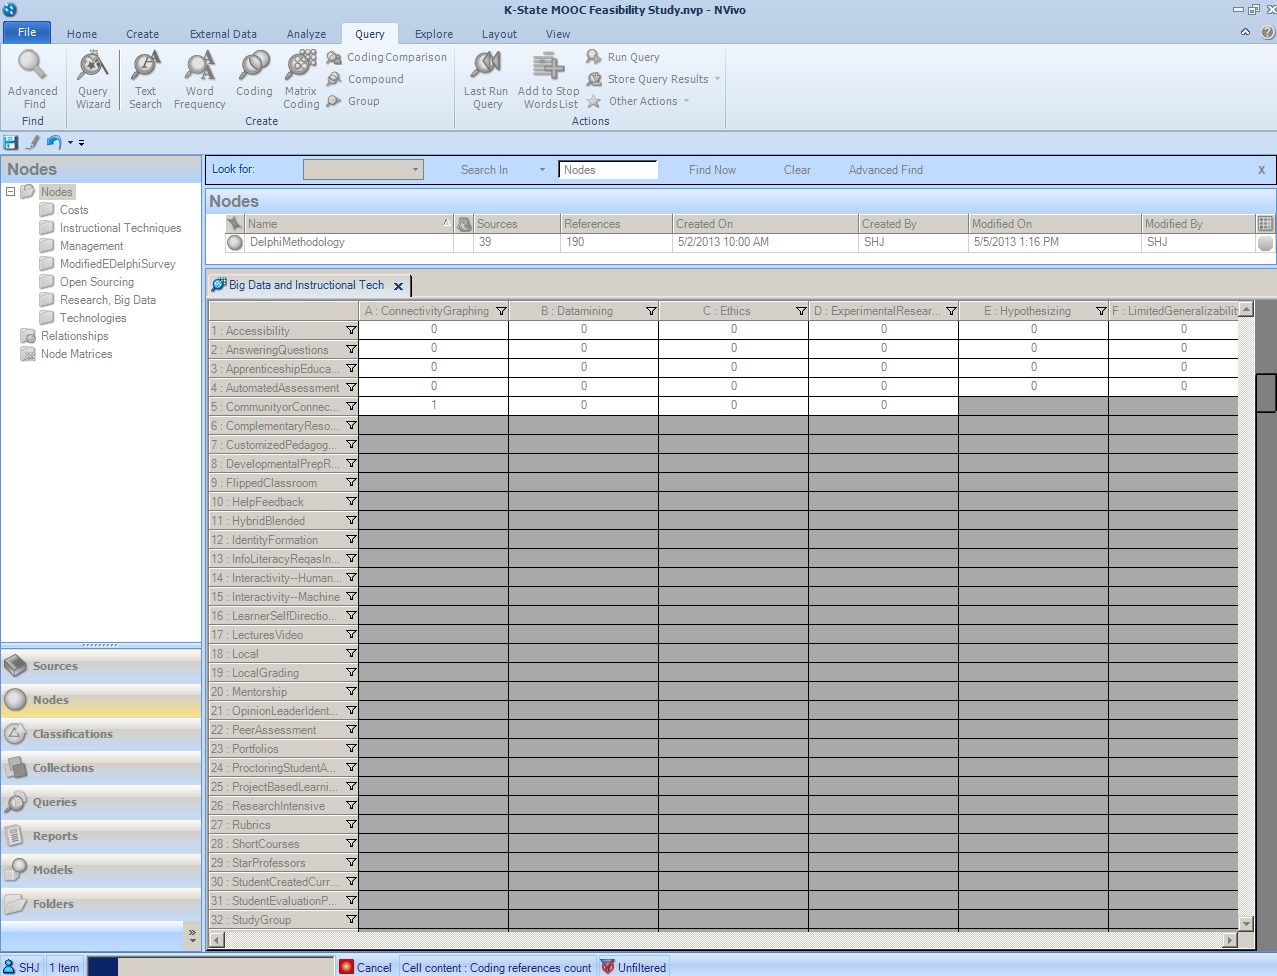
Once these parameters are satisfactorily set, click on the “Run” button at the bottom left. NVivo codes the matrix in real-time and shows its results in near-real-time. (Note the status / progress bar at the bottom left.)
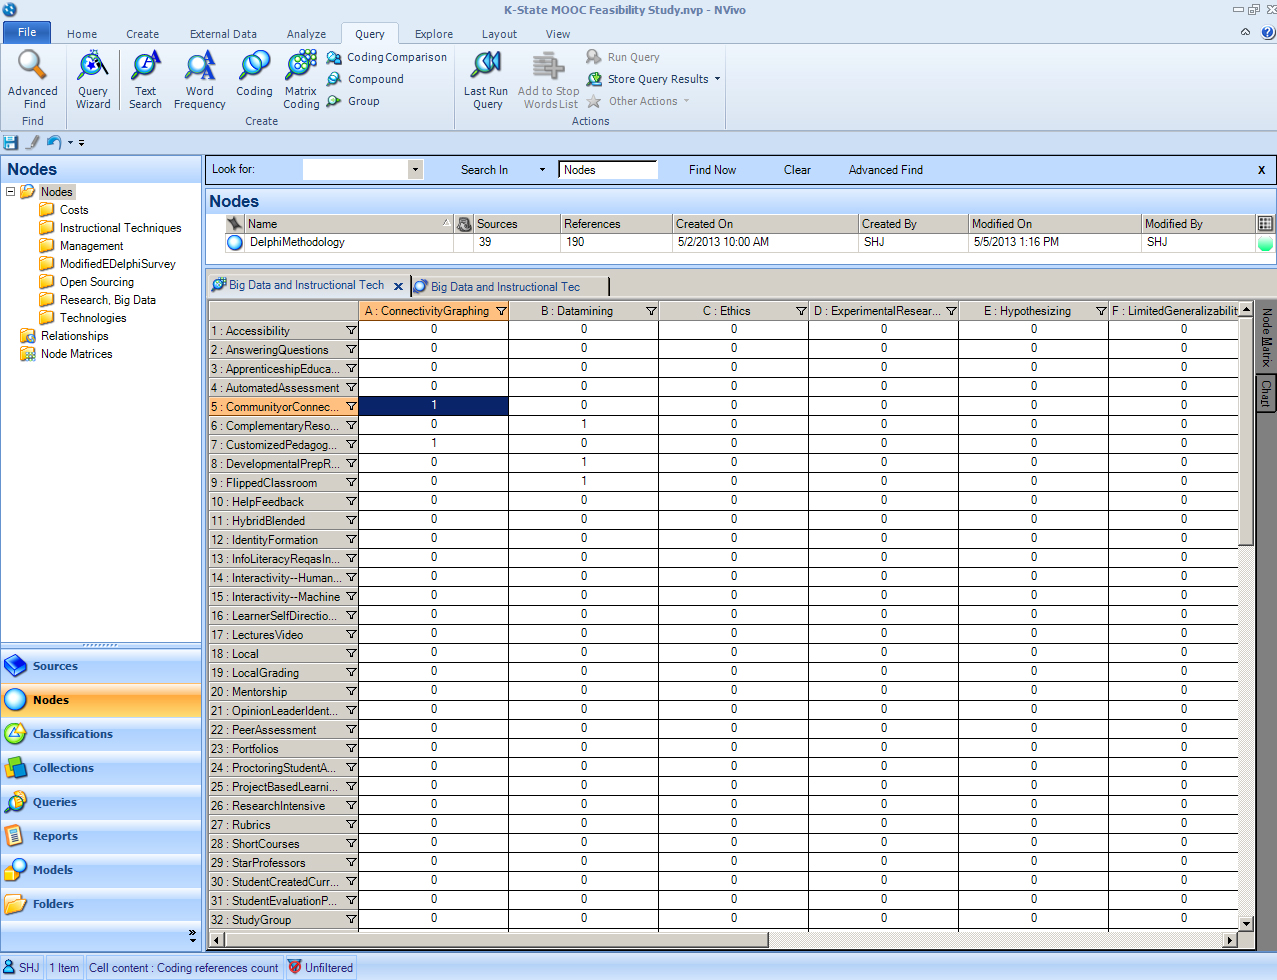
The matrix that is finally created shows a “1” if there is some overlap in textual information for the variables. It shows a “0” if no relationship was found. An intersection is highlighted below in the fully populated matrix. Note that there is a slider bar on both sides to enable viewing all the data.
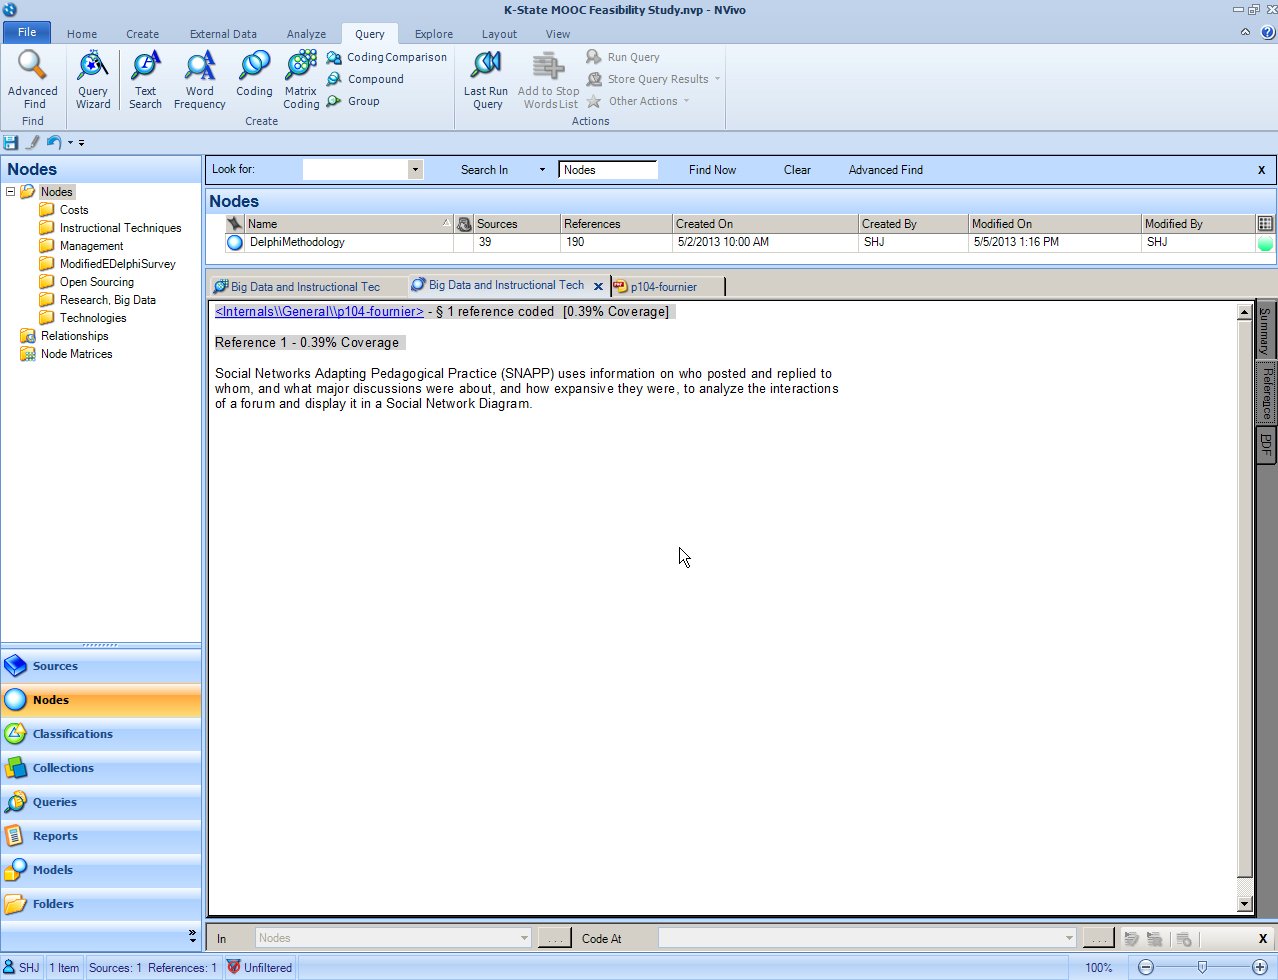
A double-click on the highlighted cell will bring up the textual coding where the two variables intersect / overlap. A click on the link “<internals…” in the active window will bring up the original sources.
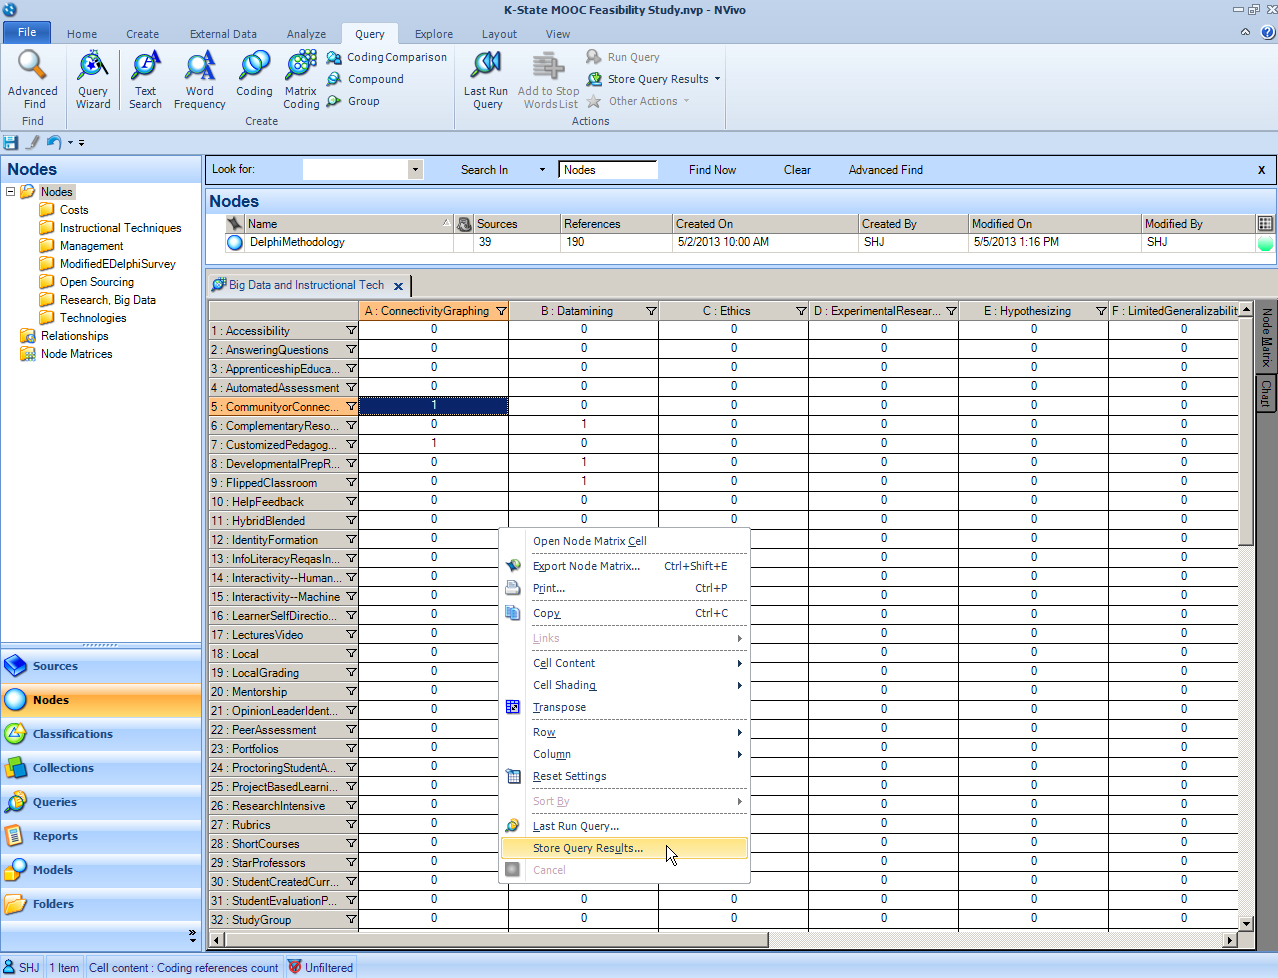
To store the query results, right click on the matrix. Click on the Store Query Results.
A window will open to allow users to indicate the location of the stored results. Otherwise, the default setting will be in the Node Matrices -> Results folder.
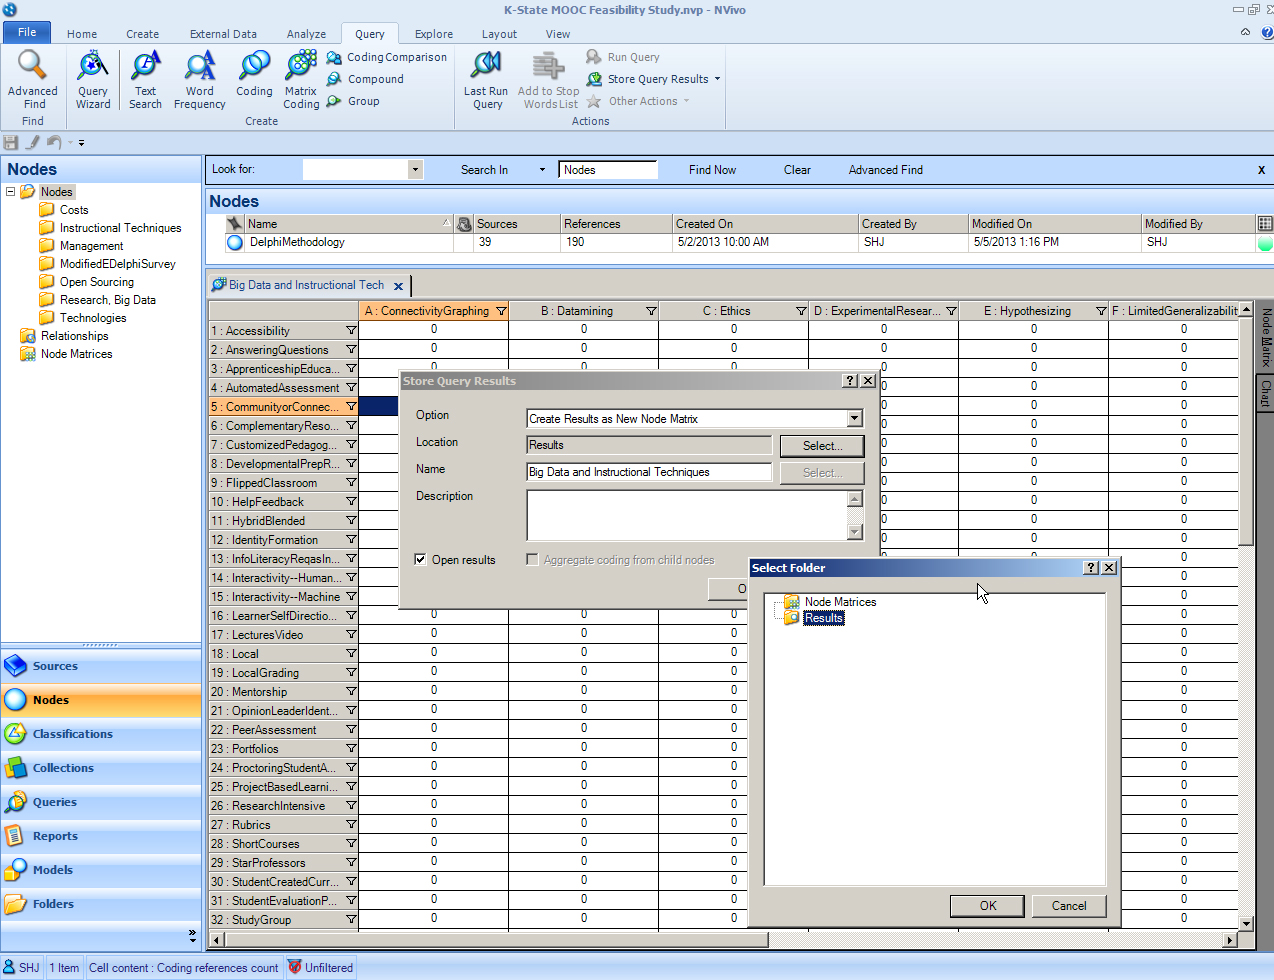
Some (Possible) Types of Matrix Coding Queries
Matrix for Identifying Source Hot Spots for Certain Topics
Row: Identified Themes or Concepts
Column: Extracted Sources from an Exhaustive Literature Review
Matrix for Surfacing New Themes
Row: Select top-level concept (node) and sub-concepts (sub-nodes)
Column: Select top-level concept (node) and sub-concepts (sub-nodes)
Matrix for Comparing Respondent / Participant Responses based on Demographic Characteristics
Row: Demographic data (one or a mix of the following for population subsets: sex; race; ethnicity; age group; geographical region, and others)
Column: Individual-based interviews or particular responses to particular questions
Matrix for Comparing Coder-to-Coder Coding
Row: Coder A v. Coder B
Column: A particular source or group of sources; the entire coding set
Matrix for Comparing Source-to-Source for Content Overlap
Row: Selected source (including datasets)
Column: Selected source (including datasets)
(Sorry, for those who prefer visuals, I should probably build out the above as visuals...)
A Walk-through with the "Query Wizard" Feature
Finally, it may be helpful to note that the Query Wizard (in the Query Tab in the Create area) may be used for a Matrix Coding query.
A downloadable slideshow (.pdf format) about using matrices for queries is available for download. This Matrix Coding Query slideshow is hosted on SlideShare.
More on Matrix Queries
A downloadable slideshow (.pdf format) about using matrices for queries is available for download. This Matrix Coding Query slideshow is hosted on SlideShare.
A matrix is a structure, then, that enables a kind of analysis based on the collected data and the placement of the variables.
Discussion of "Data Query: Matrix Coding Query"
matrix coding query
Hi Shalin.I have a doubt.
I would like to make a matrix coding query between two nodes that have:
1) "Do you believe that there is rivalry" (yes, no)
2) "MOOCs contribute to rivalry" (yes, no, maybe)
to find the intersection of respondents.
I'm following in the footsteps but the message that "the query did not return results"
what can I be doing wrong?
thankful
Melissa
Posted on 20 June 2015, 7:44 pm by Melissa | Permalink
Response to Melissa
Hello, Melissa: My apologies for not seeing this until now. For some reason--and it could be my settings--I do not get notices if a person has posted a comment on Scalar. Most people just email me directly. I am appreciative of your message. I'm not sure if this will actually post, but we'll see.To run your query as it is, you will need a possibly different data structure. You need one node for Yes on rivalry (with names listed to the yesses). You will need a node for No on rivalry (with names listed to the no's). You will need a node with yes to MOOCs contributing to rivalry; a node with no's linked to MOOCs contributing to rivalry, and maybes linked to MOOCs contributing to rivalry (and names linked to each of these respective stances). Each of your nodes would be lists of names...only. When you have a name that is mentioned on both, the matrix cells will indicate that overlap.
Then, your matrix has to be positioned with the first two nodes on either the rows or the columns, and then the MOOCs data (three nodes) on the other (rows or the columns).
Does this make any sense? I'll double back to see if you left any email. I didn't see any.
Posted on 9 July 2015, 8:30 am by Shalin Hai-Jew | Permalink
Email
Hello, Melissa: Please email me (shalin@k-state.edu) if you have further questions.Take care.
Posted on 9 July 2015, 8:35 am by Shalin Hai-Jew | Permalink
Add your voice to this discussion.
Checking your signed in status ...