CityBeat: A Social Media Data Visualization Platform for Journalists
Raz Schwartz, Mor Naaman, Chaolun Xia, Eddie Xie, Jeremy Ting, Adam Krebs, Jerry Reptak, Alexio Mota, Andrew Langdon, Daniel Borowski, Alyssa Katz, Claire Moses, and Mike Sullivan
Multimedia: thecitybeat.net for a live version of the system
Publicly shared social media data is a relatively new information stream that can potentially provide journalists with an additional signal about current city information. Unlike other streams of information, social media data—albeit noisy and biased—provides a real-time window into the social life of city inhabitants and their activity, in a manner that was not accessible before and may not be easily attainable from other sources.
The substantial adoption of social media platforms like Instagram and Twitter, especially in fast-growing global cities, is now providing access to large volumes of geo-tagged data that may reflect people's local activities and actions. This project examines how real-time geo-tagged social media data could be useful for journalists. Based on initial interviews with a group of journalists and local government officials, CityBeat was developed as an ambient display visualization interface to support the discovery of hyperlocal events in highly dense populated urban areas. CityBeat was co-developed with a group of journalists in an iterative design process, and deployed at several well-established news organizations in New York City.
Architecture of CityBeat
CityBeat was designed as an ambient interface with a map-based component, using visual cues for spikes of activity and key elements that require user attention. The system is implemented as a web-based ambient visualization meant for large displays in a newsroom or similar setting. The visualization, based on data from Instagram and Twitter, has three main components: the Detected Events List, Event Window, and the Statistics Sidebar. The Detected Events List is based on a social media event detection algorithm using Instagram data, and is visualized as an auto-scrolling list of all events discovered from the data in the past 24 hours. Each detected event on the list is noted on the background map by a pulsing circle placed in a specific geographical location. As the map moves from one location to another at the center of the screen, an Event Window presents a summary of the currently in-focus event including keywords, time of detection, and relevant photos, all automatically computed by the CityBeat system. To detect events in a stream of city-level social media data, we devised and implemented an algorithm that is geared to extract hyperlocal events, namely events that are occurring in a small region, e.g. a street corner or a venue.
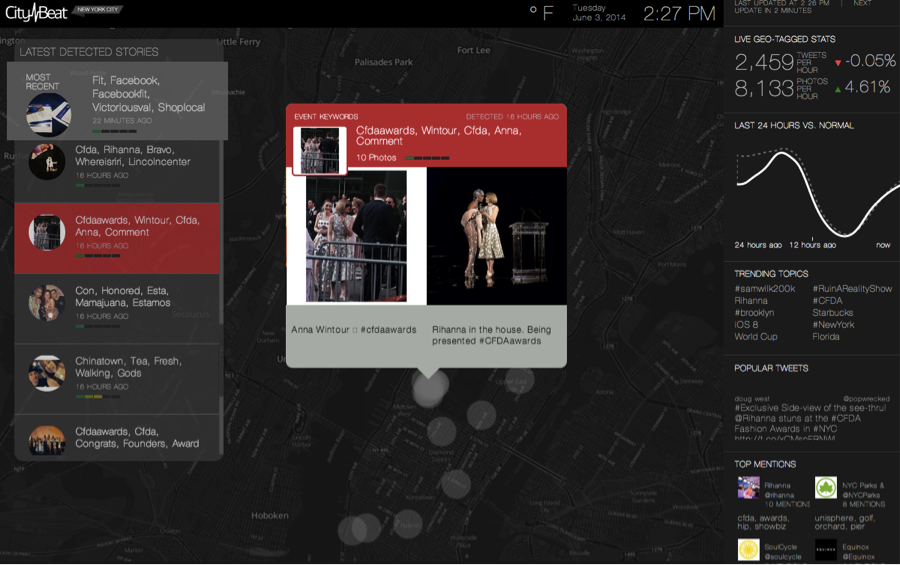
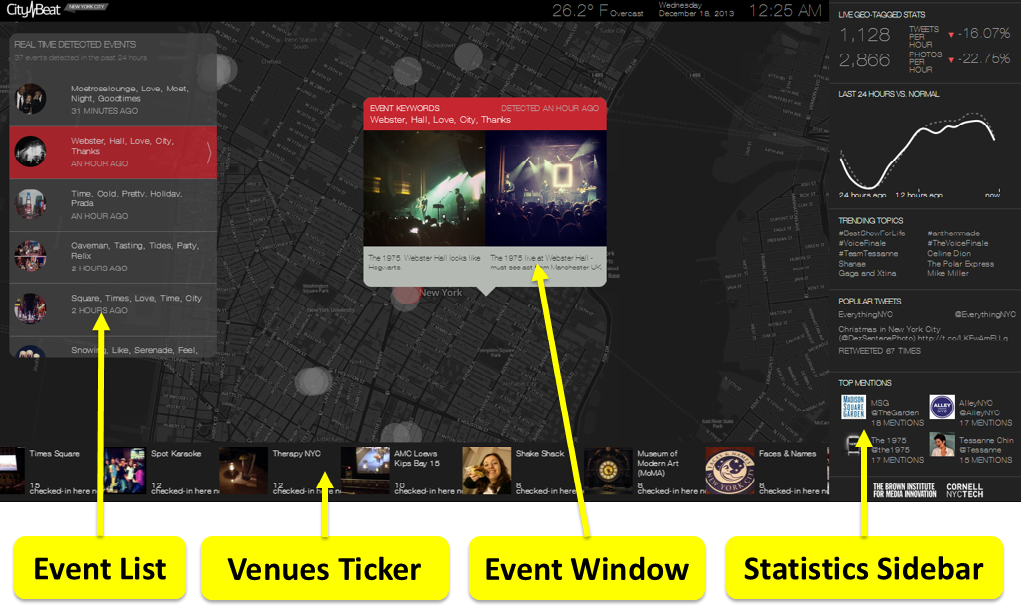
Screen shot of CityBeat ambient dis-play interface with 4 components: Detected Events List, Event Window, Statistics Sidebar and Trend-ing Venues Ticker.
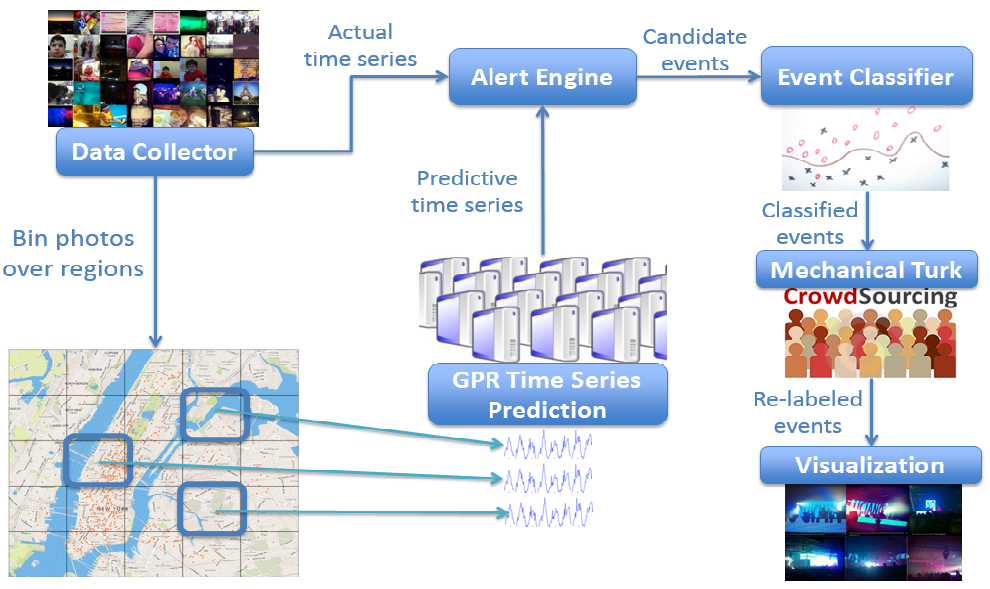
Performing robust hyperlocal event detection is challenging given the noise and scale of social media data, where the sparse signal for any location can be easily overwhelmed by irrelevant content. Since discovering and following breaking events in real-time is highly important for journalists, the CityBeat system focuses not only on robust and precise detection but also in real time. The algorithm uses geo-tagged Instagram data. Instagram is a popular photo sharing service that allows users to add location information to their photo. CityBeat collects all geotagged photos shared from New York City, averaging about 80,000 items per day (as of May 2014). Instagram data was selected first based on two main reasons: (1) The number of geotagged posts on Instagram is significantly higher than on Twitter and (2) In many cases Instagram photos depict the physical place in which they were taken. This is in contrary to geotagged Twitter posts that can refer to many other topics such as world news. Future iterations of the system plan on incorporating additional data from Twitter posts.
The system divides the data to sub-regions and models the time series data for each sub-region. An online alert engine compares the region's real-time data with the time series model for that region. If the engine discovers a significant deviation from the predicted amount of data (indicating a burst of social media activity), a candidate event is created, containing all the photos that contributed to the abnormal signal. In the following step, the candidate event is represented using a vector of spatial, lexical/topical and historical features based on the photos' data. A trained classifier determines whether the candidate event is a true event, based on these features.
A final step uses real-time crowdsourcing to improve the classification precision by removing false positives. Events are instantly sent to Amazon Mechanical Turk workers which are then asked to cast their judgment about the existence of an event, the type of event as well as help curate the relevant photos. In this way, detected events are further analyzed to find representative photos and flag important event keywords. Since the launch of the system, CityBeat detected events such as conferences, music concerts, outdoor festivals, gallery openings, sports events as well as emergencies like fires.
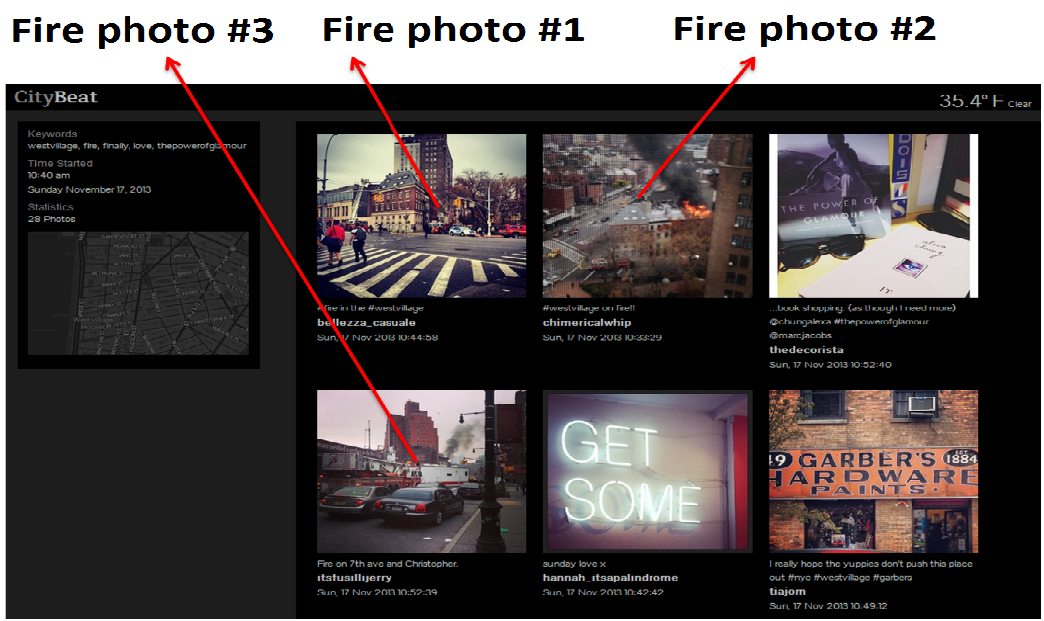
As an example, this event page shows the photos of the fire detected on Nov 17, 2013 at West Village.
The Statistics Sidebar provide aggregate representation of social media including the number of tweets and photos posted in the last hour in New York together with the percentage of change from the previous hour, the top most-mentioned Twitter accounts during the past hour in Twitter items geotagged to New York City, and the five most retweeted tweets that were geo-tagged in New York. We also show the city's trending topics extracted from Twitter API.
In this sidebar, we also plot the time series of photos and tweets volume for the city during the past 24 hours. The data from the past 24 hours are visualized by a solid colored curve, while the dashed curve represents the predicted time series (expected, “normal” levels). These two curves, representing the city's historical data vs. live data, can provide a quick visual indication when some unusual city-wide activity is occurring. These three components construct CityBeat: a social media dashboard for cities that utilizes information from multiple publicly available social streams to help journalists and newsrooms find local news events.
During 2014, the CityBeat team worked closely with The New York World editors and reporters. Working with The New York World provided indispensable editorial direction for the development of CityBeat, including shaping training data to help the CityBeat algorithm identify true events and reject false events; and ensuring the ambient display meets the needs of newsrooms seeking to discover untapped information and images. The World has also used CityBeat to curate coverage of the mayor's inauguration and find images and sources for news events. CityBeat is on constant display in the newsroom, provoking ongoing discussion and feedback in a live context, and guiding ongoing project development.
CityBeat is part of a larger effort to build new tools and systems to support the rapid growth of urban habitats.
Developers and researchers collaborate with CityBeat to contemplate the ways in which local information is discovered and propagated in years to come. CityBeat is a first prototype of these future systems to produce and disseminate local news.
Discussion of "CityBeat: A Social Media Data Visualization Platform for Journalists"
Add your voice to this discussion.
Checking your signed in status ...