Thanks for your patience during our recent outage at scalar.usc.edu. While Scalar content is loading normally now, saving is still slow, and Scalar's 'additional metadata' features have been disabled, which may interfere with features like timelines and maps that depend on metadata. This also means that saving a page or media item will remove its additional metadata. If this occurs, you can use the 'All versions' link at the bottom of the page to restore the earlier version. We are continuing to troubleshoot, and will provide further updates as needed. Note that this only affects Scalar projects at scalar.usc.edu, and not those hosted elsewhere.
Scalar 2 User's GuideMain MenuGetting StartedExplains account and book creation, and some interface basics.QuickStartsA path of all QuickStart content in this user's guide.Working with MediaHow to get the most out of your use of media in Scalar.Working with ContentCreating and editing content in Scalar.Working with WidgetsWorking with StructureHow to use Scalar's many options for structuring publications.Editorial WorkflowHow to use features for performing editorial review of content.VisualizationsExploring the contents of a book visually.LensesAn introduction to lenses, a tool for searching and visualizing Scalar content.Advanced TopicsDescribing Scalar's more advanced features.Third Party Plugins and Platforms
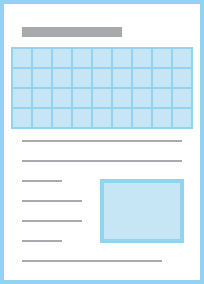
The Grid layout embeds a visualization at the top of the page that shows content as boxes in a grid. Colored lines are drawn representing connections between the current page and its related content. The rest of the page follows the Basic layout, with text and media interspersed.
The grid visualization displays all content in the book in a grid format where each box represents a piece of content, color-coded by type. The darker the box, the more connections it has to other content (relative to the other boxes). Each line represents a connection, color-coded by type. You can roll over or click the boxes to browse connections, or click to add more content to the current selection, allowing multiple sets of relationships to be viewed simultaneously. To deselect a box, simply click it again.
12014-10-01T16:38:34-07:00Erik Loyerf862727c4b34febd6a0341bffd27f168a35aa637Selecting a Page's Default LayoutCurtis Fletcher63Determining the default appearance of a page.plain2017-10-26T10:02:58-07:00Curtis Fletcher3225f3b99ebb95ebd811595627293f68f680673e