Scalar's 'additional metadata' features have been disabled on this install. Learn more.
Scalar 2 User's GuideMain MenuGetting StartedExplains account and book creation, and some interface basics.QuickStartsA path of all QuickStart content in this user's guide.Working with MediaHow to get the most out of your use of media in Scalar.Working with ContentCreating and editing content in Scalar.Working with WidgetsWorking with StructureHow to use Scalar's many options for structuring publications.Editorial WorkflowHow to use features for performing editorial review of content.VisualizationsExploring the contents of a book visually.LensesAn introduction to lenses, a tool for searching and visualizing Scalar content.Advanced TopicsDescribing Scalar's more advanced features.Third Party Plugins and Platforms
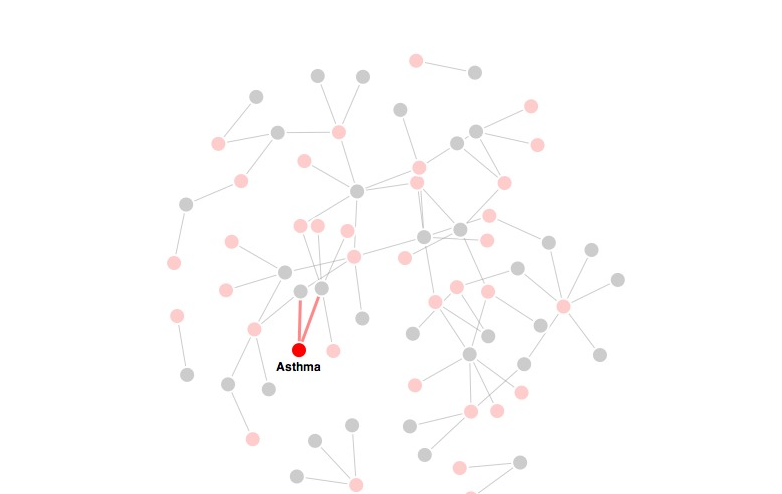
Tag Visualization
12014-10-01T16:38:34-07:00Erik Loyerf862727c4b34febd6a0341bffd27f168a35aa63732962A book's tags, rendered as a force-directed diagram.plain2015-05-28T14:39:56-07:00Erik Loyerf862727c4b34febd6a0341bffd27f168a35aa637Advanced TopicsExploring Scalar's more advanced features.
The tag visualization displays the book's tags in a force-directed graph, along with the content they tag. For performance reasons, only selected tags and their relationships are shown; to show all tags, all items must be deselected. Individual items can be selected and deselected by clicking. Double-clicking a title opens the associated content (page or media file).
This page has paths:
12014-10-01T16:38:34-07:00Erik Loyerf862727c4b34febd6a0341bffd27f168a35aa637VisualizationsErik Loyer3Exploring the contents of a book visually.plain127102015-05-28T14:44:07-07:00Erik Loyerf862727c4b34febd6a0341bffd27f168a35aa637
This page references:
12014-10-01T16:38:33-07:00Tag visualization view2A screenshot of Scalar's tag visualization.plain2015-05-28T14:40:06-07:00