Thanks for your patience during our recent outage at scalar.usc.edu. While Scalar content is loading normally now, saving is still slow, and Scalar's 'additional metadata' features have been disabled, which may interfere with features like timelines and maps that depend on metadata. This also means that saving a page or media item will remove its additional metadata. If this occurs, you can use the 'All versions' link at the bottom of the page to restore the earlier version. We are continuing to troubleshoot, and will provide further updates as needed. Note that this only affects Scalar projects at scalar.usc.edu, and not those hosted elsewhere.
Scalar 2 User's GuideMain MenuGetting StartedExplains account and book creation, and some interface basics.QuickStartsA path of all QuickStart content in this user's guide.Working with MediaHow to get the most out of your use of media in Scalar.Working with ContentCreating and editing content in Scalar.Working with WidgetsWorking with StructureHow to use Scalar's many options for structuring publications.Editorial WorkflowHow to use features for performing editorial review of content.VisualizationsExploring the contents of a book visually.LensesAn introduction to lenses, a tool for searching and visualizing Scalar content.Advanced TopicsDescribing Scalar's more advanced features.Third Party Plugins and Platforms
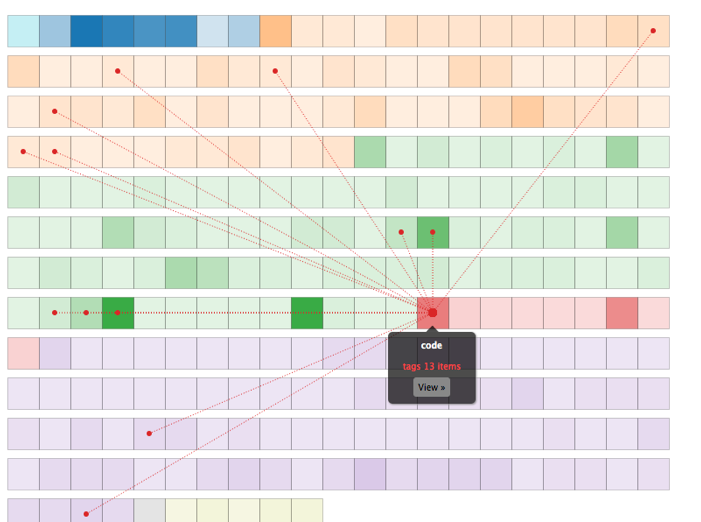
Grid Visualization
12014-10-01T16:38:31-07:00Erik Loyerf862727c4b34febd6a0341bffd27f168a35aa63732964A book's content, displayed in a grid.plain2015-05-28T14:37:47-07:00Erik Loyerf862727c4b34febd6a0341bffd27f168a35aa637
The grid visualization displays all content in the book in a grid format where each square represents one piece of content. Content is color-coded by type, and links between content are displayed on roll-over. Clicking a content element selects it, keeping its relationships visible even when rolling over other content, allowing multiple sets of relationships to be viewed simultaneously.
Clicking an item's "View" button opens the associated content (page or media file).
This page has paths:
12014-10-01T16:38:34-07:00Erik Loyerf862727c4b34febd6a0341bffd27f168a35aa637VisualizationsErik Loyer3Exploring the contents of a book visually.plain127102015-05-28T14:44:07-07:00Erik Loyerf862727c4b34febd6a0341bffd27f168a35aa637