Kim BR10-Easel_ly (and assorted others)
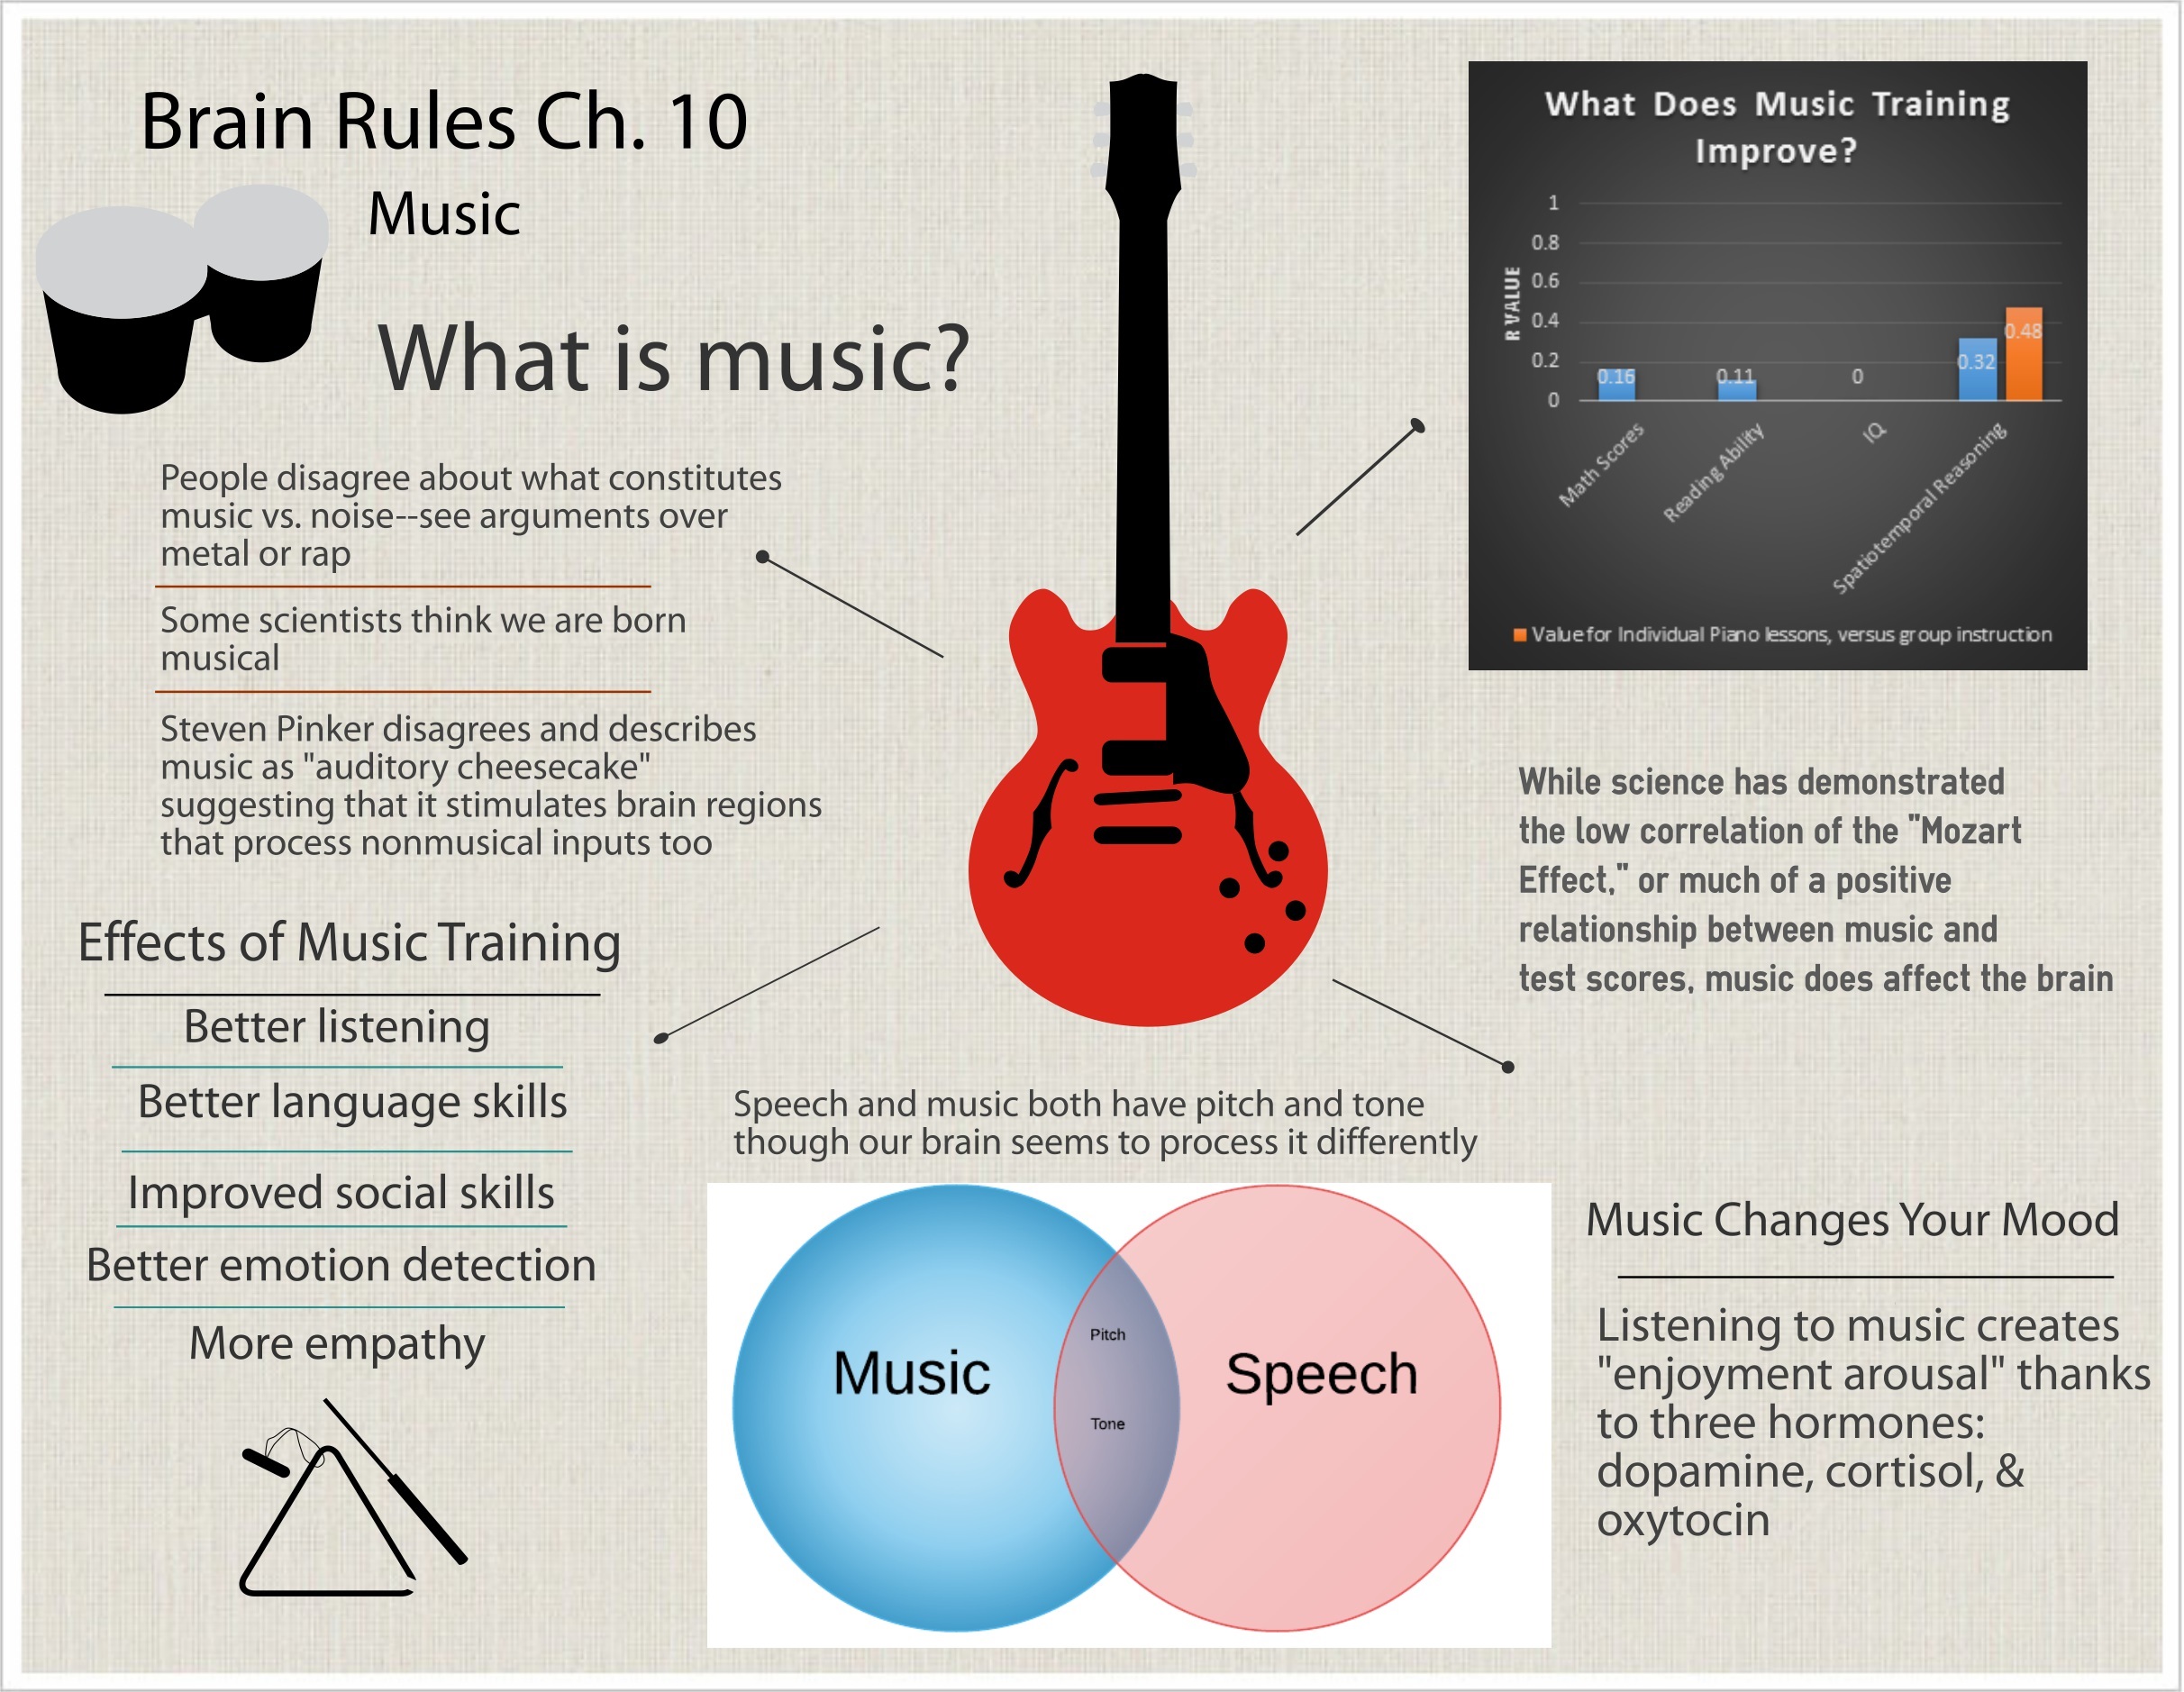
This week I tried out another infographic maker to try out for my major assignment project: easel_ly. In comparison to the program I used last week, there were a lot more templates to choose from with the free version. However, there were far fewer icons or images embedded within the program to chose from, with only a limited supply of icons. Lucky for me, one of the icon categories was music, so that fit in well with the content I was displaying. One of the reasons I was excited to try out this program was its ability to include charts into the infographic, which seemed like it would be a great asset as a way to visually represent data. Unfortunately for me, the chart maker within the program rounded values, so trying to make a chart with r values that were decimal values between 0 and 1 didn't work at all so I had to resort to making a chart in word, copying it to and saving it in paint and them uploading it as an image to easel_ly--lots of steps. Similarly, since Medina specifically describes the connection between speech and music with a Venn Diagram, I wanted to include that in my infographic; unfortunately, Venn Diagram isn't an option for charts, so I had to resort to making an Venn Diagram in another program (Lucid chart), copying and saving it in paint and then uploading it into easel_ly. I wish the program had a better internal chart maker so I could have avoided all those steps. I do like, though, that you can save your infographic as a pdf, which I think works well with my flyer (or flier?) assignment .
Well, since this chapter focused on music, I felt like I had to include music. Since an infographic program didn't allow me to do this, I ended up embedding an image of my infographic into a Prezi so I could have background music playing. The Prezi also zooms into various parts of the flyer so you can better read the content. I think a big takeaway for me this week is that sometimes you have to mix and match technologies and programs to get what you want.
Prezi with Easel_ly
This week I looked at Chvonne's use of Scoop.It and Amy's use of LiveBinders.
I appreciated and completely agreed with Chvonne's discussion of the frustration with the registration process and getting started with these technologies. I think this is an important aspect to remember when thinking about incorporating these technologies into the classroom because students will most likely feel this frustration too. I really like the ideas of using Scoop.It as a way to curate online research. I think this would really help students to stay organized with research, but could also encourage students to move beyond "sentence mining" by giving them the opportunity to write notes and "insights" about the sources.
LiveBinder looks like a really interesting program. I agree with Heather's comment that I can see connections between Googlesites or Wordpress, so I'd be interested to see how much easier or more difficult this program is. I thought Amy's suggestion to use this as an alternative to an LMS was really interesting, particularly because her organization was so logical and easy to follow. I appreciated the usability of the content being connected on a single page instead of discrete links like Blackboard.
| Previous page on path | Kim Fahle Bio, page 22 of 25 | Next page on path |
Discussion of "Kim BR10-Easel_ly (and assorted others)"
music
I love that you layered your apps so you could achieve your goal!Posted on 6 December 2014, 10:49 am by Shelley Rodrigo | Permalink
Add your voice to this discussion.
Checking your signed in status ...