Thanks for your patience during our recent outage at scalar.usc.edu. While Scalar content is loading normally now, saving is still slow, and Scalar's 'additional metadata' features have been disabled, which may interfere with features like timelines and maps that depend on metadata. This also means that saving a page or media item will remove its additional metadata. If this occurs, you can use the 'All versions' link at the bottom of the page to restore the earlier version. We are continuing to troubleshoot, and will provide further updates as needed. Note that this only affects Scalar projects at scalar.usc.edu, and not those hosted elsewhere.
C2C Digital Magazine (Spring/Summer 2023)
Main Menu
Letter from the C2C Chair -- Cheryl Zelle
This is a letter from the 2022 - 2023 C2C Chair, Cheryl Zelle.
The SHARE technique for designing assignments and assessments in the age of AI
This article is "The SHARE technique for designing assignments and assessments in the age of AI." This was written by Brent A. Anders.
Changing our classrooms to address COVID-19’s impact on cognition
This article is "Changing our classrooms to address COVID-19’s impact on cognition." This was written by Dr. Jessica A. Cannon.
Learning by doing: The flight path of Dr. Sheldon L. Eakins, an intrepid equity entrepreneur
This article is "Learning by doing: The flight path of Dr. Sheldon L. Eakins, an intrepid equity entrepreneur."
At the intersection of information science, learning technologies, and data science: A reflection of a three-article dissertation journey
This article is "At the intersection of information science, learning technologies, and data science: A reflection of a three-article dissertation journey." This is by Dr. Javier Leung.
A practical framework for ethics in educational technology
This research article is "A practical framework for ethics in educational technology."
“I have a need…the need for speed”: Why slowing down can benefit instructional design
This article is: “I have a need…the need for speed”: Why slowing down can benefit instructional design
Josh Lake: The cheerleader and life coach every school needs
This article is "Josh Lake: The cheerleader and life coach every school needs." This is by Dr. Robb Scott.
Animating and voicing digital puppets with Adobe Character Animator
This article is "Animating and voicing digital puppets with Adobe Character Animator."
A starter conversation about “educational technologies” with Bard AI and ChatGPT
This article is "A starter conversation about “educational technologies” with Bard AI and ChatGPT."
Using Aero to make mobile AR learning experiences
This article is "Using Aero to make mobile AR learning experiences."
Credible efficient pathways to project completion with AON diagrams
This article is "Credible efficient pathways to project completion with AON diagrams."
Book review: Shaping up online education post-pandemic
This article is "Book review: Shaping up online education post-pandemic ."
Book review: Harnessing computation for more sustainable living
This article is "Book review: Harnessing computation for more sustainable living."
Book review: Improving human decision-making by reducing bias and noise
This article is "Book review: Improving human decision-making by reducing bias and noise."
Book review: Harnessing problem solving as a superpower
This article is "Book review: Harnessing problem solving as a superpower."
Book review: Volunteer technologists breaking ransomware by criminal gangs
This work is titled "Book review: Volunteer technologists breaking ransomware by criminal gangs."
Book review: Helping advocacy citizen journalists upskill
This article is "Book review: Helping advocacy citizen journalists upskill."
SIDLIT Awards: 2001 - Present
This page shows "SIDLIT Awards: 2001 - Present."
Call for Article Submissions: Fall 2023 - Winter 2024
This page is "Call for Article Submissions: Fall 2023 - Winter 2024."
Colleague 2 Colleague
63e768dc8f8b0f24d3f519aec8f8ab91fe4a26a3
How to Create a Schedule Network Diagram in Excel
1 2022-11-12T11:57:41-08:00 Shalin Hai-Jew 0b2ab93fbfe95de74ca7fefa80ae22adae3a64ef 41407 1 GET THIS TEMPLATE PLUS 52 MORE here: ... plain 2022-11-12T11:57:41-08:00 Shalin Hai-Jew 0b2ab93fbfe95de74ca7fefa80ae22adae3a64efThis page is referenced by:
-
1
2022-11-15T08:59:34-08:00
Credible efficient pathways to project completion with AON diagrams
8
This article is "Credible efficient pathways to project completion with AON diagrams."
plain
2023-06-20T10:57:08-07:00
By Shalin Hai-Jew, Kansas State University
Professionals in project management have a wide range of ICT and other tools to help them manage the work: task schedulers, staffing, calendars, human resources systems, and others. I ran across a basic tool that may be executed in Excel, the so-called Activity-on-Node (AON) diagram (an example of a project network).
This short article explores a simple AON diagram that can be actualized manually for a basic project in a higher education context. While AON diagrams have been built into various computerized project management tools, even a basic manual setup may be informative. The simple math enables a back-of-the-napkin sort of scheduling for a project (although if the estimate is more high-value, more detailed inputs and oversight should be invested).
Infusing Work Efficiencies and Planner and Team Member Awareness with Planning
The basic rationale for an AON diagram is to map out the various chained sequential / semi-sequential tasks in order to better understand task activity dependencies and how much subsequent work depends on prior tasks. The goal of such planning is to minimize time lags on projects and to help project planners and others get a handle on work trajectory and complexity. Those working on a cross-functional team may better synchronize their efforts.
Video: How to Create a Schedule Network Diagram in Excel
[In the video, note the work breakdown structure in which deliverables are recorded, along with the work packages, activities, tasks, prior dependencies, activity sequences, responsible parties (bureaucratic units or staff), and then the “estimate confidence.” Every model involves various assumptions, and spelling out how confident the assumptions are in a systematic way may result in a more accurate model. I also like the table with the column headers of Activity, Predecessor, and Duration, because this also simplifies the AON diagram and captures the most important basic information related to time.]
The mapping out of the various work activities and sequences enables better planning, so that conflicts in the order of the work may be avoided. The idea is that avoiding work re-dos can be beneficial.
A Set of Activities, Required Time, and Task Interrelationships
It may help to loosely define some terms. The work “project” is defined in part as time segments or durations. “Float” or “slack” refers to the amount of time that a particular task activity, a network path, or even a project can be delayed from the early start (ES) without negatively affecting the completion of the project (the “drop-dead date,” the “hard deadline”). A “total float” for a project refers to the difference between the finish data of the last activity of the critical path and the actual project completion date.
A “critical path” refers to a series (ordered sequence) of nodes (activities) and links (precedence relationships, representing preconditions) that has no substitutions for tasks; here, a lag in any part of the critical path will affect the overall amount of time required in the project work. Various parts of a project may be achieved without preemption. Depending on the tasks being modeled, various critical activities will manifest in different ways. The Critical Path Method was developed in the 1950s.
A project may be completed through the achieving of the work tasks along different paths. Some of the paths are more efficient than others. Changes in-world may force switching from one path to another. The ceteris paribus assumption (all things being equal, general conditions remaining the same) at the start of a project may not hold as the project progresses. After all, staff turnover, technology snafus, unplanned costs, and other changes are not unlikely. Clients change their minds. There are dynamic exogenous and endogenous factors.
AON diagrams help the leadership and the team members think through a project and the decisions they are making and the outcomes they are striving to achieve.
Various technologies enable forwards and backwards mapping of tasks, to enable new learning, and new efficiencies that may have been invisible before.
Estimating Time for Each Task
Clearly, the accuracy of the work required, the capabilities of the staff, and the accuracy of estimated time required for each task will affect the overall accuracy of the model. The much-observed “optimism bias” is a weakness for inexperienced AON modelers who assume much more can be done with much less. Some will use timings from prior projects, breakdowns of tasks into unit parts, or other formulas to set a timeline estimate. A formula known as PERT is calculated as follows:
[optimistic estimate + (4* most likely time estimate] + pessimistic estimate]
6
The equation captures the min-max upper- and lower-bound estimates and weights the most likely (practicable) estimate in the equation. Prior experiences are seen to be informative of the most likely estimate.
About the Links between Task Activities: Four Main Time Relationships based on the Precedence Diagram Method (PDM)
AON diagrams are a sub-type of precedence diagrams, and it uses the “precedence diagram method” (PDM). AON diagrams are also an example or subtype of schedule network diagrams.
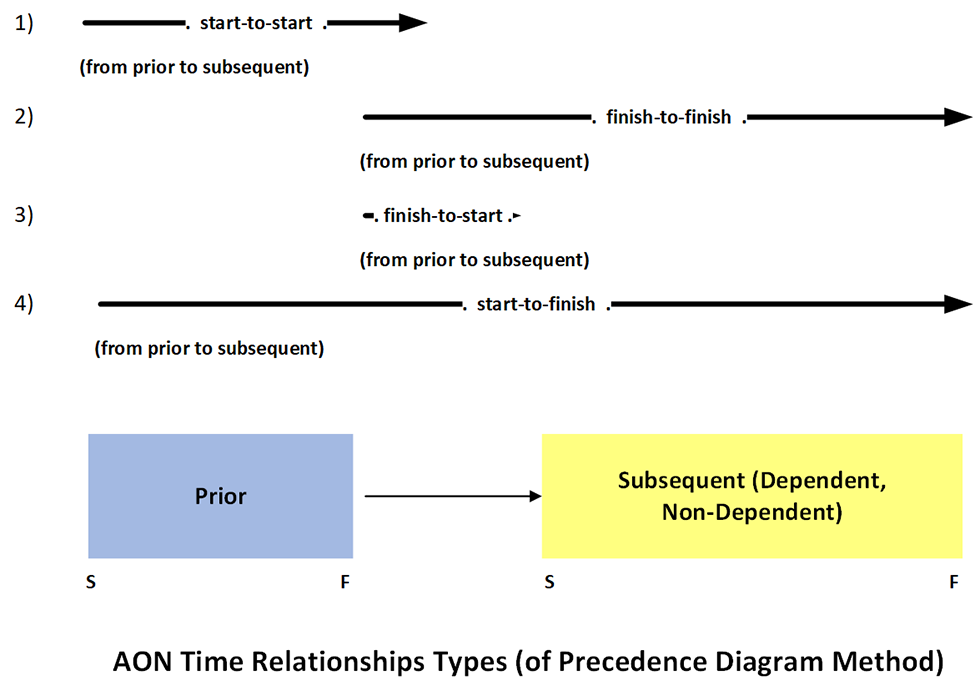
Once those time estimates are available (and are labeled with the level of confidence for that estimate), it is possible to capture specific numbers for four main important time relationships between the nodes in a sequence. In the traditional construct, they include the following: start-to-start, finish-to-finish, finish-to-start, and start-to-finish relationships between any two linked nodes (activities). In the visual below, the nodes or activities are the rectangle listed as “prior” and the next as “subsequent.”
Figure 1. AON Time Relationships Types (of Precedence Diagram Method)
A fully mapped project would be a complex and labeled node-link diagram of all activities. Behind all the estimates should be deep knowledge of the work and the “space” around the work. Beyond its design, a model is only as good as the accuracy of its inputs. Once those elements are clear, it may be easier to condense work and project the quickest time a project may complete or the longest time a project may take (if all assumed lagging phenomena come to pass).
The more complex a project—think collaborations across organizations, think engineering or science angles, think supply chains, think regulatory oversights—the more relevant it would be to harness AON diagrams or project management technologies that enable “precedence diagramming” through “precedence networks.” This basic approach can be complexified, and it may be used with dedicated tools (vs. a general spreadsheet tool.
An AON Template
One simple setup for AON templates involves defining basic unit elements of a task activity in a project work chain. The activities should vary by type and should be calculable with the same scale throughout (such as hours, days, weeks, months, or some combination of the prior). Based on common practice in particular fields, there may be conventions used for the depiction of particular work.
The elements are as follows:- Task Activity
- Duration (D)
- Early Start (ES)
- Early Finish (EF)
- Late Start (LS)
- Float (F) [or “Slack” or “Leeway”]
- Late Finish (LF)
One general layout look follows:
Early Start (ES)
Duration (D)
Early Finish (EF)
Task Activity
Late Start (LS)
Float (F) [or “Slack” or “Leeway”]
Late Finish (LF)
The Early Start, Late Start, Early Finish, and Late Finish, are listed as Days, as in Day 1, Day 2, Day 3, etc., from the start day of the project and counting consecutively until the finish of the project. There may be gaps between tasks, however, given the real-world complexity of projects. The Duration cell is comprised of the numbers of days required to complete the particular task activity (independent of the Early Start-Early Finish, Late Start-Late Finish). The “Float” or “Slack” or “Leeway” is sort of the main point of AON diagrams. The activity task Float identifies the amount of time that an activity may be delayed with affecting subsequent work tasks negatively (by delaying other follow-on parts of the project). This is calculated by subtracting the late start from the early start (you save time by starting early) and by taking paths with work activities that have lower time durations.
A forward pass determines the early starts of the activities (based on the estimated duration for each task). A backward pass is done to figure out the late finishes. Then, late starts are used to subtract early starts to capture the possible floats for each of the task activities. With the mapping available, the critical paths are identified. Critical paths are identified when the Early Finish (EF) and the Late Finish (LF) are the same (as highlighted in the pink in the visual). In the forward analysis, the largest of the early starts are carried forward if multiple arrows point to the forward cell. In the backward analysis, the smallest of the Late Starts is carried to the prior on a backward pass. The idea is that all precursor activities have to be given sufficient time to be achieved. The layout of the AON diagram is based on a general chronological time sequence, from left to right.
In the video, note the approach for filling out the ES, LS, EF, and LF variables. The video begins with a Table of Dependencies, which is a useful summary construct.
Video: Use forward and backward pass to determine project duration and critical path
A “critical path” is defined as sequences of zero-slack task activities in a project. These paths are identified through various criticality analyses, and these use the four relationships mentioned above. Some six classes of relationships between task activities are part of this calculation: “normal, reverse, neutral, bicritical, increasing normal and decreasing reverse” (Valls & Lino, 2001, p. 17). A project’s duration cannot be shorter than the sum of its critical paths or its single critical path. In terms of areas that project managers may look for slack (ways to save on time), a critical path is not generally one. After all, any delay or lag in the critical path will affect the project’s complete date. Critical paths with 0 slack are often part of the longest paths of the network, aka the critical paths.
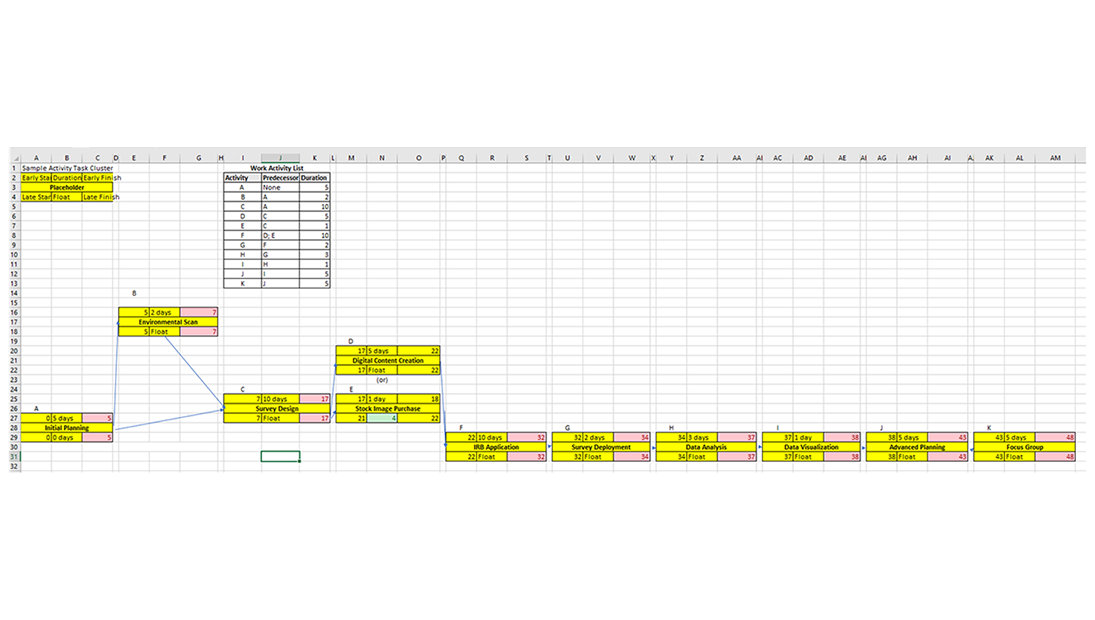
A Simple AON Diagram
So what might a manual AON diagram look like, at least in simple form? The following shows a 48-day project...with a few days of slack possible only. Rather, most of the depicted sequence is time-linear and on a critical path.
Figure 2. A Quick Sample AON Diagram
As to modeling complexity, there are some types of models where paths can enter and exit particular tasks at various stages, whether from the start point or the end point, so there are complexities. Some paths may enter a task sequence from the Finish, which has implications on shortening the finish time of the project (the activity is already completed). Some activities may be split into different paths, with finer points of duration and early and late starts and finishes. Other task activities are not able to be split at all. Some projects can be parallelized, so that different teams are working on different parts, to speed up the work and to enable an earlier completion date, ceteris paribus.
For a project’s Total Float (TF), the cumulative information is studied to figure out the latest that an activity start time can be delayed…or an activity duration increased…without delaying the project’s completion time. This can also show how much accelerating a start date or lowering the duration of a task may advance the project’s projected completion time. This is the cumulative leeway or slack in a project.
All incoming links to an activity node affects its starting point, and all exiting links affect its ending point (and those activities that are dependent on that particular task activity node).
There are variations on AON mapping, with extended mapping, to include higher dimensional modeling. For the various projects, there are different conditions related to human resources, material resources, budgets, leadership, and other factors, that may affect how the project actually functions.
Different Representations of AON Diagrams as Visuals, as Equations
An AON diagram is represented in different ways visually. A common approach is a node-link (or vertex-arc) diagram. Here, nodes or vertices represent activities and links or arcs show precedence relationships (basic setup) (Valls & Lino, 2001, p. 18).
While “AON” references “nodes” (as the location of the activities), AON diagrams may be depicted as various types of diagrams: linked bar charts, flowcharts, time-scale networks, time-scale timelines, structured trees, and others.
Equation-wise, the network-based schedule diagram is represented as a set: G = (V, A), where G is the AON diagram, and it equals the set of all the vertices and arcs (all the nodes and links). This is for a basic AON diagram.
Video: Calculating Critical Path with Forward and Backward Pass – Key Concepts in Project Management
Conclusion
This work offers a simple sense of a manual Activity-on-Node (AON) diagram. This approach reads as very intuitive to me, and it also reads as practically valuable.
In all projects, some parts are negotiable, and other parts not. Project objectives are often non-negotiable. Branding is non-negotiable. Laws related to intellectual property, privacy protections, publishing, accessibility, and such, are non-negotiable. Working technologies are non-negotiable. Hard deadlines are non-negotiable (or highly expensive to break).
Soft deadlines are negotiable. Work assignments may be somewhat negotiable. Some developmental technologies are negotiable. And so on.
In the real-world, the project mapping can become quite intensive. For those who want to learn more, there are many resources on social media, the academic research literature, commercial software documentation, and others.
AONs are a good way to enable a team to collaborate around their shared understandings of the work.
References
Valls, V., & Lino, P. (2001). Criticality analysis in activity-on-node networks with minimal time lags. Annals of Operations Research, 102, 17 – 37.
About the Author
Shalin Hai-Jew works as an instructional designer and researcher at Kansas State University. Her email is shalin@ksu.edu.