Thanks for your patience during our recent outage at scalar.usc.edu. While Scalar content is loading normally now, saving is still slow, and Scalar's 'additional metadata' features have been disabled, which may interfere with features like timelines and maps that depend on metadata. This also means that saving a page or media item will remove its additional metadata. If this occurs, you can use the 'All versions' link at the bottom of the page to restore the earlier version. We are continuing to troubleshoot, and will provide further updates as needed. Note that this only affects Scalar projects at scalar.usc.edu, and not those hosted elsewhere.
Introduction to Digital HumanitiesMain MenuWhat is Digital Humanities?Module I: A Theoretical IntroductionExploring The Tool BoxModule I: An Experiential IntroductionCreating Digital IdentitiesModule I: A Personal IntroductionConstructing DataModule II: DH MethodsWorking with Big DataModule II: DH MethodsMappingModule II: DH MethodsDistant ReadingModule II: DH MethodsNetwork AnalysisModule II: DH MethodsCritical Platform StudiesModule III: Critical PerspectivesPostcolonial and Intersectional Digital HumanitiesModule III: Critical PerspectivesDH ProjectModule IV: Creative ExpressionsAndrea Davise50475e163fb87bc8bd10c6c0244468fd91e8da5Digital Humanities Certificate
Data Visualization
12019-04-30T19:25:22-07:00Andrea Davise50475e163fb87bc8bd10c6c0244468fd91e8da5308625Module II: DH Methodsplain2019-04-30T20:34:23-07:00Andrea Davise50475e163fb87bc8bd10c6c0244468fd91e8da5 This week we will examine some of the promises and pitfalls of communicating humanities research in the visual mode.
Annotation #6
1. Yau, Nathan. Data Points: Visualization That Means Something. Indianapolis, IN: John Wiley and Sons, 2013. Chapter 3. Hypothes.is link.
2. Johanna Drucker, “Humanities Approaches to Graphical Display,” Digital Humanities Quarterly 5, no. 1 (2011). Hypothes.is link.
Use one of Dr. John Rasp's Data Sets for Classroom Use to build a simple data visualization with Tableau, Raw Graphs, or Morphdoing your best to adhere to the principles Nathan Yau lays out in Data Points. Embed your visualization on your "Assignment #6" page and discuss what your visualization tells you that you couldn’t see from the data itself, and why you selected a particular visualization tool(s). Be sure to follow the instructions on the "Assignment" page of our workbook to make sure that it shows up in the contents of your personal page and the "Assignment #6" page.
This page has paths:
1media/nypl.digitalcollections.510d47df-9e13-a3d9-e040-e00a18064a99.001.w.jpgmedia/nypl.digitalcollections.510d47df-9e13-a3d9-e040-e00a18064a99.001.w.jpg2018-07-13T14:35:23-07:00Andrea Davise50475e163fb87bc8bd10c6c0244468fd91e8da5AssignmentsAndrea Davis143Requirements, Prompts, Due Datesimage_header2019-05-01T12:50:04-07:00Andrea Davise50475e163fb87bc8bd10c6c0244468fd91e8da5
This page references:
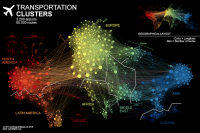
12018-07-10T00:24:20-07:00Network Visualization1Martin Grandjean, "Connected World: Untangling the Air Traffic Network," 26/05/2016. http://www.martingrandjean.ch/connected-world-air-traffic-network/plain2018-07-10T00:24:20-07:00
12018-07-10T00:24:08-07:00Humanities + Digital Tools: Palladio1This video in the Stanford Humanities + Digital Tools series features "Palladio," a web-based platform that allows humanities scholars to easily upload data and explore it through a variety...plain2018-07-10T00:24:09-07:00