Grid Visualization
1 2014-10-01T16:38:31-07:00 Erik Loyer f862727c4b34febd6a0341bffd27f168a35aa637 3296 11 A book's content, displayed in a grid. plain 2016-10-17T09:07:41-07:00 Curtis Fletcher 3225f3b99ebb95ebd811595627293f68f680673ePage
| resource | rdf:resource | https://scalar.usc.edu/works/guide2/index-visualization |
| type | rdf:type | http://scalar.usc.edu/2012/01/scalar-ns#Composite |
| is live | scalar:isLive | 1 |
| was attributed to | prov:wasAttributedTo | https://scalar.usc.edu/works/guide2/users/379 |
| created | dcterms:created | 2014-10-01T16:38:31-07:00 |
Version 11
| resource | rdf:resource | https://scalar.usc.edu/works/guide2/index-visualization.11 |
| versionnumber | ov:versionnumber | 11 |
| title | dcterms:title | Grid Visualization |
| description | dcterms:description | A book's content, displayed in a grid. |
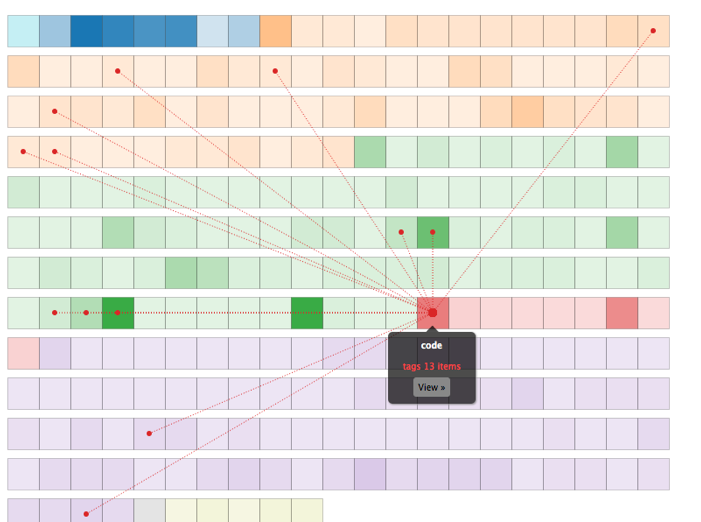
| content | sioc:content | The grid visualization displays all content in the book in a grid format where each box represents a piece of content, color-coded by type. The darker the box, the more connections it has to other content (relative to the other boxes). Each line represents a connection, color-coded by type. You can roll over or click the boxes to browse connections, or click to add more content to the current selection, allowing multiple sets of relationships to be viewed simultaneously. To deselect a box, simply click it again. Clicking an item's "View" button opens the associated content (page or media file). |
| default view | scalar:defaultView | plain |
| was attributed to | prov:wasAttributedTo | https://scalar.usc.edu/works/guide2/users/913 |
| created | dcterms:created | 2016-10-17T09:07:41-07:00 |
| type | rdf:type | http://scalar.usc.edu/2012/01/scalar-ns#Version |
Version 10
| resource | rdf:resource | https://scalar.usc.edu/works/guide2/index-visualization.10 |
| versionnumber | ov:versionnumber | 10 |
| title | dcterms:title | Grid Visualization |
| description | dcterms:description | A book's content, displayed in a grid. |
| content | sioc:content | The grid visualization displays all content in the book in a grid format where each box represents a piece of content, color-coded by type. The darker the box, the more connections it has to other content (relative to the other boxes). Each line represents a connection, color-coded by type. You can roll over or click the boxes to browse connections, or click to add more content to the current selection, allowing multiple sets of relationships to be viewed simultaneously. To deselect a box, simply click it again. Clicking an item's "View" button opens the associated content (page or media file). |
| default view | scalar:defaultView | visindex |
| was attributed to | prov:wasAttributedTo | https://scalar.usc.edu/works/guide2/users/913 |
| created | dcterms:created | 2015-12-02T21:27:05-08:00 |
| type | rdf:type | http://scalar.usc.edu/2012/01/scalar-ns#Version |
Version 9
| resource | rdf:resource | https://scalar.usc.edu/works/guide2/index-visualization.9 |
| versionnumber | ov:versionnumber | 9 |
| title | dcterms:title | Grid Visualization |
| description | dcterms:description | A book's content, displayed in a grid. |
| content | sioc:content | The grid visualization displays all content in the book in a grid format where each box represents a piece of content, color-coded by type. The darker the box, the more connections it has to other content (relative to the other boxes). Each line represents a connection, color-coded by type. You can roll over or click the boxes to browse connections, or click to add more content to the current selection, allowing multiple sets of relationships to be viewed simultaneously. To deselect a box, simply click it again. Clicking an item's "View" button opens the associated content (page or media file). |
| default view | scalar:defaultView | plain |
| was attributed to | prov:wasAttributedTo | https://scalar.usc.edu/works/guide2/users/913 |
| created | dcterms:created | 2015-05-28T23:04:04-07:00 |
| type | rdf:type | http://scalar.usc.edu/2012/01/scalar-ns#Version |
Version 8
| resource | rdf:resource | https://scalar.usc.edu/works/guide2/index-visualization.8 |
| versionnumber | ov:versionnumber | 8 |
| title | dcterms:title | Grid Visualization |
| description | dcterms:description | A book's content, displayed in a grid. |
| content | sioc:content | The grid visualization displays all content in the book in a grid format where each box represents a piece of content, color-coded by type. The darker the box, the more connections it has to other content (relative to the other boxes). Each line represents a connection, color-coded by type. You can roll over or click the boxes to browse connections, or click to add more content to the current selection, allowing multiple sets of relationships to be viewed simultaneously. To deselect a box, simply click it again. Clicking an item's "View" button opens the associated content (page or media file). |
| default view | scalar:defaultView | plain |
| was attributed to | prov:wasAttributedTo | https://scalar.usc.edu/works/guide2/users/913 |
| created | dcterms:created | 2015-05-28T23:02:08-07:00 |
| type | rdf:type | http://scalar.usc.edu/2012/01/scalar-ns#Version |
Version 7
| resource | rdf:resource | https://scalar.usc.edu/works/guide2/index-visualization.7 |
| versionnumber | ov:versionnumber | 7 |
| title | dcterms:title | Grid Visualization |
| description | dcterms:description | A book's content, displayed in a grid. |
| content | sioc:content | The grid visualization displays all content in the book in a grid format where each box represents a piece of content, color-coded by type. The darker the box, the more connections it has to other content (relative to the other boxes). Each line represents a connection, color-coded by type. You can roll over or click the boxes to browse connections, or click to add more content to the current selection, allowing multiple sets of relationships to be viewed simultaneously. To deselect a box, simply click it again. Clicking an item's "View" button opens the associated content (page or media file). |
| default view | scalar:defaultView | plain |
| was attributed to | prov:wasAttributedTo | https://scalar.usc.edu/works/guide2/users/913 |
| created | dcterms:created | 2015-05-28T23:00:18-07:00 |
| type | rdf:type | http://scalar.usc.edu/2012/01/scalar-ns#Version |
Version 6
| resource | rdf:resource | https://scalar.usc.edu/works/guide2/index-visualization.6 |
| versionnumber | ov:versionnumber | 6 |
| title | dcterms:title | Grid Visualization |
| description | dcterms:description | A book's content, displayed in a grid. |
| content | sioc:content | The grid visualization displays all content in the book in a grid format where each box represents a piece of content, color-coded by type. The darker the box, the more connections it has to other content (relative to the other boxes). Each line represents a connection, color-coded by type. You can roll over or click the boxes to browse connections, or click to add more content to the current selection, allowing multiple sets of relationships to be viewed simultaneously. To deselect a box, simply click it again. Clicking an item's "View" button opens the associated content (page or media file). |
| default view | scalar:defaultView | plain |
| was attributed to | prov:wasAttributedTo | https://scalar.usc.edu/works/guide2/users/379 |
| created | dcterms:created | 2015-05-28T14:47:37-07:00 |
| type | rdf:type | http://scalar.usc.edu/2012/01/scalar-ns#Version |
Version 5
| resource | rdf:resource | https://scalar.usc.edu/works/guide2/index-visualization.5 |
| versionnumber | ov:versionnumber | 5 |
| title | dcterms:title | Grid Visualization |
| description | dcterms:description | A book's content, displayed in a grid. |
| content | sioc:content | The grid visualization displays all content in the book in a grid format where each box represents a piece of content, color-coded by type. The darker the box, the more connections it has to other content (relative to the other boxes). Each line represents a connection, color-coded by type. You can roll over or click the boxes to browse connections, or click to add more content to the current selection, allowing multiple sets of relationships to be viewed simultaneously. Clicking an item's "View" button opens the associated content (page or media file). |
| default view | scalar:defaultView | plain |
| was attributed to | prov:wasAttributedTo | https://scalar.usc.edu/works/guide2/users/379 |
| created | dcterms:created | 2015-05-28T14:46:06-07:00 |
| type | rdf:type | http://scalar.usc.edu/2012/01/scalar-ns#Version |
Version 4
| resource | rdf:resource | https://scalar.usc.edu/works/guide2/index-visualization.4 |
| versionnumber | ov:versionnumber | 4 |
| title | dcterms:title | Grid Visualization |
| description | dcterms:description | A book's content, displayed in a grid. |
| content | sioc:content | The grid visualization displays all content in the book in a grid format where each square represents one piece of content. Content is color-coded by type, and links between content are displayed on roll-over. Clicking a content element selects it, keeping its relationships visible even when rolling over other content, allowing multiple sets of relationships to be viewed simultaneously. Clicking an item's "View" button opens the associated content (page or media file). |
| default view | scalar:defaultView | plain |
| was attributed to | prov:wasAttributedTo | https://scalar.usc.edu/works/guide2/users/379 |
| created | dcterms:created | 2015-05-28T14:37:47-07:00 |
| type | rdf:type | http://scalar.usc.edu/2012/01/scalar-ns#Version |
Version 3
| resource | rdf:resource | https://scalar.usc.edu/works/guide2/index-visualization.3 |
| versionnumber | ov:versionnumber | 3 |
| title | dcterms:title | Grid Visualization |
| description | dcterms:description | A book's content, displayed in a grid. |
| content | sioc:content | The grid visualization displays all content in the book in a grid format where each square represents one piece of content. Content is color-coded by type, and links between content are displayed on roll-over. Clicking a content element selects it, keeping its relationships visible even when rolling over other content, allowing multiple sets of relationships to be viewed simultaneously. Clicking an item's "View" button opens the associated content (page or media file). |
| default view | scalar:defaultView | plain |
| was attributed to | prov:wasAttributedTo | https://scalar.usc.edu/works/guide2/users/379 |
| created | dcterms:created | 2015-05-28T14:37:20-07:00 |
| type | rdf:type | http://scalar.usc.edu/2012/01/scalar-ns#Version |
Version 2
| resource | rdf:resource | https://scalar.usc.edu/works/guide2/index-visualization.2 |
| versionnumber | ov:versionnumber | 2 |
| title | dcterms:title | Grid Visualization |
| description | dcterms:description | A book's content, displayed in a grid. |
| content | sioc:content | The grid visualization displays all content in the book in a grid format where each square represents one piece of content. Content is color-coded by type, and links between content are displayed on roll-over. Clicking a content element selects it, keeping its relationships visible even when rolling over other content, allowing multiple sets of relationships to be viewed simultaneously. Clicking an item's "View" button opens the associated content (page or media file). |
| default view | scalar:defaultView | plain |
| was attributed to | prov:wasAttributedTo | https://scalar.usc.edu/works/guide2/users/379 |
| created | dcterms:created | 2015-05-28T14:35:14-07:00 |
| type | rdf:type | http://scalar.usc.edu/2012/01/scalar-ns#Version |
Version 1
| resource | rdf:resource | https://scalar.usc.edu/works/guide2/index-visualization.1 |
| versionnumber | ov:versionnumber | 1 |
| title | dcterms:title | Index Visualization |
| description | dcterms:description | A book's content, displayed in a grid. |
| content | sioc:content | The index visualization displays all content in the book in a grid format where each square represents one piece of content. Content is color-coded by type, and links between content are displayed on roll-over. Clicking a content element selects it, keeping its relationships visible even when rolling over other content, allowing multiple sets of relationships to be viewed simultaneously. Double-clicking a square or clicking its "View" button opens the associated content (page or media file). |
| default view | scalar:defaultView | media |
| was attributed to | prov:wasAttributedTo | https://scalar.usc.edu/works/guide2/users/379 |
| created | dcterms:created | 2014-10-01T16:38:31-07:00 |
| type | rdf:type | http://scalar.usc.edu/2012/01/scalar-ns#Version |