This site requires Javascript to be turned on. Please enable Javascript and reload the page.
Thanks for your patience during our recent outage at scalar.usc.edu. While Scalar content is loading normally now, saving is still slow, and Scalar's 'additional metadata' features have been disabled, which may interfere with features like timelines and maps that depend on metadata. This also means that saving a page or media item will remove its additional metadata. If this occurs, you can use the 'All versions' link at the bottom of the page to restore the earlier version. We are continuing to troubleshoot, and will provide further updates as needed. Note that this only affects Scalar projects at scalar.usc.edu, and not those hosted elsewhere.
Worlding Electronic Waste
Main Menu
Chapter 1 | Introduction
Chapter 1 summary and figures.
Chapter 2 | Waste/Non-Waste
Chapter 2 summary and figures.
Chapter 3 | The Discard Test
Chapter 3 summary and figures.
Chapter 4 | Charting Flows of Electronic Waste
Chapter 4 summary and figures.
Chapter 5 | Looking Again in a Different Way
Chapter 5 summary and figures.
Chapter 6 | Weighty Geographies
Chapter 6 summary and figures.
Josh Lepawsky
31444794f29f45991a28c6c997946216e765688e
Visit MIT Press
Figure 6.12
1
2018-03-16T14:34:21-07:00
Josh Lepawsky
31444794f29f45991a28c6c997946216e765688e
8994
3
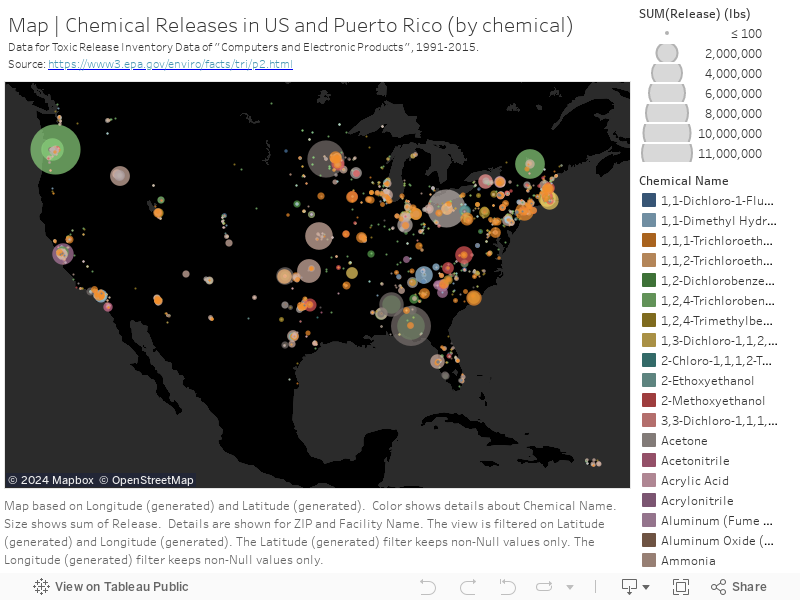
Chemical releases from the US computer and electronics sector by chemical type and by zip code.
blank
2018-03-27T12:46:31-07:00
Josh Lepawsky
31444794f29f45991a28c6c997946216e765688e
Figure 6.12. Chemical releases from the US computer and electronics sector by chemical type and by zip code. Click here to view in a full browser window.
This page has paths:
1
2017-05-15T07:17:46-07:00
Josh Lepawsky
31444794f29f45991a28c6c997946216e765688e
Chapter 6 | Weighty Geographies
Josh Lepawsky
18
Chapter 6 summary and figures.
plain
441860
2018-03-16T14:47:50-07:00
Josh Lepawsky
31444794f29f45991a28c6c997946216e765688e
Contents of this path:
1
2017-05-15T07:14:37-07:00
Figure 6.1
6
Looking into the Lavender Pit which is part of the Copper Queen mine complex near Bisbee, Arizona. Between 1975 and 2003, the US electrical and electronic manufacturing sector annually consumed about the same total amount of copper as was extracted from the Lavender Pit over its entire twenty-four year operational life. Source: author's photograph.
plain
2017-11-08T12:00:44-08:00
1
2017-05-15T08:45:13-07:00
Figure 6.2
2
Visitor's plaque at the roadside lookout over the Lavender Pit. It notes in part that, "...every electronic gizmo from refrigerators to iPods needs copper wiring". Source: author's photograph.
plain
2017-11-08T12:01:15-08:00
1
2017-05-15T08:49:25-07:00
Figure 6.3
5
A close up view of the visitor's plaque at the Lavender Pit. 1975 marks a rise in demand because of the growth in personal computing. The Pit had closed the year before in 1974. Source: author's photograph.
plain
2017-11-08T12:02:18-08:00
1
2017-05-17T05:31:00-07:00
Figure 6.4
2
Minescape story map. Click on "Source" above to view in a full browser window.
plain
2017-05-17T05:31:50-07:00
1
2017-05-15T09:36:47-07:00
Figure 6.5
4
Percent of total greenhouse gas emissions (GHGs) released in production, transport, use, and end-of-life (EOL) of various models of phones. Data sourced from company reports. Calculations by the author.
plain
2017-11-08T12:02:55-08:00
1
2017-05-16T05:07:25-07:00
Figure 6.6
4
CO2e released in production, transport, use, and at end-of-life of laptops. Data sourced from company reports. Calculations by the author.
plain
2017-11-08T12:03:18-08:00
1
2017-05-16T05:23:51-07:00
Figure 6.7
3
CO2e released in production, transport, use, and at end-of-life of desktops. Data sourced from company reports. Calculations by the author.
plain
2017-11-08T12:03:46-08:00
1
2017-05-16T05:34:56-07:00
Figure 6.8
3
CO2e released in production, transport, use, and at end-of-life of tablets. Data sourced from company reports. Calculations by the author.
plain
2017-11-08T12:04:46-08:00
1
2017-05-17T07:13:19-07:00
Figure 6.9
2
Productionscapes story map. Click on "Source" above to view in a full browser window.
plain
2017-05-17T07:14:00-07:00
1
2018-03-16T14:28:39-07:00
Figure 6.10
3
Chemical releases from the US computer and electronics sector.
blank
2018-03-27T12:47:05-07:00
1
2018-03-16T14:31:36-07:00
Figure 6.11
3
Total chemical releases from the US computer and electronics sector by state.
blank
2018-03-27T12:46:50-07:00
1
2018-03-16T14:34:21-07:00
Figure 6.12
3
Chemical releases from the US computer and electronics sector by chemical type and by zip code.
blank
2018-03-27T12:46:31-07:00
1
2018-03-16T14:10:57-07:00
Figure 6.13
8
Total chemical releases from the computers and electronics products sector, 1991-2015
blank
2018-03-27T12:46:14-07:00
1
2018-03-16T14:41:41-07:00
Figure 6.14
3
Total chemical releases by year and by type.
blank
2018-03-27T12:45:51-07:00
1
2017-03-21T05:48:35-07:00
Figure 6.15
5
Map of undersea cables and landing stations. Click on "Source" above to view in a full browser window.
plain
2017-05-16T08:23:50-07:00
1
2018-03-16T14:44:30-07:00
Figure 6.16
2
Map of undersea Internet cable deployment, 1989-2017.
blank
2018-03-27T12:45:28-07:00
1
2017-05-17T04:37:26-07:00
Figure 6.17
4
A small piece of the Cosmos 2251 satellite debris safely passed by the International Space Station at 2:38a.m. EDT, Saturday March 24, 2012 allowing the six Expedition 30 crew members onboard the orbiting complex to exit their Soyuz spacecraft and resume normal activities. The crew sheltered in the two Soyuz spacecraft as a precaution, the third time in station history that a crew has had to shelter in place due to the possibility of a conjunction with orbital debris and the first since June 2011. NASA's Expedition 30 Commander Dan Burbank and Russian cosmonauts Anton Shkaplerov and Anatoly Ivanishin were in their Soyuz TMA-22 spacecraft attached to the Poisk module on the space-facing side of the Zvezda service module, while cosmonaut Oleg Kononenko, NASA's Don Pettit and Andre Kuipers of the European Space Agency were in their Soyuz TMA-03M spacecraft on the Earth-facing side of the Zarya module. The piece of debris was a remnant of a Feb. 10, 2009 collision between the dormant Cosmos 2251 satellite and an operational Iridium 33 communications satellite. The collision added about 2,000 trackable items to the orbital debris catalog. At the time of closest approach, the debris was moving from left to right in front of the station at an estimated overall miss distance of between 11 and 14 kilometers and a radial miss distance of 120 meters.
plain
2017-05-25T06:10:49-07:00