Scalar's 'additional metadata' features have been disabled on this install. Learn more.
The Promise and Practice of Teaching Data Literacy in Social Studies: A Companion SiteMain MenuData Visualizations as Primary SourcesHumans have been creating different types of data visualizations for centuries. Explore this collection of timelines, maps, graphs and charts to see what they reveal about the historical time and place in which they were produced.How do students learn with data visualizations?Reading data visualizations in print and online social studies texts can improve students' overall comprehension and quality of reasoning. And there is evidence to suggest that reading data visualizations helps students better understand historical and geographic context, multiple causation, and change over time — all important concepts for students to grasp in social studies subject areas. However, students may face significant challenges in trying to make sense of different kinds of data visualizations. This section provides insight into both benefits and challenges of reading timelines, maps, and graphs and charts.How should students analyze data visualizations in social studies?The challenges that data visualizations present, coupled with their prevalence in social studies texts, standardized assessments, in online social studies resources, and as sources of information in society, suggest that teaching with and about data visualizations in social studies is essential. This module provides guidance for how teachers can support students' data literacy for social studies.How do I help students create and integrate data visualizations for social studies?This page highlights several tools that are useful for data-based projects in social studies. And accompanying each tool is a "minimal manual" that provides guidance for using the tool in social studies inquiry- and project-based learning.Project-Based Learning Activities for Data Literacy in Social StudiesLorem ipsum dolor sit amet, nec constituto comprehensam te. Sea no affert nemore comprehensam, eum te purto soleat accusata. Ea est magna malis. No atqui iudico est. In vel propriae suavitate. Est homero timeam cu, novum persecuti mea an.Index of Lesson PlansThis page contains a list of the minimal manuals and lessons found on this website. Minimal manuals are designed to be adapted to different grade levels and do not have a grade designation associated with them. Lesson plans are organized according to the school level for which they are designed. However, many of these lessons can be adapted for different grade levels.Tamara Shreiner72eaa2d1ba1352b75b8a8da73e879a4ceb510ae0
A Taxonomy of Data Visualizations
1media/6747000.jpgmedia/6747000.jpg2019-10-09T14:04:37-07:00Tamara Shreiner72eaa2d1ba1352b75b8a8da73e879a4ceb510ae03513334Information can be visualized in multiple ways, from bar graphs to scatterplots, choropleth maps to distribution maps, timelines to time series. Designers can choose from an array of graphical elements such as points, lines, or icons used to represent data, and multiple aesthetic attributes such as color, shape, and size. Furthermore, designers can apply multiple combinations of titles, legends, and explanatory text to provide context for a data visualization. Given the almost dizzying array of data visualizations students may encounter in social studies, it is helpful to place them in categories related to the types of questions they will help us answer.image_header2023-08-23T06:42:24-07:00Tamara Shreiner72eaa2d1ba1352b75b8a8da73e879a4ceb510ae0The following sections provide an overview of four broad categories of data visualizations that are useful in social studies. If you follow the link for each category, it will lead you to a page that provides further information about types and functions of data visualizations included in the category, and shows some examples related to social studies content.
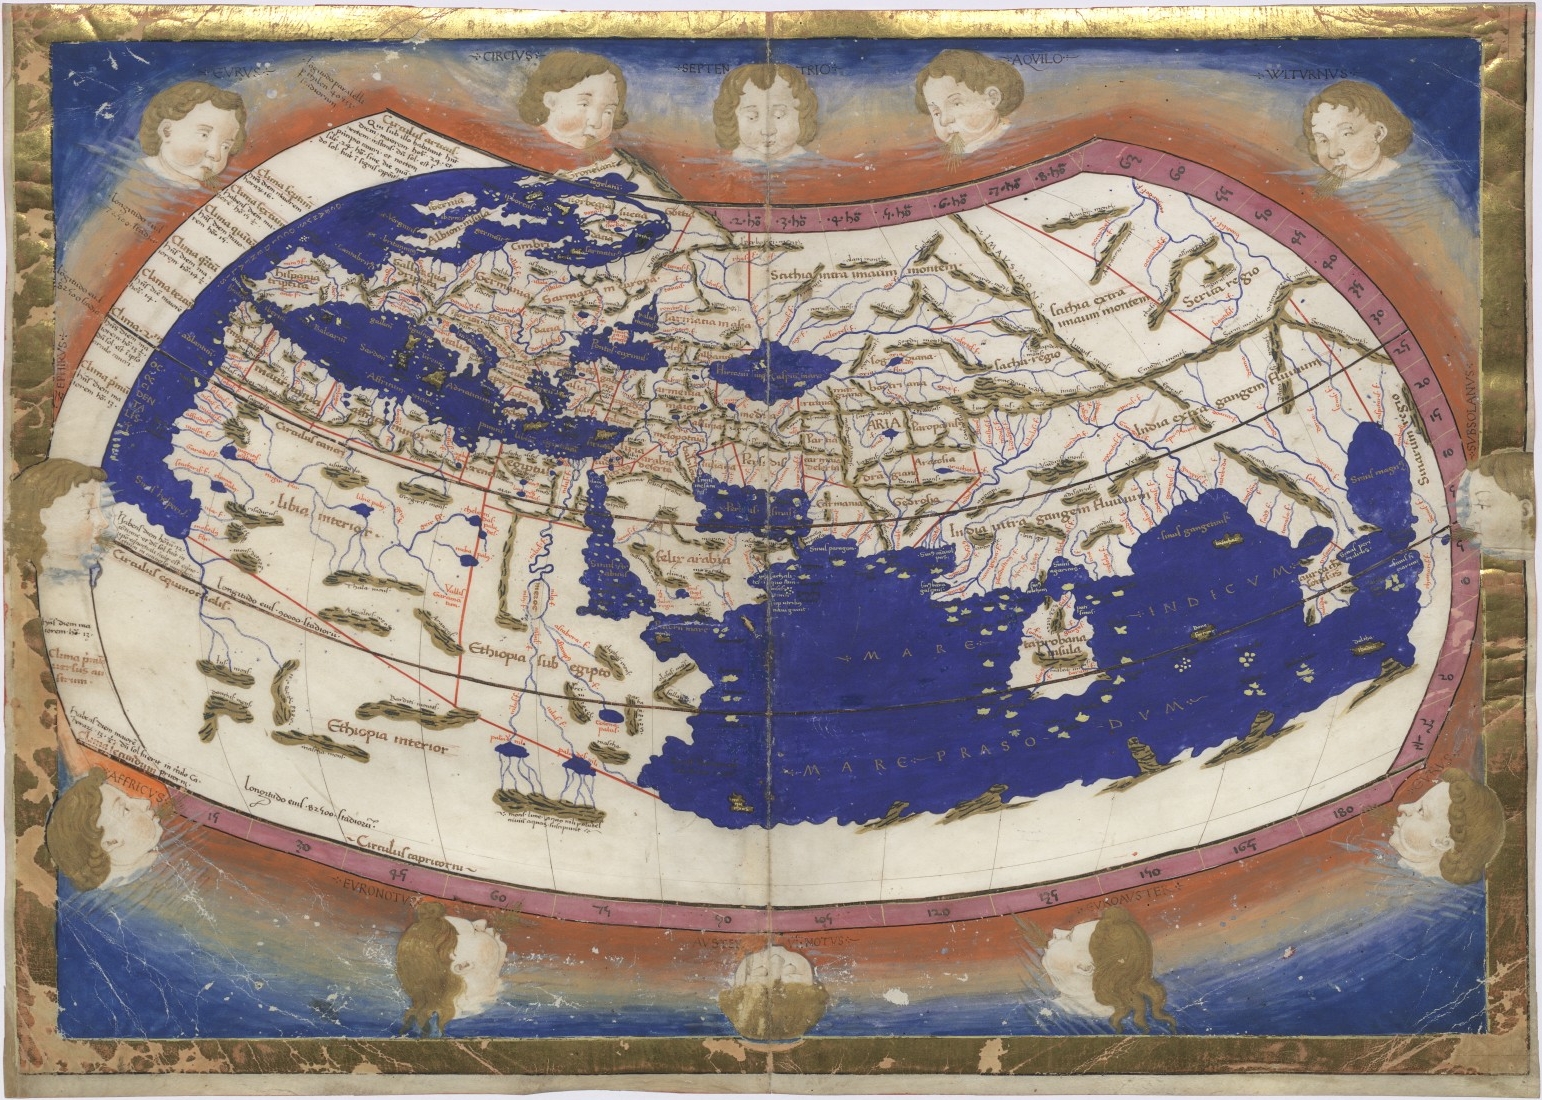
12020-05-05T04:42:58-07:00Tamara Shreiner72eaa2d1ba1352b75b8a8da73e879a4ceb510ae0Spatial Data Visualizations105Spatial data visualizations help us answer "where" questions. They show us locations, allow us to see patterns, distribution, movements, or relationships, or help us make comparisons. Most of the spatial data visualizations students will encounter in social studies are maps, but not all maps are the same, and not every map fulfills the same function. In addition, some of the spatial data visualizations students might encounter represent humans' efforts to map out stars and planets, caverns and tunnels, or parts of the human body.plain2020-10-18T14:23:37-07:00Mark Guzdial12293646cf3f9238a8ffe62e740f7f92aafe60a3
1media/1690049.jpg2020-07-21T13:06:39-07:00Tamara Shreiner72eaa2d1ba1352b75b8a8da73e879a4ceb510ae0Temporal Data Visualizations22Temporal data visualizations help us answer "when" questions. They allow us to visualize when events occurred and how they are temporally related to when other events occurred. They help us understand the sequence and duration of events, how events overlapped or were separated in time, and how things may have changed or remained continuous over time.plain2020-09-08T10:52:46-07:00Tamara Shreiner72eaa2d1ba1352b75b8a8da73e879a4ceb510ae0
12020-07-21T13:08:39-07:00Tamara Shreiner72eaa2d1ba1352b75b8a8da73e879a4ceb510ae0Spatiotemporal Data Visualizations21Spatiotemporal visualizations are complex, multi-layered displays with data indicating growth, movement, or other sorts of changes over time. They help us answer where and when questions simultaneously. They usually come in the form of maps, but there are spatiotemporal data visualizations that do not have a traditional map base.plain2020-10-18T14:28:38-07:00Mark Guzdial12293646cf3f9238a8ffe62e740f7f92aafe60a3
12020-07-21T13:10:16-07:00Tamara Shreiner72eaa2d1ba1352b75b8a8da73e879a4ceb510ae0Categorical or Topical Data Visualizations27Categorical or topical data visualizations help us answer what or how questions. They are useful for comparisons, distributions, patterns, proportions, and relationships.plain2020-09-10T10:58:25-07:00Tamara Shreiner72eaa2d1ba1352b75b8a8da73e879a4ceb510ae0