Book review: Applied cognitive pattern extraction and analysis
By Shalin Hai-Jew, Kansas State University
Nova Science Publishers
2022
159 pp.
Mangesh M. Ghonge, Pradeep Nijalingappa, and Ahmed J. Obaid’s Understanding Pattern Analysis (2022) offers some refreshing cases of data analysis and ways to make meaning of images, structured data, and other data forms.
Data patterns, whether applied to images or datasets or other content, are used in a variety of way across a range of fields. In the present age, data patterns may be extracted by machine, but the meaning still requires human expertise and insight. Often, to even understand the meaning of the data patterns requires some knowledge of machine learning and complex statistical analyses.
To prime the reading, it may help to brainstorm some questions about the space:
Richard A. Armstrong’s “Application of Pattern Analysis to Astrobiology: The Spatial Distribution of Features Revealed by Martian Rovers” (Ch. 1) opens with an interesting challenge of the times. What can analysts do with the images captured by the various Mars rovers beamed from some 78.481 million miles (or thereabouts). Interestingly, Curiosity has beamed back over 500,000 photos so far already, and there are many more from the respective rovers. So far, there have been Sojourner (1997), Spirit (2004 – 2010), Opportunity (2004 – 2018), Curiosity (2012-), and Perseverance (2021- ).
How are various land features to be understood—as biotic or biotic matter, given what is known about the Mars environments? How is scale to be understood when the reference points are the visuals alone? How can spatial patterns be understood? Of particular focus in this chapter are two features from the Martian landscape: the “blueberries” imaged by the rover Opportunity in Eagle crater and the abundant lozenge-shaped ‘rice-grains’ imaged by Curiosity in Gale crater” (p. 1). The blueberries on soil and rocks have been interpreted as “sheroids of the mineral hematite,” and the “rice grains” are thought to be “mineral crystals of gypsum or jarosite.” In contexts where there may be unknowns, it helps to go with elements which are knowns.
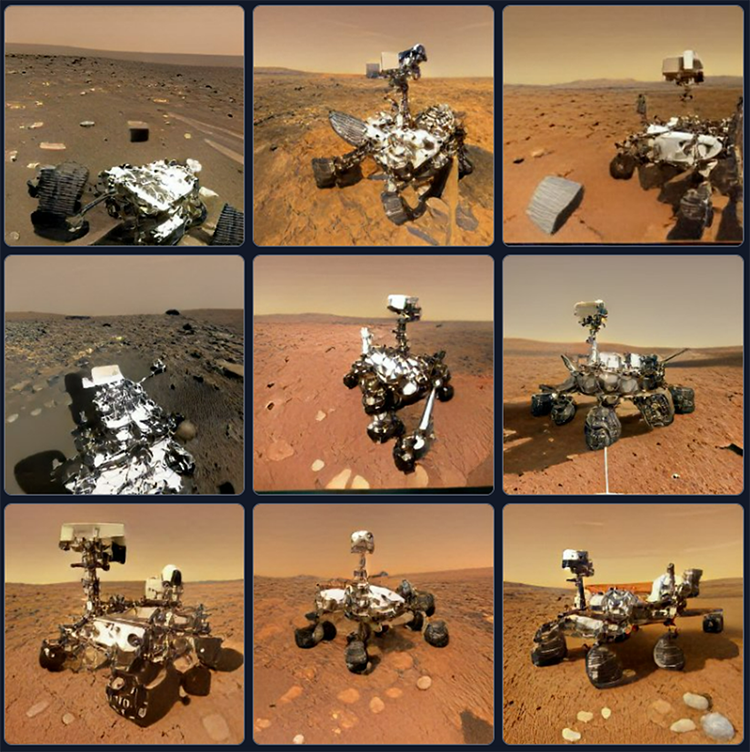
Figure 2. A Mars Rover Imagined 9 Ways by an Art-Making AI
Pattern analysis “can never prove the existence of life on Mars but may enable a more objective assessment of the features visible in images of the surface” (p. 2). Insights may also inform the photography protocols of future missions, and they may also inform particular regions of interest on the “red planet” to photograph and explore otherwise. [The photos currently seem to be from the rovers’ eye views instead of aerial ones. Most shots are either panoramic landscape ones or “detailed images of rock, pebbles, and soil (‘regolith’)” (p. 3). Closeups are easier to understand because there is an understanding of the general spatial relationship between the camera lens and the captured surface. However, it is hard to tell the angle of the surface of the rock to the camera lens, without making assumptions. The angle may affect the sense of the plot size or the shape of the object (p. 3).]
Terrestrial analytics methods are harnessed in part to understand the Martian photos. There is learning from methods used by “terrestrial ecologists to survey and study areas of ecological interest”; there is the use of plots or “quadrats” of particular “size and shape as basic sample units” (Cox, 1990, as cited in Armstrong, 2022, p. 3).
The Mars Science Laboratory (MSL) placed Curiosity on Mars in 2012. Curiosity’s Mars Hand Lens Imager (MAHLI) has sparkling image capture capabilities with super high purpose-built resolution.
Armstrong (2022) writes:
An μm = micron or .001 mm. The researcher elaborates with the deductive logic applied to panoramic images:
In terms of understanding clusters, the machine vision applications strive to define clusters (differentiate them from other matter) and describe them objectively.
Various statistical methods are applied to test for significance. These include
...and other approaches. The role of the human analysts are to know the data, know how to set up the analytics, and properly interpret the outcomes.
The Kolmogorov–Smirnov test (K-S test) showed deviation from a Poisson distribution “but the more sensitive Χ2 test is more revealing suggesting a degree of departure from randomness towards uniformity” (Armstrong, 2022, p. 6). This reasoning allows an empirical focus on the particular region as variant from the scene. He writes: “It would be possible to compare the degree of dispersion of the ‘rice grains’ with those of abiotic rock crystals which resemble them, such as feldspar phenocrysts, gypsum, or jarosite to further investigate whether the ‘rice grains’ could have a non-biological origin” (pp. 6-7).
This work describes Morisita’s Index of Dispersion used as part of the representation because “the index does not change if individual objects have randomly disappeared from the original clusters” given that an object on Mars may be scoured out of existence by the wind-borne dust (Armstrong, 2022, p. 10). For example, the blueberries “often appear denser on soil between boulders than on the exposed surfaces of boulders, which may reflect their more sheltered location” (p. 10). Expertise and open-minded thinking are both so critical in this space. This work describes ways to solve issues in various contexts, such as using “plotless methods” of extrapolating population dispersion.
If there are actual hopes of placing humans to live on Mars one day, it would make sense to learn as much as possible from the available information, even if the photos are blurry, poorly lit, or ill-captured.
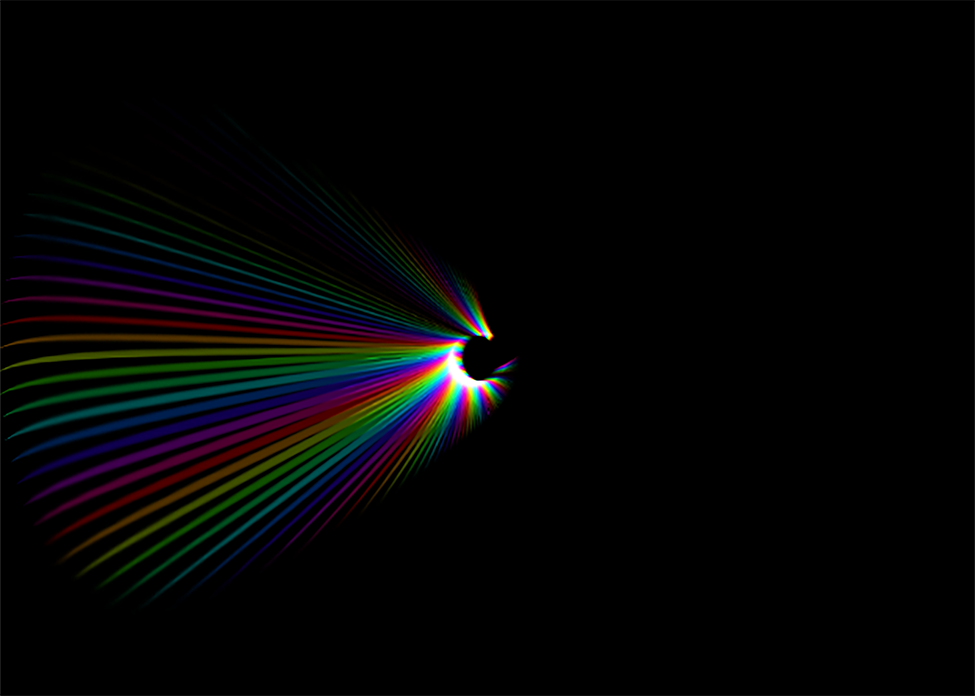
Figure 5. Pinhole
The terminology in the artificial intelligence (AI) space now includes “cognitive computing” (which reads as a more focused sort of “machine learning,” with a focus on pattern identification). Cognitive computing includes natural language processing, deep learning, advanced data visualization, and other approaches. Such analytics may include multimodal datasets, such as those including data tables, text, images, and video (structured and semi-structured data). The researcher writes:
“Cognitive informatics” refers to “the process of matching prior, current, and future data for diagnoses” (p. 44). Genomic researchers using cognitive recognition “to disclose data analytics biomarkers of certain diseases and their supporting environmental factors” (p. 45). As yet, the term “cognitive computing” could benefit from clearer definitions even as the term itself may be friendlier than “machine learning” and more aligned perhaps to human thinking. The field draws on various theories and models, foremost apparently from psychology including “the theory of template making, the theory of prototype matching, and the mode of feature analysis to recognize objects” (p. 48). In human sensemaking, data may inform medical prognoses (pp. 50 – 51), for more timely awareness and proper interventions. The computational role then is in generating relevant patterns, classifying them, organizing the features of that pattern, applying learning approaches (supervised and unsupervised), and understanding the limitations in the analysis (p. 52) and applying statistical pattern recognition standards for relevance. What follows are some applied healthcare case studies using the cognitive computing approaches.
The researcher summarizes:
Finally: If there are equivalencies for human cognitive patterning, are there machine equivalencies of human cognitive biases? Are these biases controlled by the tests of the findings and the benefits of big data?
Sulakshana B. Mane and Mangesh M. Ghonge’s “Object Detection and Alerting System in Pattern Analysis” (Ch. 4) proposes a trained model for applying computer vision and machine learning to enhance surveillance and security in public places. The system may be used to validate identity, with “verification in textual form as contact details, ID numbers, and in visual form as image and video feed” (p. 83). Their system, TIAS, is conceptualized as one that may be deployed at “ticket booths/stations/malls” and other public spaces (p. 83). Their system uses OpenCV and a KNN classifier and the Flask framework. This predictive classifier system is described via text and diagrams and screenshots of the system interface. Their test of the system showed a 75% success rate.
M. Revathi and D. Ramyachitra’s “Time Series with Multiclass SVM-Based Machine Learning Classification for Imbalanced Datasets in Health Care Predictive Models” (Ch. 5) introduces their TSMSVM model for finding “hidden predictive information” (p. 107) in healthcare datasets. They emphasize the fact that real-world databases miss data values and include a wide variety of attributes, and so benefit from computational methods of attribute reduction to identify relevant information. Their time series based multiclass support vector machine (TSMSVM) is introduced and pitted against three other machine learning methods for “efficiency, recall, precision, and time responsibility.” Their approach involves training and test data, and ultimately, competitive and high performance.
Devasis Pradhan, Mangesh M. Ghonge, Hla Myo Tun, Naw Khu Say Wah and Thandar Oo’s “Cognition of 5G Network toward Digital Healthcare for Smart Cities: Issues, Challenges, and Future Directions (Ch. 6) begins with the requirements of network connectivity for modern healthcare, to include “Ultra Low Latency, high information transmission, very high security, exceptionally dense, and high energy capability” (pp. 125 – 126). Smart Digital Healthcare involves the uses of various gadgets including “cells, smartwatch, remote canny glucometer, remote heartbeat screen” and other tools, with necessary connectivity and real-time reporting (p. 129), requiring flexible and high-powered networking. This work highlights the importance of various technology understructure needs for healthcare in a “smart city,” with well designed technologies that offer sufficient privacy protections and awareness.
Smart cars are common in a number of larger cities even as there are various plans for building out the charging infrastructure to enable green and intelligent travel. Mangesh M. Ghonge and Pradeep Nijalingappa’s “Object Detection in an Autonomous Vehicle” (Ch. 7) describes a core function for autonomous driving vehicles, the ability to identify and track objects in its vicinity” and to interact with them in real time and often at high speeds (p. 143). Specifically, they describe the Advanced Driving Assistance System (ADAS) system, designed to “avoid collisions, save fuel, and save travel time” (p. 143). They describe the various sensors used: “LIDAR, RADAR, CAMERA, GPS, and ULTRASONIC SENSOR” (p. 143). Within the system are various technologies used for object identification, in a dynamic world with human well-being on the line.
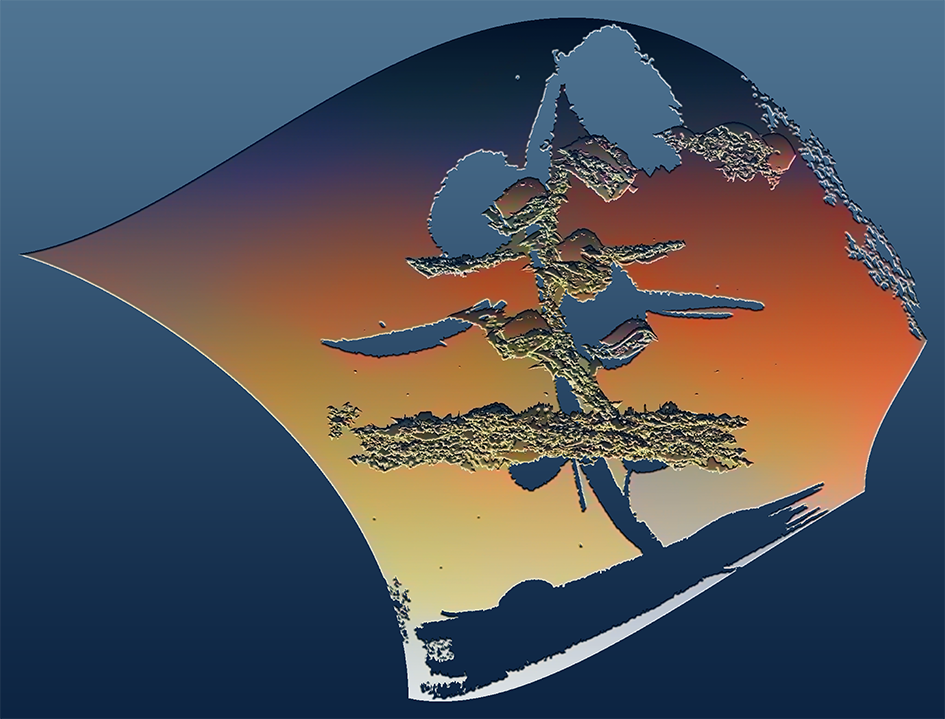
Figure 8. Data Pattern (in 3d)
Mangesh M. Ghonge, Pradeep Nijalingappa, and Ahmed J. Obaid’s Understanding Pattern Analysis (2022) enriches traditional ideas of data patterns by including machine vision, machine learning algorithms, fresh engineering approaches to solving modern challenges, and richer data dimensionality through multimodal data.
Shalin Hai-Jew works as an instructional designer / researcher at Kansas State University. Her email is shalin@ksu.edu.
Understanding Pattern Analysis
Mangesh M. Ghonge, Pradeep Nijalingappa, and Ahmed J. Obaid Nova Science Publishers
2022
159 pp.
Introduction
Data patterns, whether applied to images or datasets or other content, are used in a variety of way across a range of fields. In the present age, data patterns may be extracted by machine, but the meaning still requires human expertise and insight. Often, to even understand the meaning of the data patterns requires some knowledge of machine learning and complex statistical analyses.
To prime the reading, it may help to brainstorm some questions about the space:
- What sorts of data patterns (regularizations) are identifiable with present computational capabilities? What are the methods used to identify the data patterns? How are these data patterns used for analysis? For meaning making?
- What statistical methods have been used for decades to assess data patterns? How have various regression patterns been set up, with independent and dependent variables?
- What are some ways to identify data clusters? How are variables in a context assessed?
- How have people assessed semi-structured data like images, videos, text documents, and other types of contents?
- What sorts of coding methods have researchers applied to extract meaning from data?
- How is data used to create data-informed models? Predictions? Classifications?
- How much confidence is invested in each data pattern? Why?
- Which data patterns are of particular interest, and why?
- How transferable are these data pattern analyses approaches across various fields, and why?
After a headache-inducing review of the complexities of the space, the next step is to read the various cases to glean what may be learned. Suffice it to say that each of the cases does shed light on data patterns with new angles. This work offers a sense of engineering prowess in the various applied cases.
Figure 1. Stylized Ring Lattice Graph
Pattern Analysis from Martian Rovers (in Astrobiology)
Richard A. Armstrong’s “Application of Pattern Analysis to Astrobiology: The Spatial Distribution of Features Revealed by Martian Rovers” (Ch. 1) opens with an interesting challenge of the times. What can analysts do with the images captured by the various Mars rovers beamed from some 78.481 million miles (or thereabouts). Interestingly, Curiosity has beamed back over 500,000 photos so far already, and there are many more from the respective rovers. So far, there have been Sojourner (1997), Spirit (2004 – 2010), Opportunity (2004 – 2018), Curiosity (2012-), and Perseverance (2021- ).
How are various land features to be understood—as biotic or biotic matter, given what is known about the Mars environments? How is scale to be understood when the reference points are the visuals alone? How can spatial patterns be understood? Of particular focus in this chapter are two features from the Martian landscape: the “blueberries” imaged by the rover Opportunity in Eagle crater and the abundant lozenge-shaped ‘rice-grains’ imaged by Curiosity in Gale crater” (p. 1). The blueberries on soil and rocks have been interpreted as “sheroids of the mineral hematite,” and the “rice grains” are thought to be “mineral crystals of gypsum or jarosite.” In contexts where there may be unknowns, it helps to go with elements which are knowns.
The researcher describes the thought processes, the various technologies used, the statistical analyses, and the limits of the assertions—including projections into the future (including advances in image capture on ever-more advanced rovers.
Figure 2. A Mars Rover Imagined 9 Ways by an Art-Making AI
The speculation about the contents of the photos is contested:
Some of these photographs have been reported to reveal signs of either early fossil life or even of living organisms on the surface including algae, fungi, and lichens. The information which can be obtained from such photographs is often limited, difficult to interpret, and highly controversial. (Armstrong, 2022, p. 1)
Pattern analysis “can never prove the existence of life on Mars but may enable a more objective assessment of the features visible in images of the surface” (p. 2). Insights may also inform the photography protocols of future missions, and they may also inform particular regions of interest on the “red planet” to photograph and explore otherwise. [The photos currently seem to be from the rovers’ eye views instead of aerial ones. Most shots are either panoramic landscape ones or “detailed images of rock, pebbles, and soil (‘regolith’)” (p. 3). Closeups are easier to understand because there is an understanding of the general spatial relationship between the camera lens and the captured surface. However, it is hard to tell the angle of the surface of the rock to the camera lens, without making assumptions. The angle may affect the sense of the plot size or the shape of the object (p. 3).]
Terrestrial analytics methods are harnessed in part to understand the Martian photos. There is learning from methods used by “terrestrial ecologists to survey and study areas of ecological interest”; there is the use of plots or “quadrats” of particular “size and shape as basic sample units” (Cox, 1990, as cited in Armstrong, 2022, p. 3).
The Mars Science Laboratory (MSL) placed Curiosity on Mars in 2012. Curiosity’s Mars Hand Lens Imager (MAHLI) has sparkling image capture capabilities with super high purpose-built resolution.
Armstrong (2022) writes:
An approximate scale can be fitted to some Curiosity images as follows: (1) using the ‘motor count’ associated with the photograph, a pixel can be converted to microns using a calibration graph, (2) the photograph can be opened using an image analysis program or ‘paint’ and expanded to reveal the pixels, and (3) using the calibration from pixels to μm, an appropriate scale bar can be added to the photograph. (p. 3)
An μm = micron or .001 mm. The researcher elaborates with the deductive logic applied to panoramic images:
The problem of scale is significantly greater in panoramic views of the landscape as the camera distorts size and shape with distance from the lens. Either features equidistant from the camera, e.g., across the foreground, could be analyzed or plot size could be adjusted for distance from the camera. It can be shown empirically that the measured length of successive meters on a photograph along the line of sight diminish as a power-law function of distance from the camera. Hence, it may be possible in future to use data of estimated distance in a panoramic image from the camera to a prominent feature together with focal length, angle of transect, and height of camera from the ground, to determine the degree to which plot size would need to be adjusted. (Armstrong, 2022, p. 4)
In terms of understanding clusters, the machine vision applications strive to define clusters (differentiate them from other matter) and describe them objectively.
Clustering or aggregation is the most frequent deviation from a random distribution shown by living organisms and results from growth and reproductive processes and competition among organisms…Clusters of an object can also be regularly or randomly distributed and can occur at different scales and hence, small clusters can themselves aggregate to form larger clusters. Two further properties within a cluster are their ‘intensity’ and ‘grain’…The ratio of the density within a cluster to that between clusters is defined as the intensity of the pattern. In addition, an object may be distributed in high density clusters and which are separated by distinct gaps (high intensity) or a gradual transition from high to low density may occur (lower intensity pattern). Hence, a coarse-grained pattern comprises large widely-spaced clusters while a fine-grained pattern consists of small, dense, closely-spaced clusters. Some or all of these features may be used in a pattern analysis. Nevertheless, each statistical method provides data on specific aspects of pattern, a clear hypothesis is needed, and consideration of their advantages and disadvantages. (Armstrong, 2022, p. 4j; cited sources were removed and replaced with ellipses for smoother reading)
Various statistical methods are applied to test for significance. These include
- Fourier transforms
- Kolmogorov–Smirnov tests (used for goodness-of-fit analysis for non-parametric data)
- Poisson distributions (to understand “the degree of departure of a spatial distribution from random” (p.6)
The Kolmogorov–Smirnov test (K-S test) showed deviation from a Poisson distribution “but the more sensitive Χ2 test is more revealing suggesting a degree of departure from randomness towards uniformity” (Armstrong, 2022, p. 6). This reasoning allows an empirical focus on the particular region as variant from the scene. He writes: “It would be possible to compare the degree of dispersion of the ‘rice grains’ with those of abiotic rock crystals which resemble them, such as feldspar phenocrysts, gypsum, or jarosite to further investigate whether the ‘rice grains’ could have a non-biological origin” (pp. 6-7).
This work describes Morisita’s Index of Dispersion used as part of the representation because “the index does not change if individual objects have randomly disappeared from the original clusters” given that an object on Mars may be scoured out of existence by the wind-borne dust (Armstrong, 2022, p. 10). For example, the blueberries “often appear denser on soil between boulders than on the exposed surfaces of boulders, which may reflect their more sheltered location” (p. 10). Expertise and open-minded thinking are both so critical in this space. This work describes ways to solve issues in various contexts, such as using “plotless methods” of extrapolating population dispersion.
If there are actual hopes of placing humans to live on Mars one day, it would make sense to learn as much as possible from the available information, even if the photos are blurry, poorly lit, or ill-captured.
Data-Informed Contemporaneous Agriculture
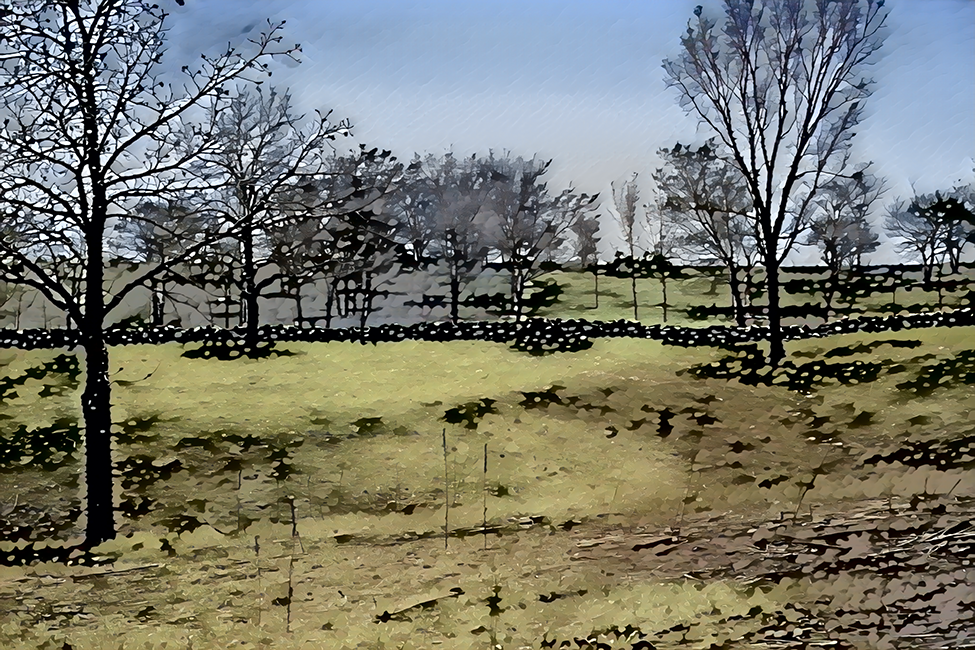
Figure 3. Agriculture
Modern agriculture has to achieve a number of ambitious outcomes. It has to feed the world’s growing population while using less and less water and other natural resources, in the context of a drying and warming world, under major cost pressures, and in eco-friendly ways. Amin Gasmi’s “Pattern Analysis for Predictive Systems of Modern Agriculture Practices” (Ch. 2) highlights the greater availability of big and small data, from sensors, from UAVs, from farm records, from tractors and other smart machinery, from weather and GPS data, and other sources, to strengthen farmer decision-making and knowledge about their crops, water management, local pests, soil health, threats, potential crop yields, and estimated commodities prices. Many of the industrialized farming conglomerates use cutting-edge data analytics to inform their work. They have defined various crop patterns in order to maximize yields.
This work also describes various other applications along the food production chain, such as the use of machine vision and hyperspectral image systems to identify “dangerous crop agents that affect food safety” (Gasmi, “Pattern…,” 2022, pp. 24-25). Other such systems are used to sort fruit by quality.
Figure 4. Orchard
Precision livestock farming involves monitoring of various livestock and their health (p. 27), including those raised using aquaculture. Gasmi notes that big data is used to engage “precision livestock farming; genomic prediction; chest width, thorax, abdomen, and dorsal height; phenotype profiling; animal disease detection; (and) animal microbiome studies” (p. 28). The author notes: “Metagenomics is the process of studying species of livestock to discover feed efficiency, health, and performance” (p. 29). This work lists out many systems listed by name.
Cognitive Pattern Recognition in Healthcare Data
Figure 5. Pinhole
Amin Gasmi’s “Cognitive Pattern Recognition and Analysis for Healthcare Data” (Ch. 3) describes an approach to data analytics that mimics the human brain: “…cognitive recognition matches information patterns for identifying and retrieving data from the stimulus memory of the human brain” (p. 41) and is applied to fields like medical psychology and neuroscience and others.
Cognitive pattern recognition in medicine “helps in the treatment of diseases, improving patients’ outcomes…” (p. 41). Such computationally identified patterns suggest ways to process data, reduce data errors, enable the answering of queries, suggest optimized treatment and clinical care options, may suggest improved ways to “coordinate, manage and improve electronic health data” (p. 41), and improve population health.
Figure 6. Deep Learning
Cognitive computing is a self-learning process of systems used in data mining, pattern analysis, natural language, and human sense processing. Various oncology centers in the USA are known to use cognitive computing to utilize unstructured heavy data and perform clinical trial data examination, diagnostic(s), and treatment. Cognitive pattern algorithms support clinical decision-making while identifying patterns through medical sensing. (Gasmi, “Cognitive Pattern…,” 2022, p. 43)
“Cognitive informatics” refers to “the process of matching prior, current, and future data for diagnoses” (p. 44). Genomic researchers using cognitive recognition “to disclose data analytics biomarkers of certain diseases and their supporting environmental factors” (p. 45). As yet, the term “cognitive computing” could benefit from clearer definitions even as the term itself may be friendlier than “machine learning” and more aligned perhaps to human thinking. The field draws on various theories and models, foremost apparently from psychology including “the theory of template making, the theory of prototype matching, and the mode of feature analysis to recognize objects” (p. 48). In human sensemaking, data may inform medical prognoses (pp. 50 – 51), for more timely awareness and proper interventions. The computational role then is in generating relevant patterns, classifying them, organizing the features of that pattern, applying learning approaches (supervised and unsupervised), and understanding the limitations in the analysis (p. 52) and applying statistical pattern recognition standards for relevance. What follows are some applied healthcare case studies using the cognitive computing approaches.
The researcher summarizes:
The future of cognitive pattern recognition is somewhat tied to precision medicine since personalized care is a person’s genome technology. Health science believes that precision medicine will analyze genomic, metabolic, clinical data with cognitive patterns to identify biomarkers facilitating early diseases over the next decade. (Gasmi, “Cognitive Pattern…,” 2022, p. 75)
Finally: If there are equivalencies for human cognitive patterning, are there machine equivalencies of human cognitive biases? Are these biases controlled by the tests of the findings and the benefits of big data?
Visual Object Detection and Surveillance Alerting
Sulakshana B. Mane and Mangesh M. Ghonge’s “Object Detection and Alerting System in Pattern Analysis” (Ch. 4) proposes a trained model for applying computer vision and machine learning to enhance surveillance and security in public places. The system may be used to validate identity, with “verification in textual form as contact details, ID numbers, and in visual form as image and video feed” (p. 83). Their system, TIAS, is conceptualized as one that may be deployed at “ticket booths/stations/malls” and other public spaces (p. 83). Their system uses OpenCV and a KNN classifier and the Flask framework. This predictive classifier system is described via text and diagrams and screenshots of the system interface. Their test of the system showed a 75% success rate.
SVM Machine Learning Applied to Time Series Healthcare Data
M. Revathi and D. Ramyachitra’s “Time Series with Multiclass SVM-Based Machine Learning Classification for Imbalanced Datasets in Health Care Predictive Models” (Ch. 5) introduces their TSMSVM model for finding “hidden predictive information” (p. 107) in healthcare datasets. They emphasize the fact that real-world databases miss data values and include a wide variety of attributes, and so benefit from computational methods of attribute reduction to identify relevant information. Their time series based multiclass support vector machine (TSMSVM) is introduced and pitted against three other machine learning methods for “efficiency, recall, precision, and time responsibility.” Their approach involves training and test data, and ultimately, competitive and high performance.
Digital Healthcare in Smart Cities
Devasis Pradhan, Mangesh M. Ghonge, Hla Myo Tun, Naw Khu Say Wah and Thandar Oo’s “Cognition of 5G Network toward Digital Healthcare for Smart Cities: Issues, Challenges, and Future Directions (Ch. 6) begins with the requirements of network connectivity for modern healthcare, to include “Ultra Low Latency, high information transmission, very high security, exceptionally dense, and high energy capability” (pp. 125 – 126). Smart Digital Healthcare involves the uses of various gadgets including “cells, smartwatch, remote canny glucometer, remote heartbeat screen” and other tools, with necessary connectivity and real-time reporting (p. 129), requiring flexible and high-powered networking. This work highlights the importance of various technology understructure needs for healthcare in a “smart city,” with well designed technologies that offer sufficient privacy protections and awareness.
Object Detection in Autonomous Driving
Figure 7. Smart Car
Smart cars are common in a number of larger cities even as there are various plans for building out the charging infrastructure to enable green and intelligent travel. Mangesh M. Ghonge and Pradeep Nijalingappa’s “Object Detection in an Autonomous Vehicle” (Ch. 7) describes a core function for autonomous driving vehicles, the ability to identify and track objects in its vicinity” and to interact with them in real time and often at high speeds (p. 143). Specifically, they describe the Advanced Driving Assistance System (ADAS) system, designed to “avoid collisions, save fuel, and save travel time” (p. 143). They describe the various sensors used: “LIDAR, RADAR, CAMERA, GPS, and ULTRASONIC SENSOR” (p. 143). Within the system are various technologies used for object identification, in a dynamic world with human well-being on the line.
They write: “Computer vision object classification and identification methods often include the following steps: 1) Classification of image objects, 2) Localization of image objects, 3) Detection of image objects, and 4) Segmentation of picture” (Ghonge & Nijalingappa, 2022, p. 144). The sensor information is fused computationally and analyzed in ways to effectively drive the car.
Conclusion
Figure 8. Data Pattern (in 3d)
The space is evolving quickly and in real time, and it is hard to consider just where the current state-of-play is. For common readers and students, this work offers some refreshing reads about contemporaneous data patterns achieved computationally.
About the Author
Shalin Hai-Jew works as an instructional designer / researcher at Kansas State University. Her email is shalin@ksu.edu.
| Previous page on path | Cover, page 18 of 22 | Next page on path |
Discussion of "Book review: Applied cognitive pattern extraction and analysis"
Add your voice to this discussion.
Checking your signed in status ...