Listening In on Public Conversations on Microblogging and Social Networking Sites (with NCapture and NVivo 12 Plus)
By Shalin Hai-Jew, Kansas State University
When most of us engage on social media, we engage as individuals. We filter information through our own personality or ego framework. In general, we interact person-to-person as well as in small groups. A few may engage others at mass-scale. A different way to engage on social media is through listening in on social media conversations at a higher scale, for a more zoomed-out view. From this angle, it is possible to see something about the interests of the groups engaging with particular social media accounts, the issues that are discussed, the sentiments being expressed, something of the in-world instantiations of the virtual community members, and other insights.
For this to work, the social media platforms need to enable access to publicly-released data (by the account holders), usually through application programming interfaces (APIs). Those who want access to this public data need to be “whitelisted” into the respective social media platforms to access the APIs. (There does not seem to be any requirement to be active on the platforms though because I am still an “egg” on Twitter, and have never posted anything on my Facebook page—although I do see all sorts of spam there.)
This is in part to enable the system administrators to automatically rate-limit access. There are also top limits for Tweet sets at about 3,000 messages and poststreams with hundreds of thousands of messages or so (using the extraction enabled by NVivo 12 Plus and NCapture). Beyond the responses of the servers by the social media platform providers, the message “take” may be sensitive to the time-of-day and the online connectivity speeds and other factors, too. In this data download, 2,742 messages were extracted from Twitter (with the specification “including retweets”), and 597,379 messages from Facebook.
The data downloads constrained by both Twitter and Facebook, enabling access to some of the most recent posts only (slice-in-time data), so there is not a full N = all in most cases (unless the accounts are very sparse). Usually, those who want the full social datasaets have to go with Gnip, a commercial social data provider.
To see how this might work, two target accounts related to YouTube were identified, one on the Twitter microblogging site and one on the Facebook social networking service/site (SNS): @youtube on the Twitter microblogging site (https://twitter.com/youtube) and the “youtube” account on the Facebook social networking site (https://www.facebook.com/youtube/).
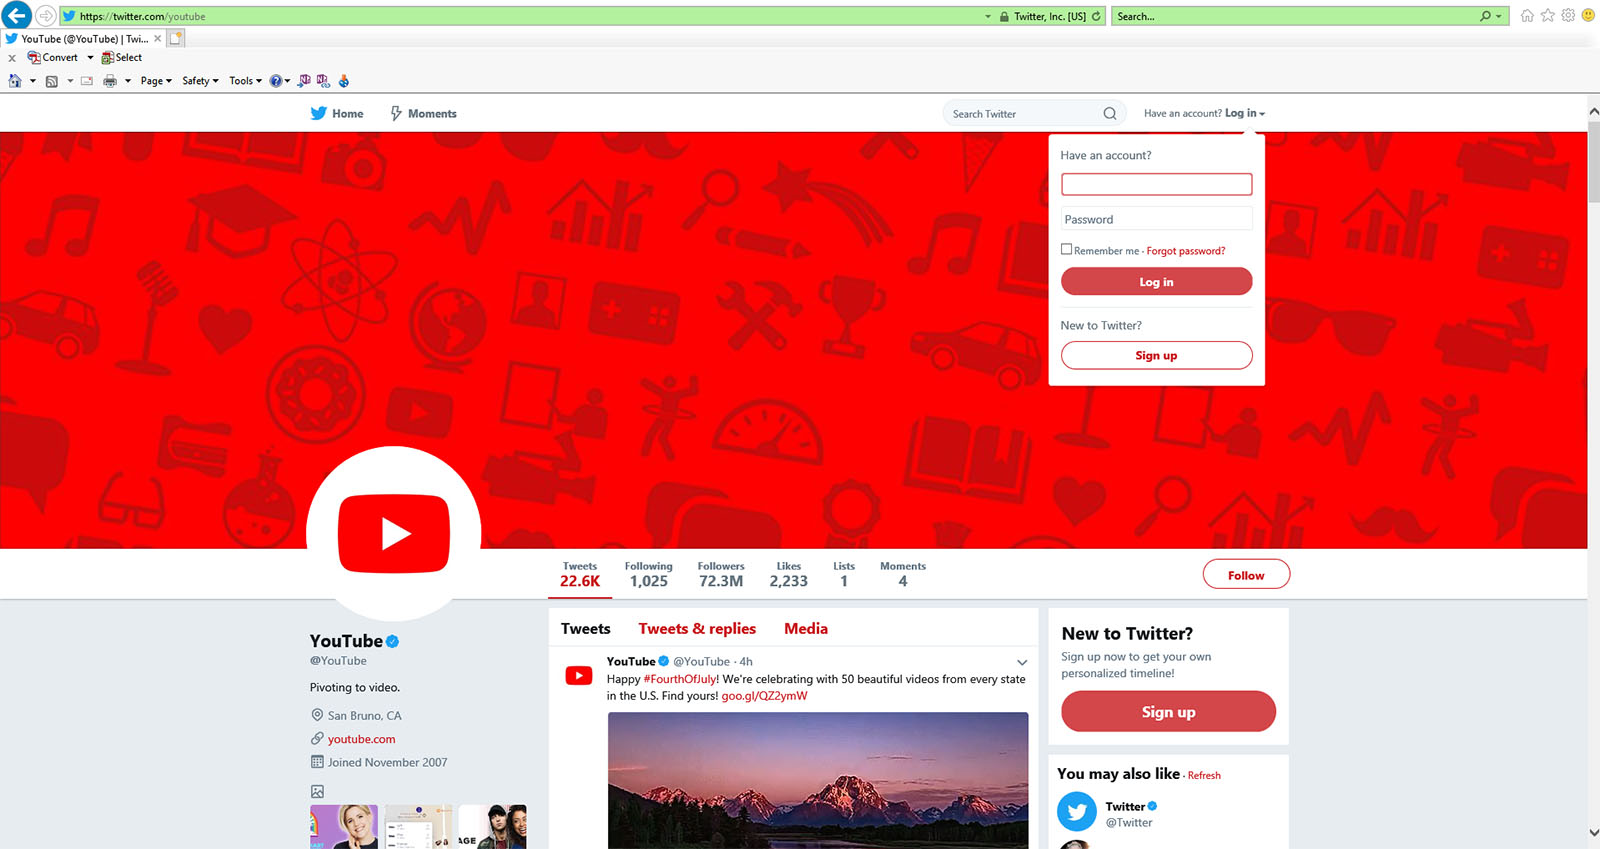
At the time of the data capture, the @YouTube account on Twitter had 22,620 Tweets, 1,025 following, 72,333,937 followers, 2,233 likes, 1 list, and 4 moments. In terms of the profile, the account originates out of San Bruno, California, and it joined in November 2007. (Figure 1)
Figure 1. “YouTube” on Twitter (https://twitter.com/youtube)
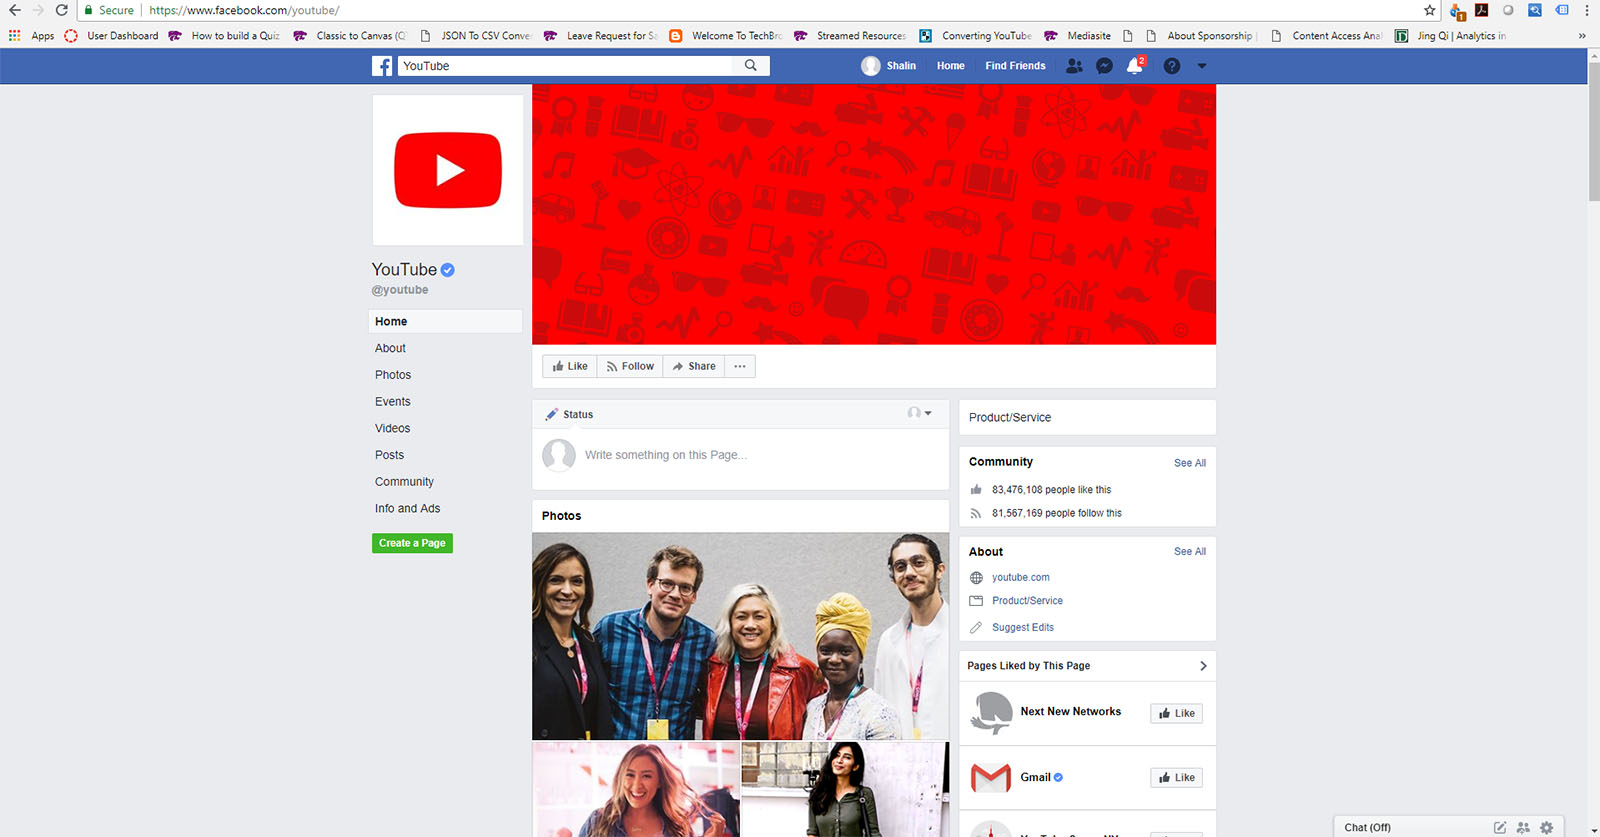
On Facebook, the account has 83,476,069 people who like the account and 81,567,151 people who follow this. The profile description for YouTube reads: “YouTube provides a forum for people to connect, inform, and inspire others across the globe and acts as a distribution platform for original content creators and advertisers large and small.” (Figure 2)
Figure 2. “YouTube” on Facebook (https://www.facebook.com/youtube/)
The Sequence
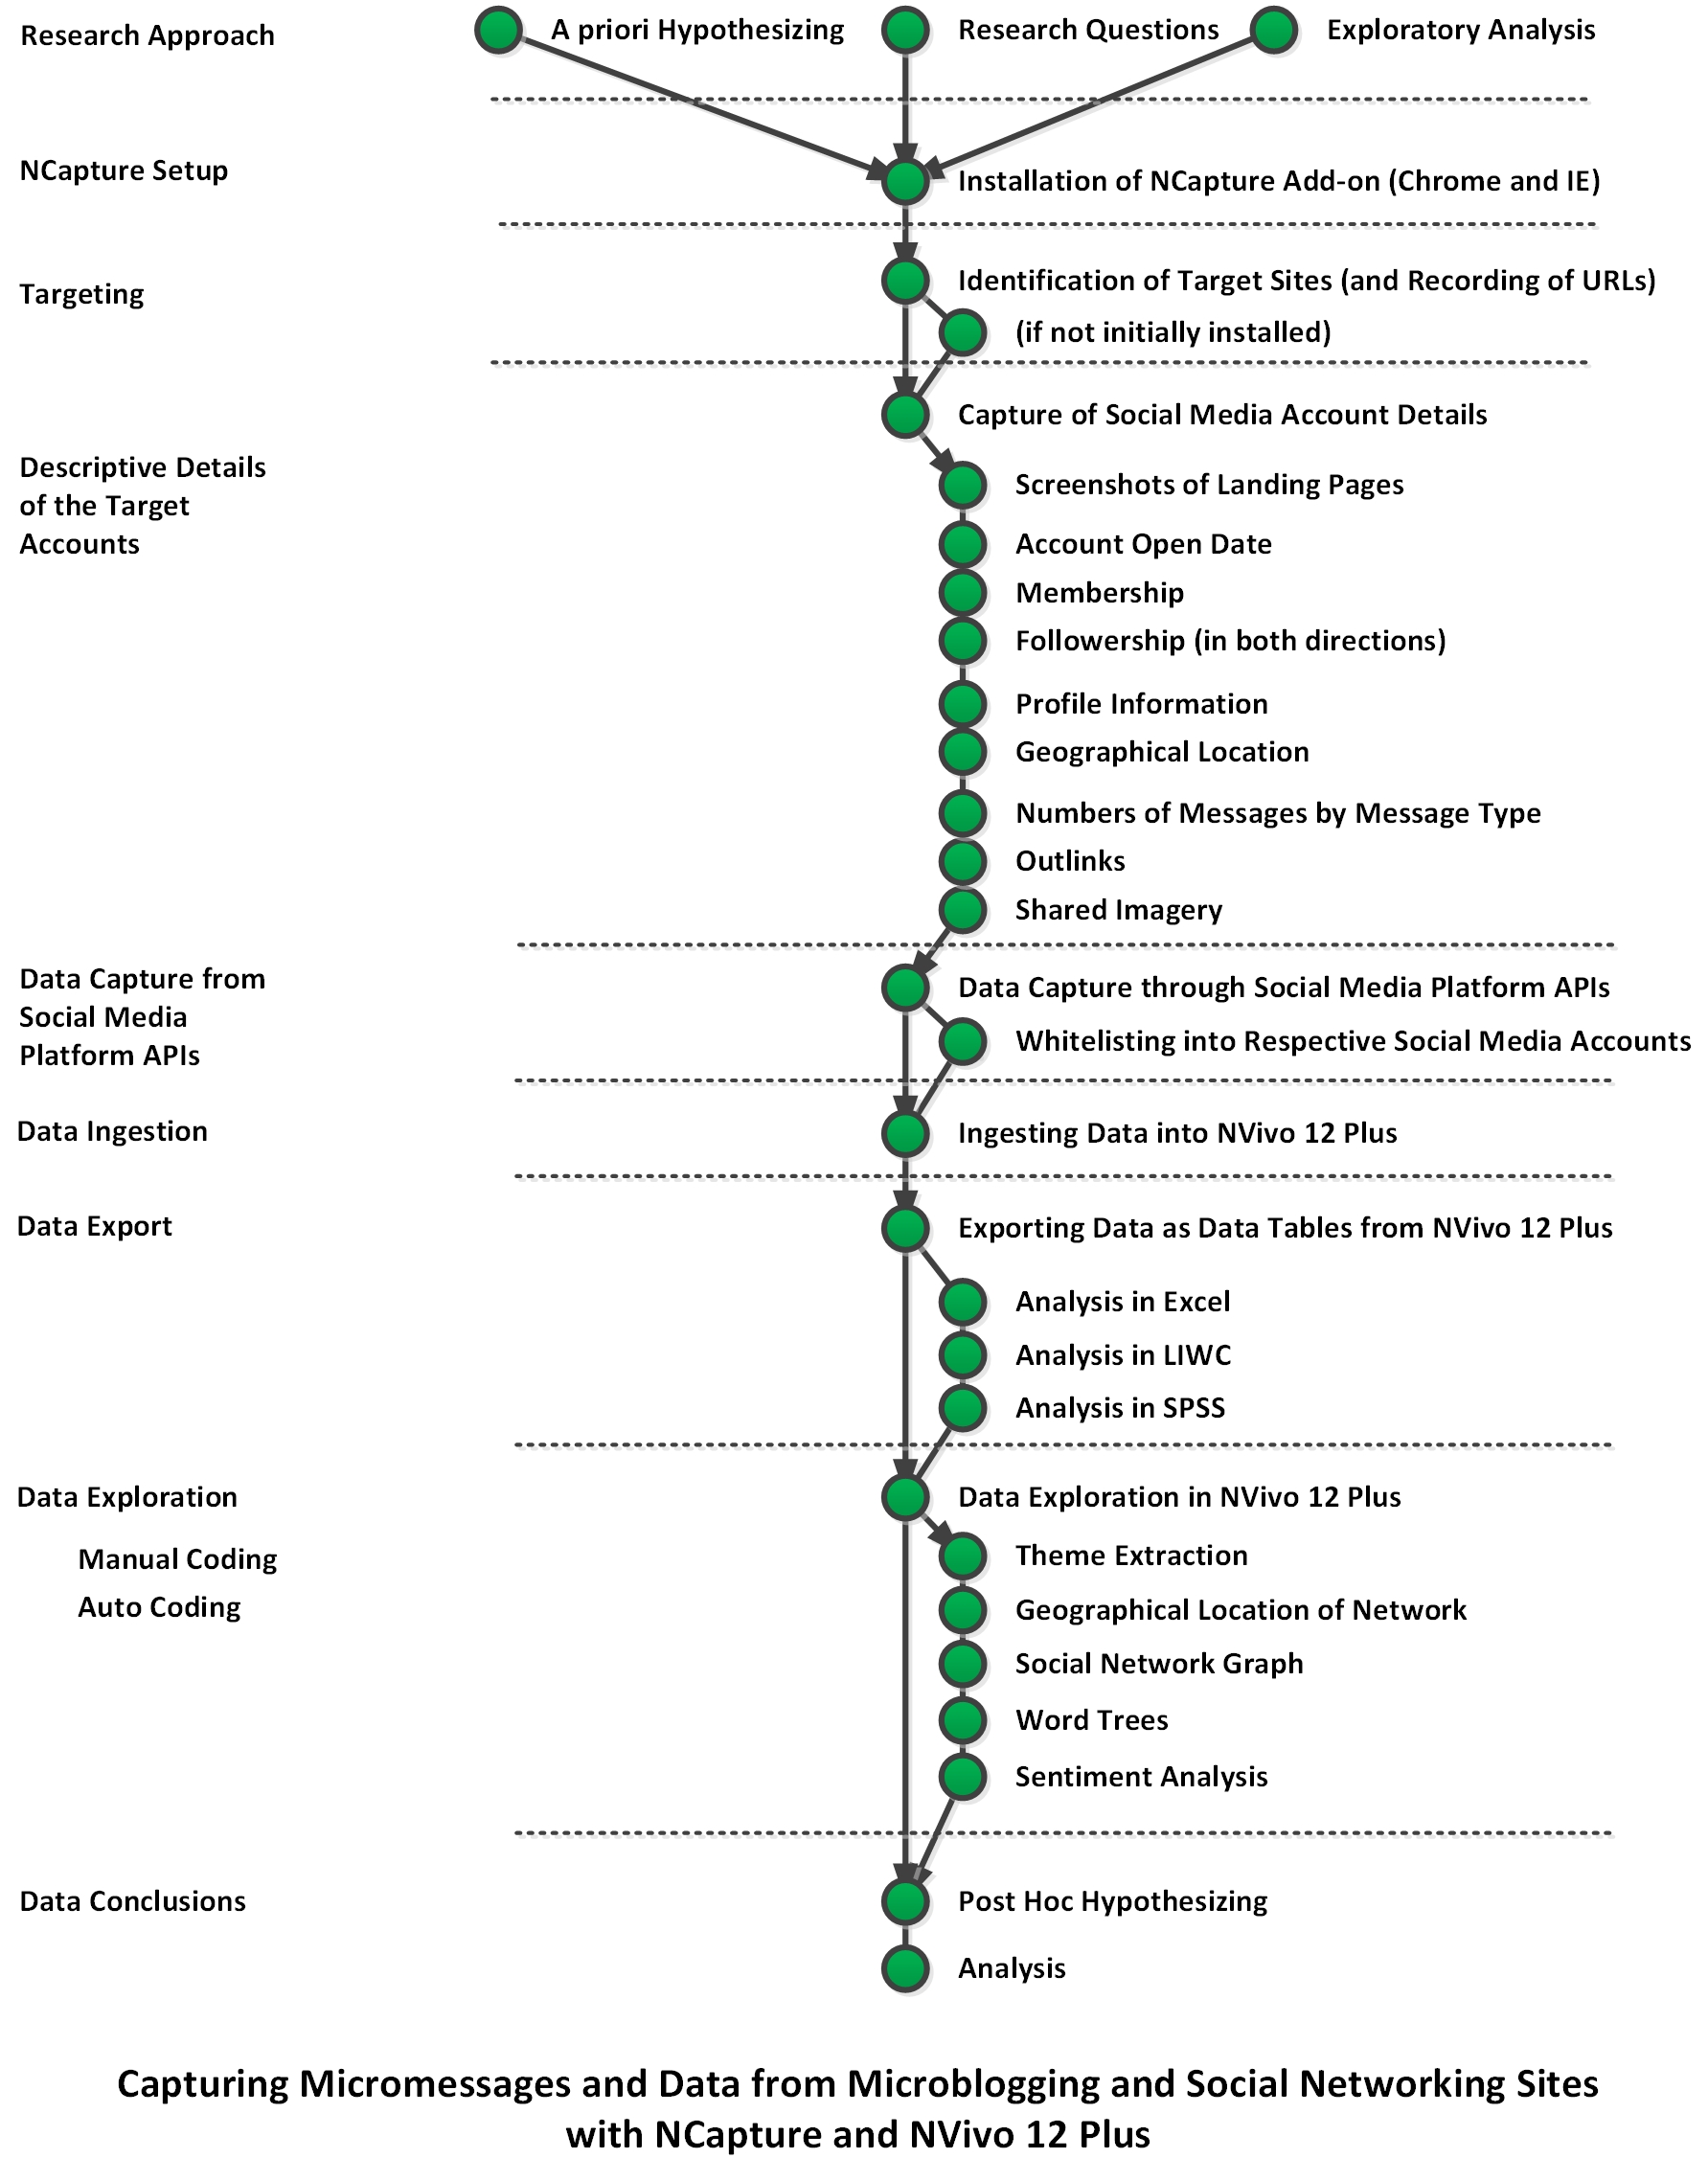
In Figure 3, the sequence begins with different research approaches prior to the data collection and data analyses. A priori hypothesizing captures what the researcher thinks he or she (or they) will find from the respective data sets. These hypotheses are usually formalized in a particular writing format and style, and the idea is to create these in top-down theory- or model- or framework-informed ways. A research question approach begins with pre-defined questions of research interest (that may be partially or wholly answered by the captured data). Both the a priori hypothesizing and the early brainstorms of research questions are creative endeavors that are not necessarily directly linked to the captured data but enable broad thinking.
The “exploratory analysis” does not begin with any initial hypothesizing or pre-defined questions but is open to seeing what is in the data once it has been collected. The data collection is captured, and then analyzed using both manual coding and auto (computerized) coding. This is a bottom-up coding approach, informed usually by grounded theory. Some initial conclusions are drawn, and post hoc hypothesizing may occur based on the identified data patterns.
Figure 3. Capturing Micromessages and Data from Microblogging and Social Network Sites with NCapture and NVivo 12 Plus
Installing NCapture
The software used for this sequence is NVivo 12 Plus, and the free web browser add-on is NCapture.
Those who installed NVivo 12 Plus on a Windows device were likely asked whether they wanted to install NCapture, and if so, on Google Chrome and / or Microsoft’s Internet Explorer. If this was somehow missed, individuals may download the add-on from QSR International’s website. (As a small note, IE is still available on Windows 10. Just search for it in the Search box. There is not currently a version of NCapture for Edge.) Another way to access NCapture—for Google Chrome—is to go to the Google Chrome store.
After the installation, restart the web browser. The presence of the NCapture glyph at the top toolbar of the web browser indicates that the installation was successful. (Figure 4)
Figure 4. NCapture Glyph on Top Toolbar of Web Browser
Identifying a Target Topic
Once this is in order, it helps to identify a target topic and related social media platform. It helps to do a dry run of the technology on the target URL to see if the account enables data scraping. Once that has been verified, record the data from the platform, such as its URL, the profile information, the physical location, the start date, and any other information of interest. To capture the site’s look-and-feel, you may want to take a screenshot of the account’s landing page.
Ingesting the Downloaded Data into NVivo 12 Plus
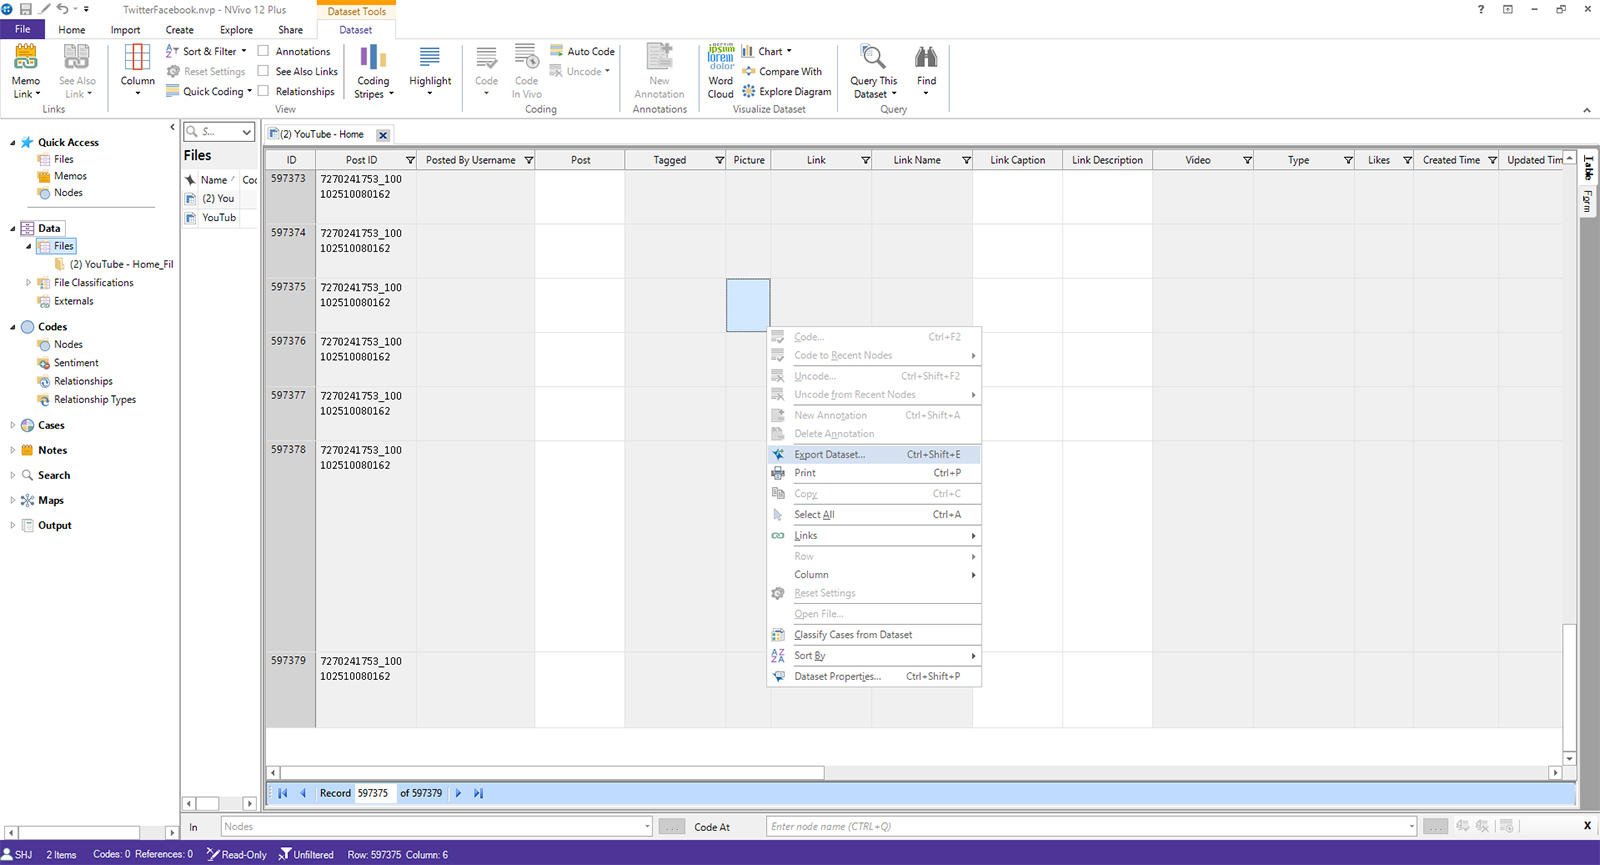
Next, access the .nvcx downloads. (Google Chrome drops the files in the Downloads folder in Windows, and Internet Explorer drops the files in the Documents - > NCapture folder.) Ingest the data into an NVivo 12 Project (.nvp). This collected data may be downloaded for analysis in other tools like Linguistic Inquiry and Word Count (LIWC) (i.e. for linguistic analysis), Excel (i.e. for time patterns), SPSS (i.e. for text analysis, regressions, cross-tabulation analysis, and others). (Figure 5)
Figure 5. Exporting Downloaded Social Media Platform Datasets from NVivo 12 Plus
Both datasets are set up in a pretty basic way, with rows as different messages and interactions (like replies). The column data are variables. In terms of locational data, one captures the static declared location, and other captures dynamic locations of the respective mobile devices and / or smart phones. (Available data depends, in part, on the settings of the social media account holders.)
Analytics
In this example, the same corporation “owns” both accounts, and some of the similarities in contemporaneous branding may be seen. The datasets were captured at the same time frame (within minutes of each other). The assumption, though, is that the messaging from the respective social media platforms will differ because different people are attracted to microblogging and others to social networking sites. The dynamism of topics will likely also be broad given the reach and diversity of YouTube. What follows are some data visualizations of the messaging from both sites, in the following order: theme extractions, geographical locations of the social networks, social network graphs, word trees, and sentiment analyses.
1. Theme Extractions
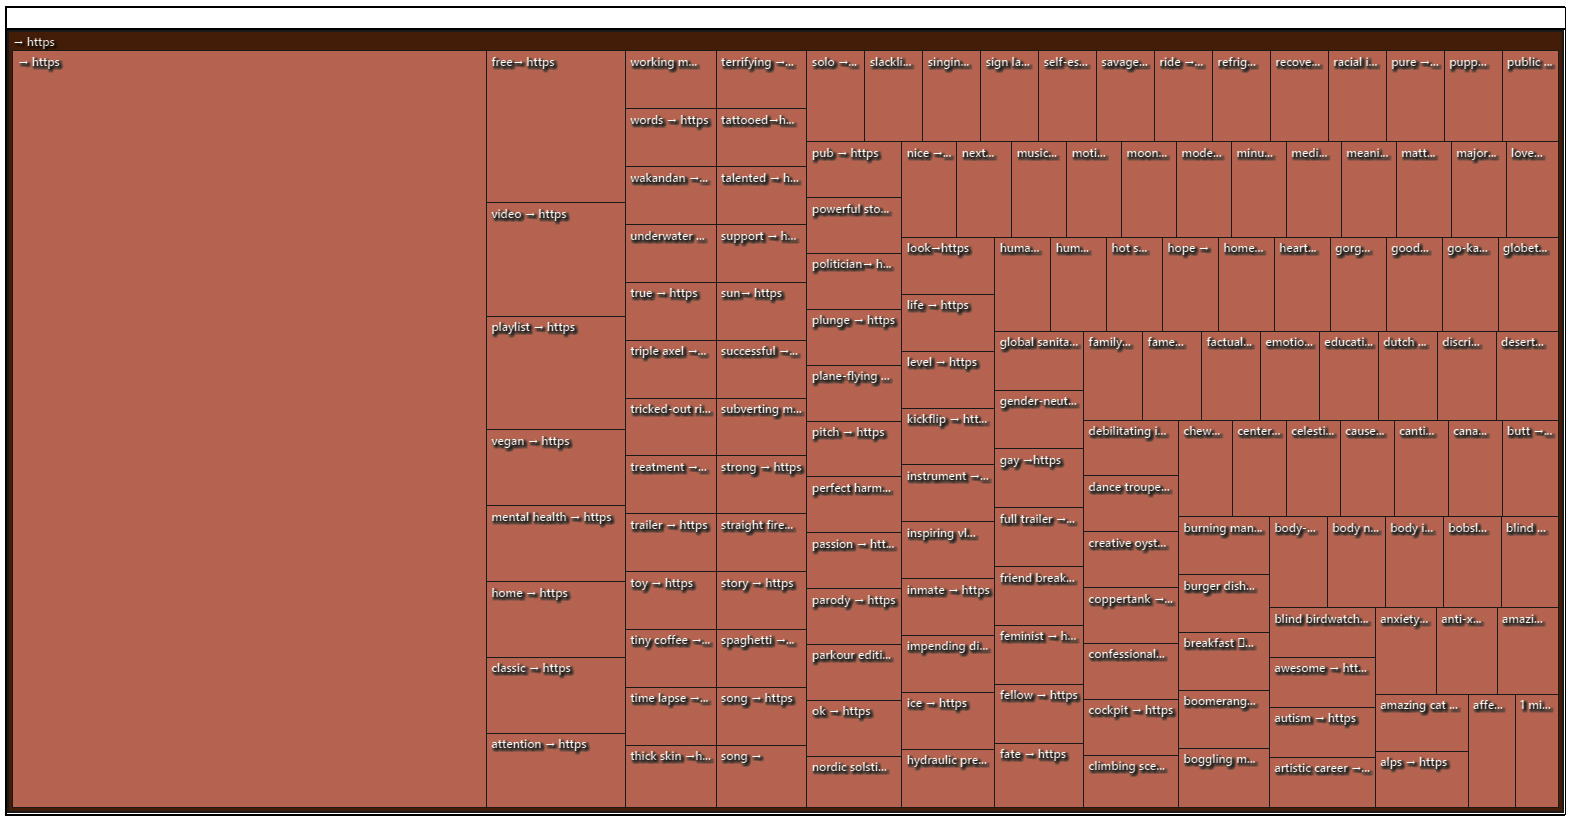
NVivo 12 Plus enables automated “topic modeling” or the automated identification of themes from text sets and text-based datasets. This computational feature enables the pulling of themes from natural language documents more easily than the shortened messaging of Tweestreams and Poststreams. A fast theme extraction was done on the smaller set, and the theme coding was applied to the data cells (not at the sentence level or at the paragraph level, which tend to be coarser in granularity). The main “theme” was “http” and “https,” so the more in-depth potential insights were not captured. (A theme extraction may be done on a word cloud of the text set with the “https” removed, to get closer to the actual topics.)
Figure 6. Autocoded Theme Extraction of “YouTube” Messaging on Twitter (on a treemap diagram)
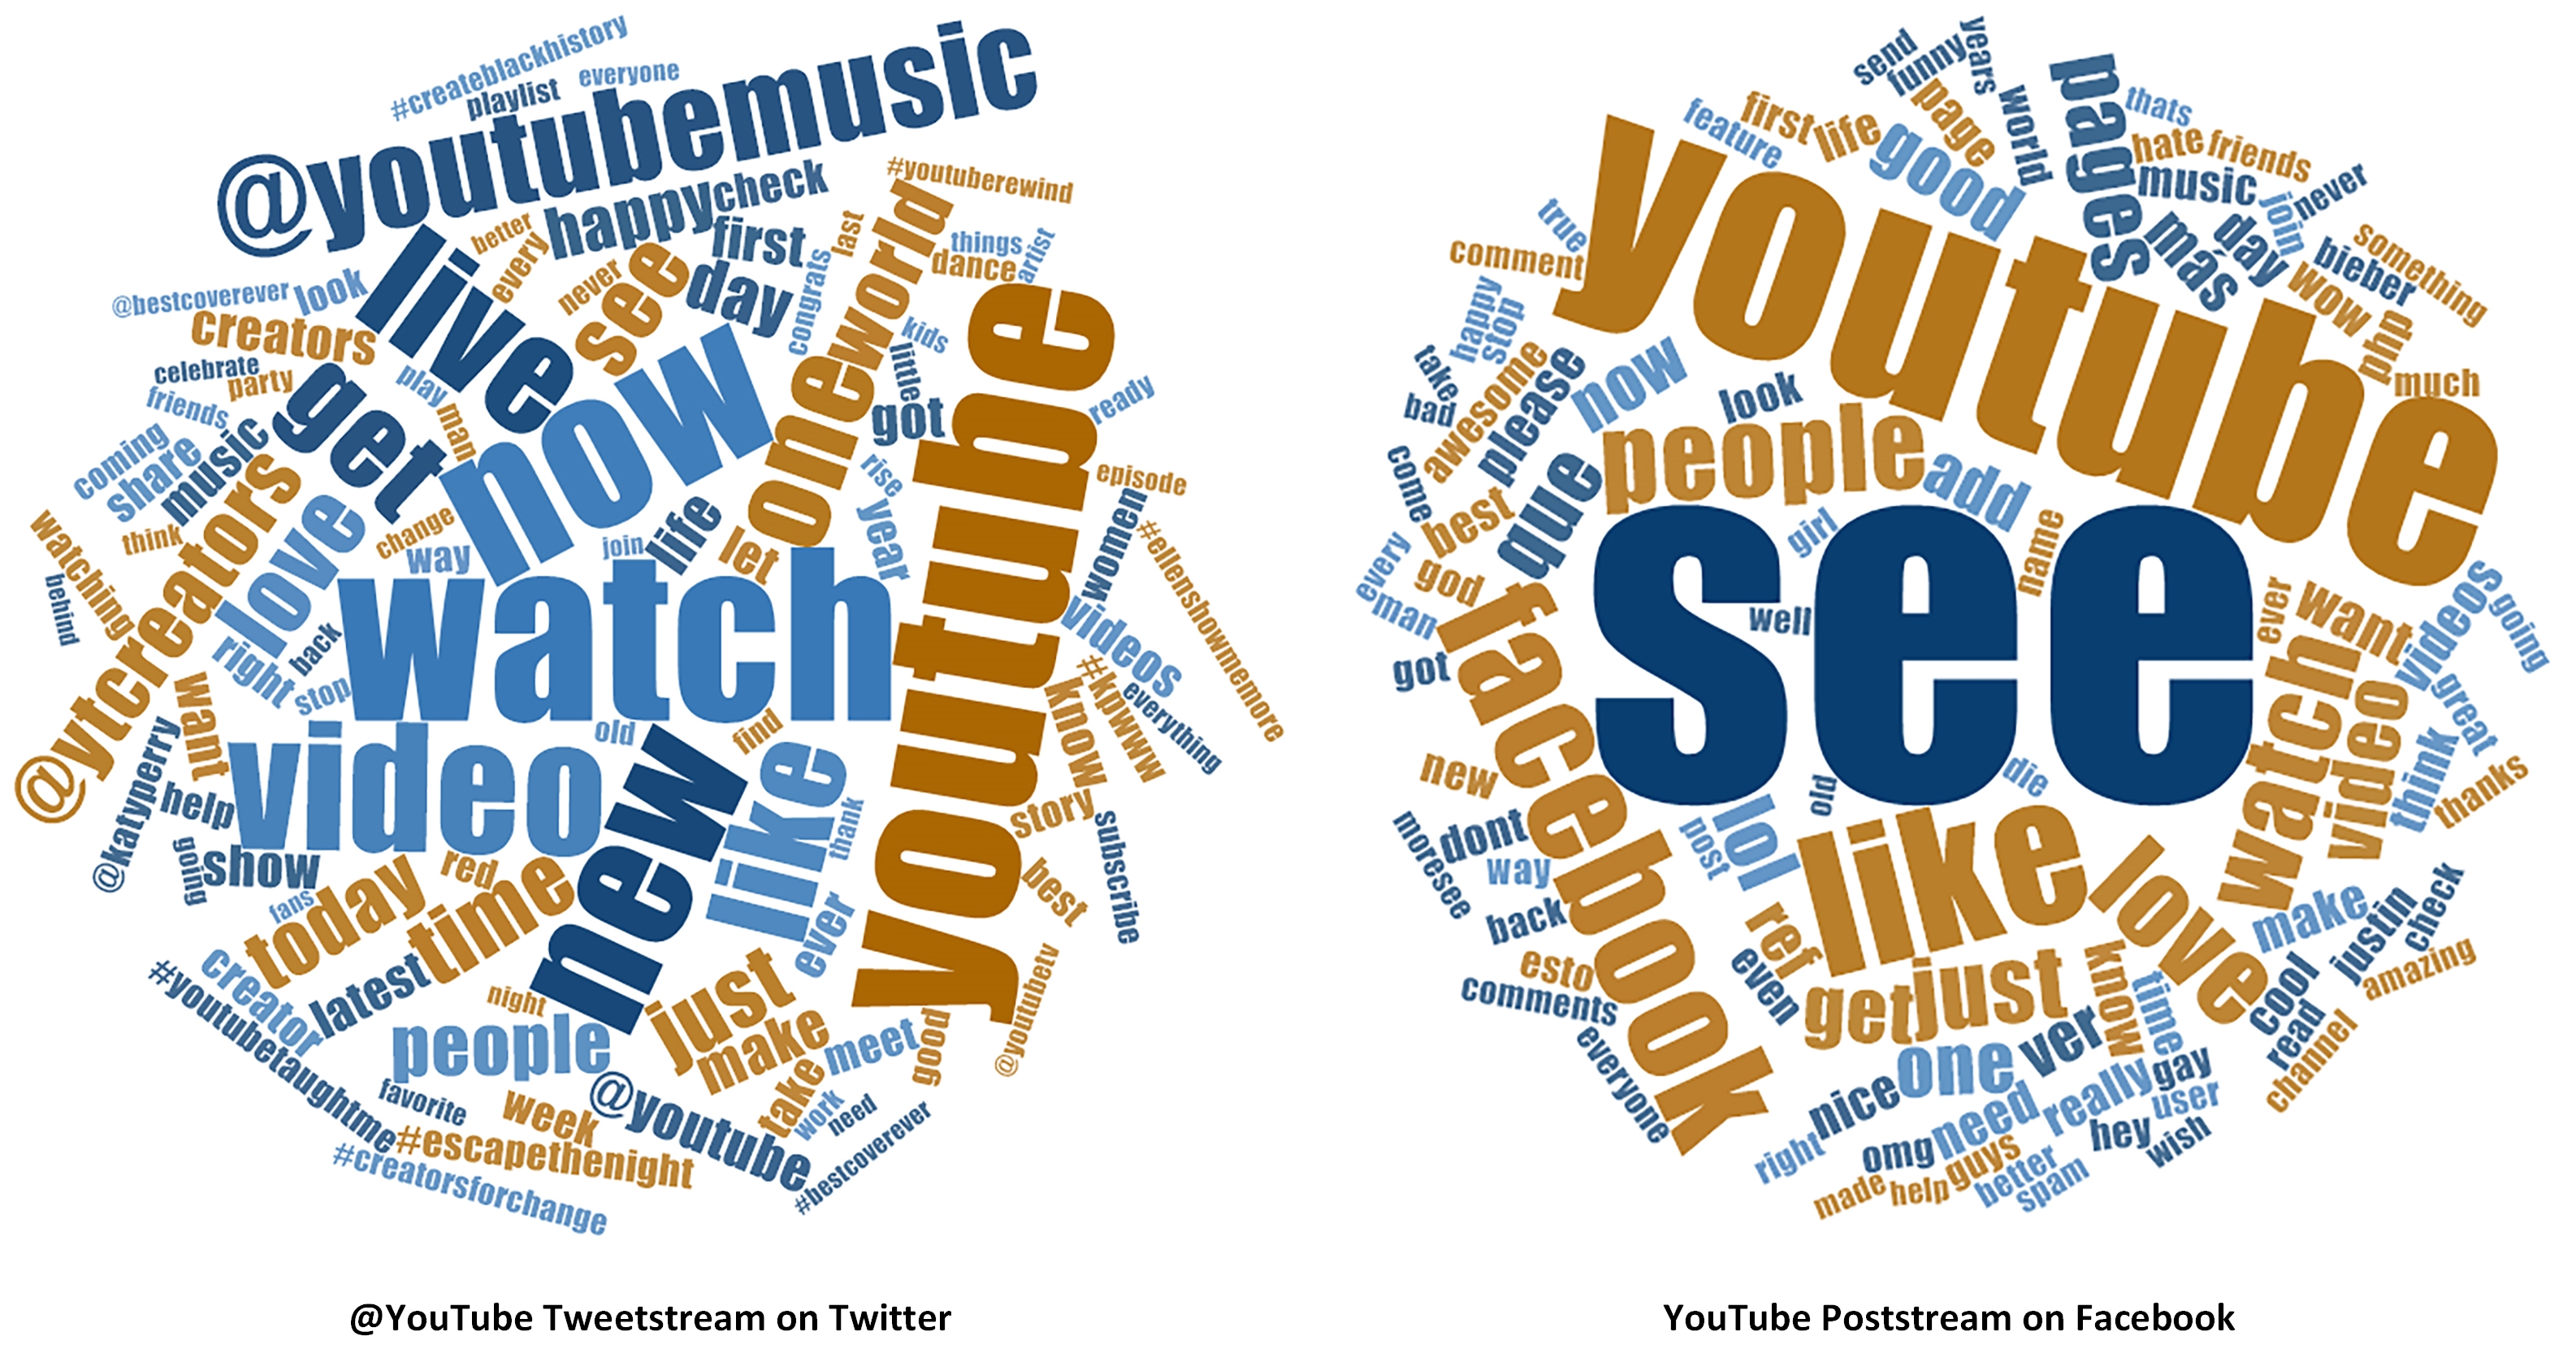
A proxy measure of themes may be the word frequency count, which counts the words in the respective text sets and represents the most common terms in a word cloud visualization. For the Twitter set, the stopwords included “http,” “com,” “www,” and “https.” For the Facebook set, the stopwords included “http,” “com,” and “www.” For the visualization in Figure 7, only the top 1,000 words were used. Note that the words are represented as unigrams or one-grams instead of bigrams, or three-grams, or phrases. In word clouds, the sizes of the respective depicted words indicate their frequency of mentions in the text set.
To best use these visualizations, it may help to take a closer look at the @ accounts to know who is most active in this particular slice-in-time and account. It may help to create unique codes from respective words of interest in order to have the computer code usage of that particular term. (See the Word Trees further below.) Another approach may be to add more to the stopwords lists to see what topics remain…and what insights may be observed from there. Another approach may be to not emplace the 1000 top words parameter in the word frequency count but to count all…and then look at the long tail of the words that are mentioned only once, to better understand the outlier terms.
Figure 7. Word Frequency Count of “YouTube” Messaging on Twitter and Facebook
2. Geographical Locations of the Social Networks
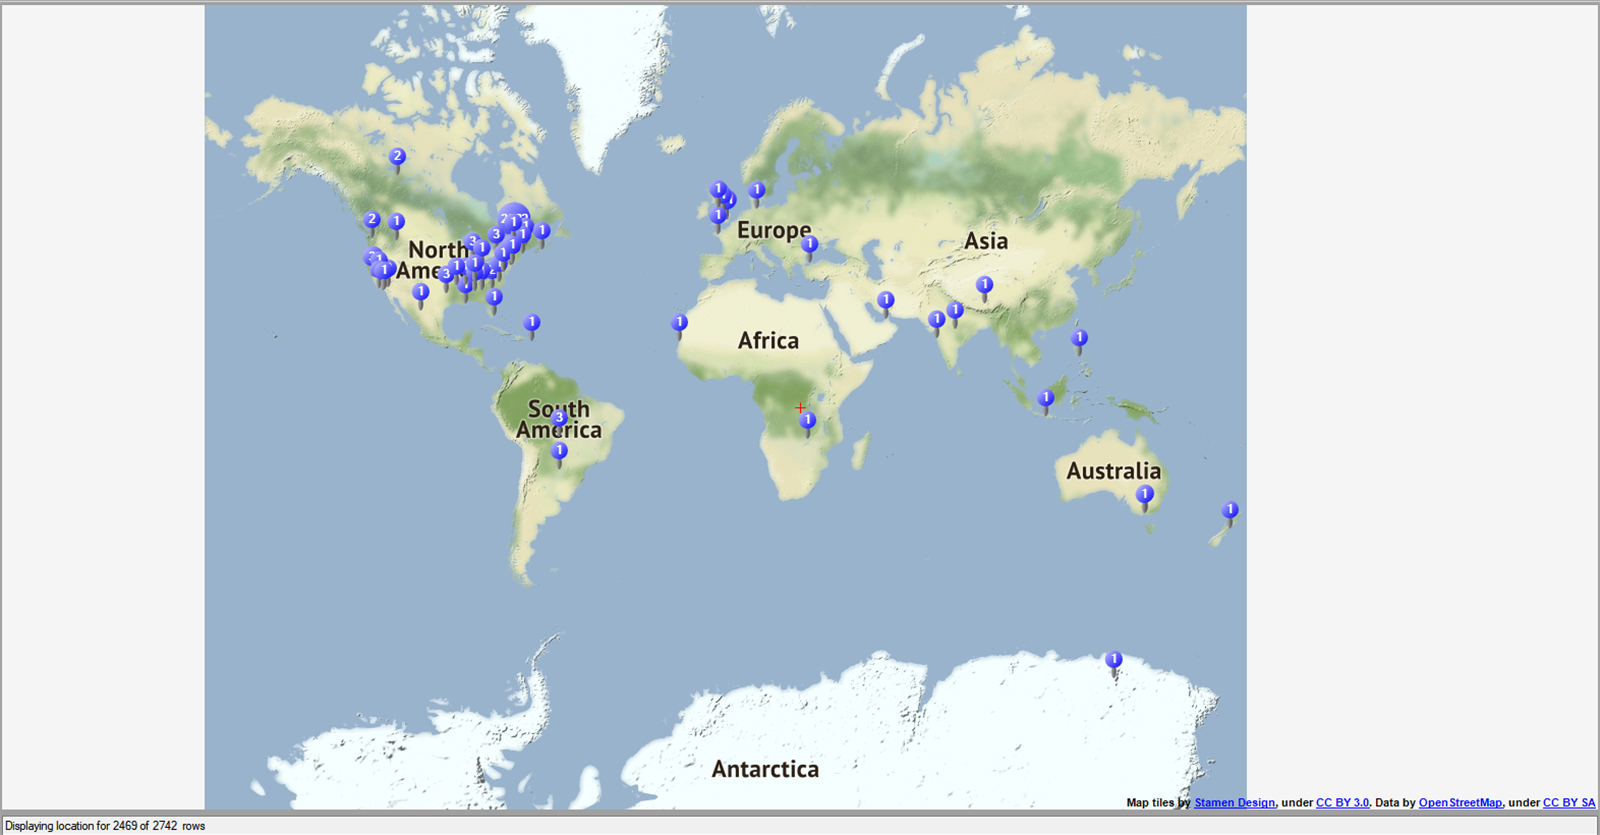
In these datasets, only the Twitter set was enabled for the physical locations. (The Twitter set captures both the claimed physical location in the profile in one data column and the dynamic locational data as enabled by mobile devices and / or particular apps.) The first, of course, tends to be more static, and the latter tends to be more dynamic. (Figure 8)
Figure 8. Geographical Locations of @YouTube Discussants on Twitter
3. Social Network Graphs
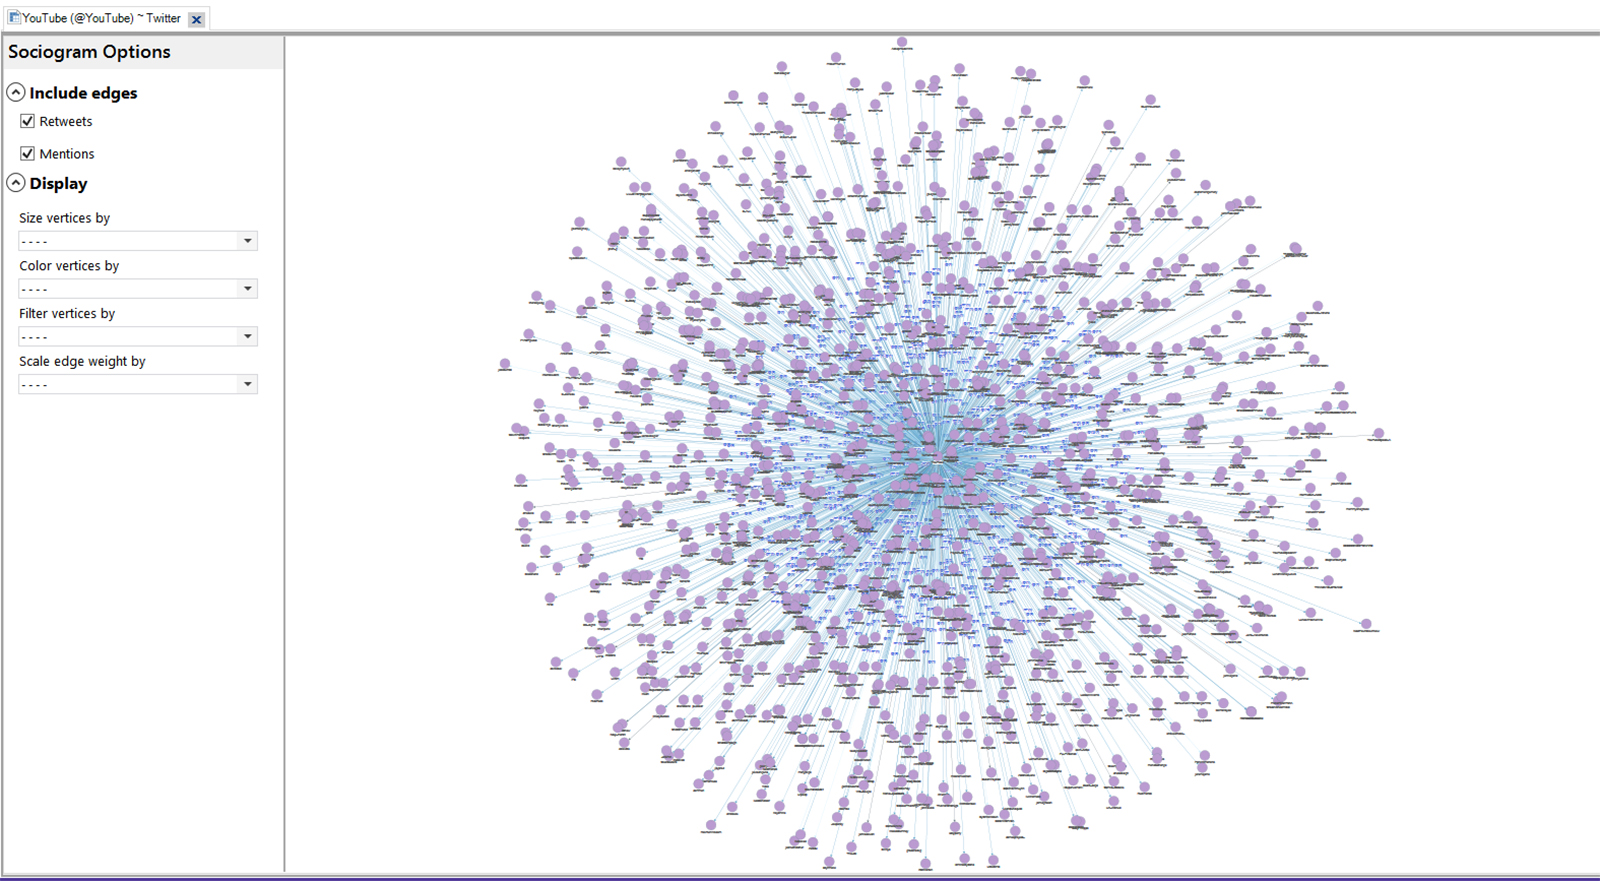
The Twitter data also enables the extraction of social networks, or the interactions between the various social accounts represented in the dataset. (Figure 9) In this case, the Twitter account enabled the drawing of a social network, but the capability was not available on the Facebook set. (The mapping of that network is possible with some data cleaning and processing on UCINET.) This may enable analysis of some of the most influential user accounts in the particular network (based on in-degree, out-degree; network centrality, and other measures). A social network and its constituent ego nodes may also be profiled using such data based on the general idea of “the company you keep.” Within the tool, it is possible to remove some of the ties based on various relationships, with the idea that sparsity can be more revealing of underlying relationships. (On social media platforms, depending on the type of social media and the analytic tool, relationships may be defined in a number of ways: declared follower-following, reply-to, mentions, forwarding, upvotes/downvotes, and others. The length of continuous interactions is another variable as well that may be indicative of relating.)
Figure 9. Extracted Social Network Graph of “YouTube” Messaging on Twitter
4. Word Trees
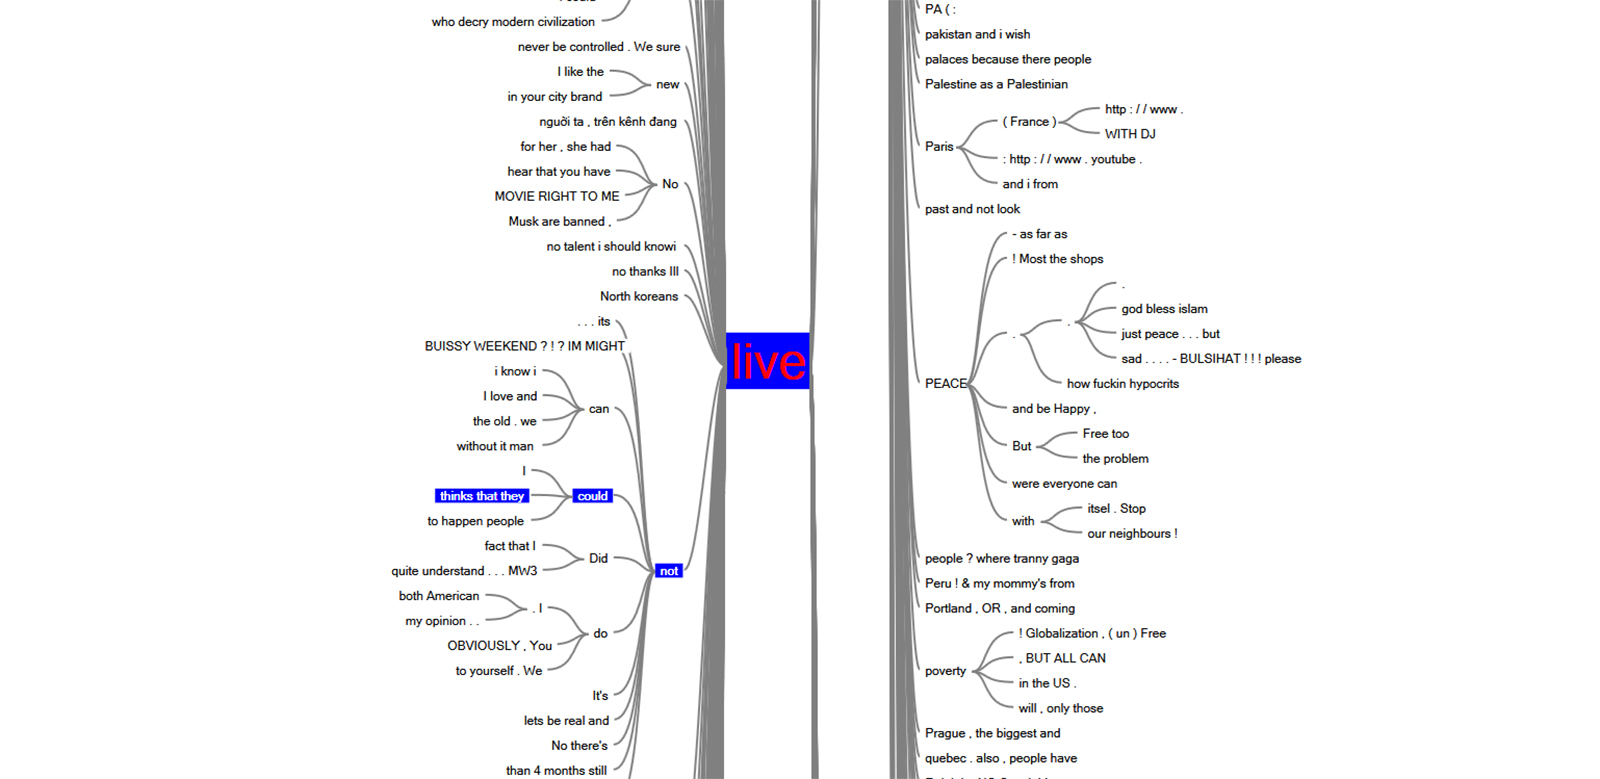
Word trees are data visualizations that capture how a particular term is used in a context. Within NVivo 12 Plus, the word trees are interactive, so it is possible to double-click on any branch in order to go right to the original raw data source from which the particular branch was extracted. It is possible also to highlight a branch on either the left or the right, and to have the correlating other part of the branch highlighted, for understandings of lead-up and lead-away words from a target term to better understand context.
Figure 10. Word Tree Proximity Analysis for “live” of “YouTube” Messaging on Twitter and Facebook
A comparison between the two sets shows that “live” is referred to much more on YouTube’s account on Facebook than on Twitter, but that may also be because the Facebook postream set is so much bigger than the Twitter microblogging one.
| A : Live Word Search in Both Sets | |
| 1 : (2) YouTube - Home | 3330 |
| 2 : YouTube (@YouTube) ~ Twitter | 151 |
Table 1: A Matrix Table Comparing Incidences of “Live” in Each of the Social Media Platform Datasets
5. Sentiment Analyses
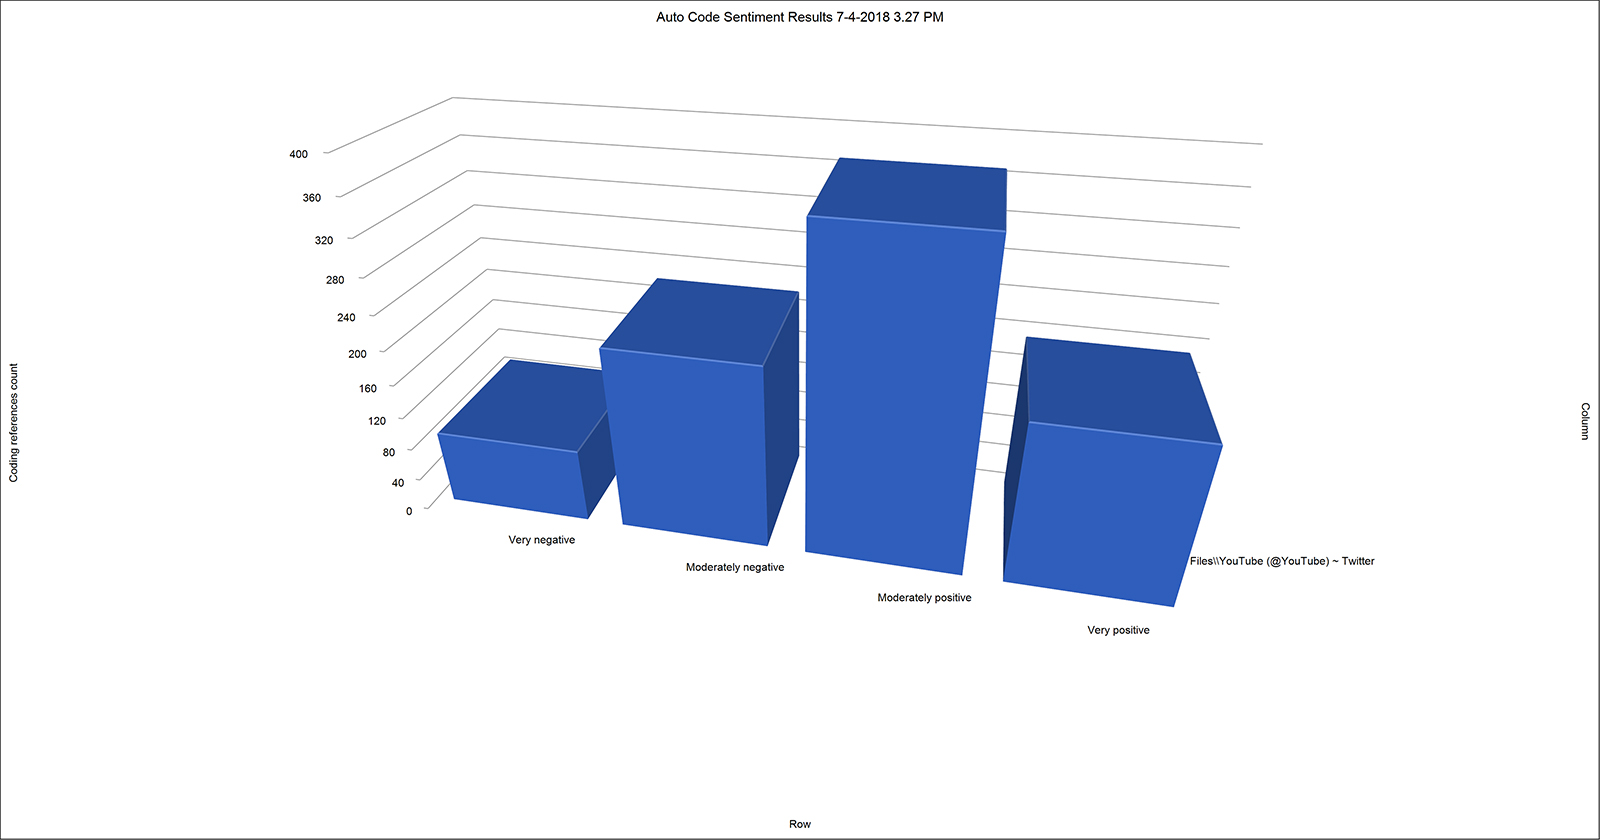
There are automated ways to extract sentiment from written text as well. In this case, while sentiment analyses were attempted on both sets and for combinations of both sets, only the one from the Twitter dataset worked out within a reasonable period of time. (Figure 11) Each of the categories of sentiment may be accessed to see the underlying text coded to that sentiment, and recoding is possible.
Figure 11. Sentiment Analysis of “YouTube” Messaging on Twitter
Discussion. The automated analytics and resulting data visualizations above offer a start to the exploration of this available data. These capture some of what is obvious first at a macro level. These are a little like conversations that people have who talk a little too loudly in public places in the sense that discussants are aware of a potential large public audience. These insights are from a light computational exploration, and human expertise will be important. In terms of latent or hidden data, there is still much to explore.
The setup of the visualizations as side-by-sides from two different social media platform types but with one social account owner also affects what is seeable here.
One final caveat: This is an introductory work that is really about social media data in general and not about any of the particulars here.
Conclusion
This work shows some of the “low-hanging fruit” of text analytics from two popular social media platforms to enable “listening in” on semi-public conversations. Using basic computational analytics, it is possible to explore some macro-level data patterns…but also to zoom in to some micro-level data patterns. This approach has not included any study of outlinks (URLs to external sites), social imagery, shared videos, and other multimodal approaches.
About the Author
Shalin Hai-Jew works as an instructional designer at Kansas State University. Her email is shalin@k-state.edu.
Note: NVivo 12 Plus is the leading qualitative data analytics tool in the market. The author does not have any formal or informal relationship with QSR International, the makers of NVivo.
| Previous page on path | Cover, page 14 of 22 | Next page on path |
Discussion of "Listening In on Public Conversations on Microblogging and Social Networking Sites (with NCapture and NVivo 12 Plus)"
Add your voice to this discussion.
Checking your signed in status ...