ExerciseIllinoisInfographic_Jeanette
Part B:
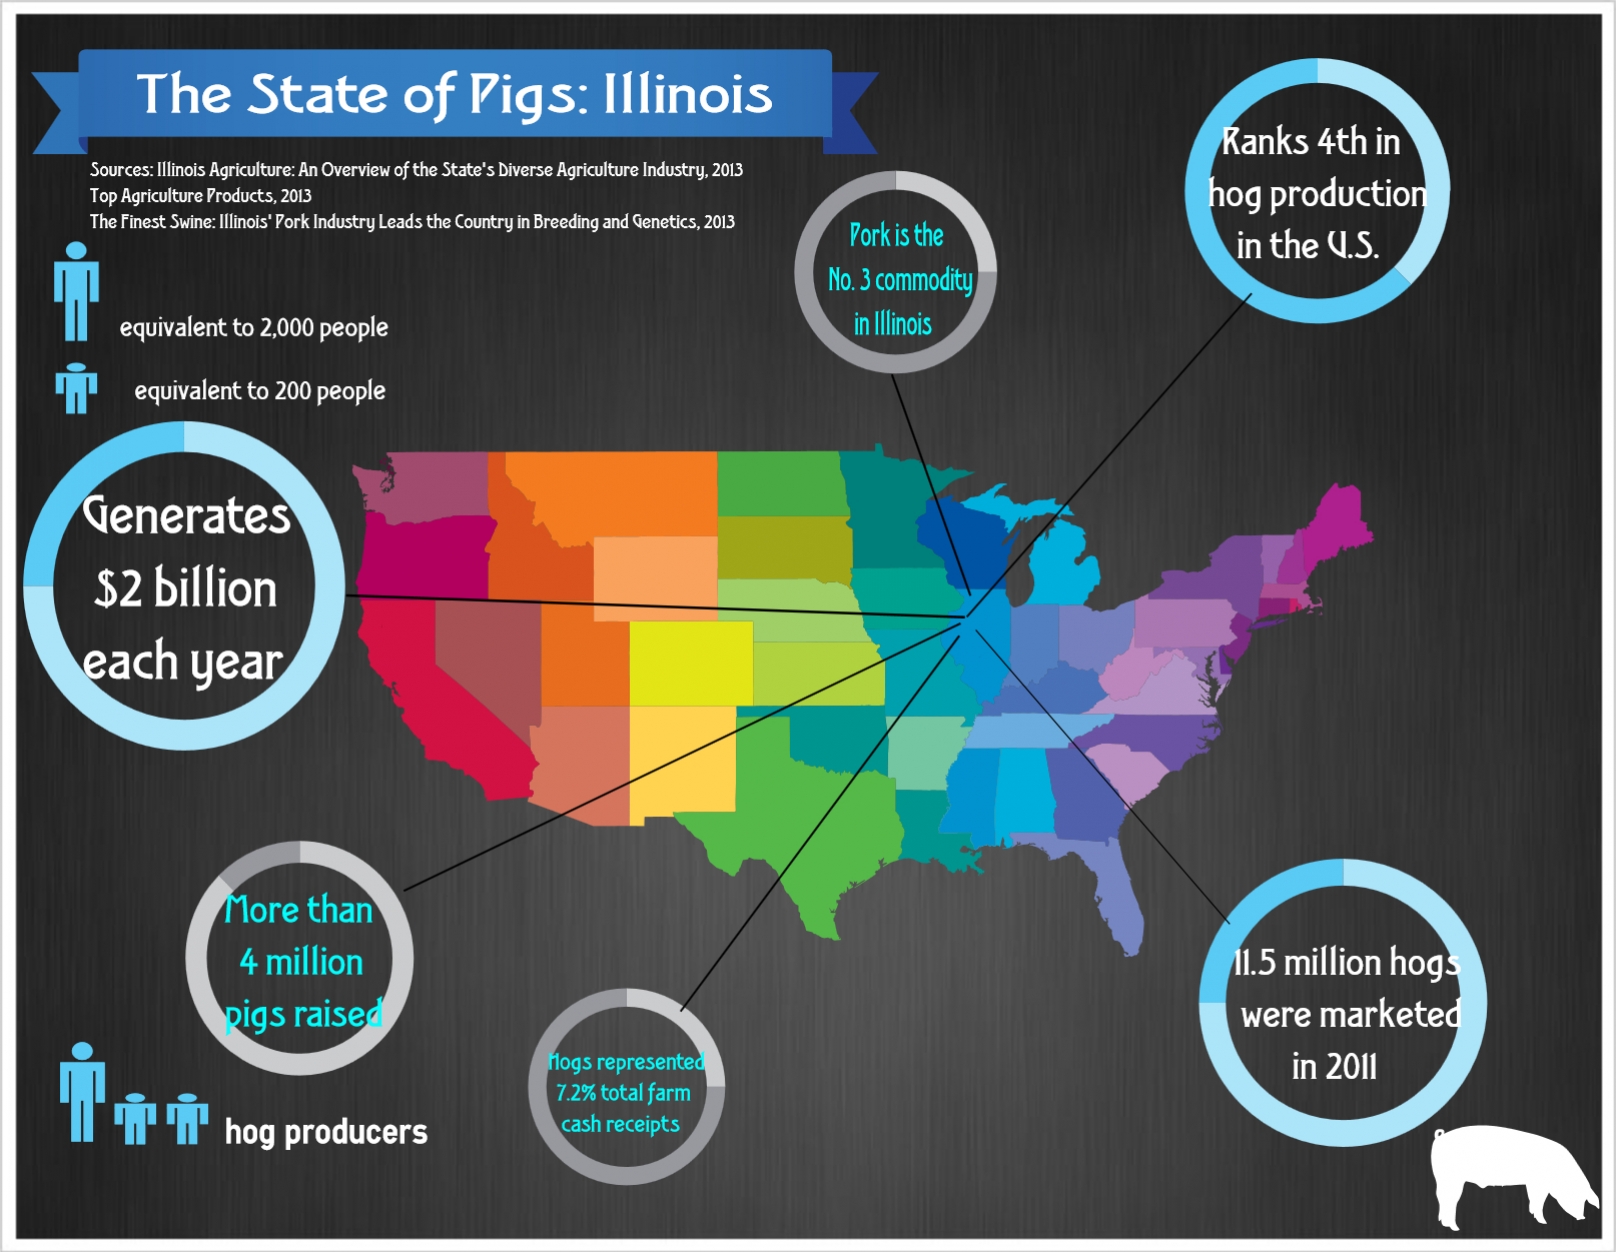
For my infographic, I focused on swine in Illinois due to my brand being Tyson Foods, Inc. I tried to
focus on statistical facts that would make it easier to make an infographic. I also tried to find statistics that differed greatly in how large the numbers were. I tried to emphasize messages about how important the swine industry is
in Illinois based on how many pigs are produced and how much money it generates for the state. I also tried to emphasize messages that compared Illinois to other states in terms of how much swine is produced. In addition, when making my infographic, I did not want to overwhelm the reader with too many facts/statistics, so I chose to include just six statistics.
When making my infographic, I tried to emphasize the difference in the statistics by using larger text and shapes for those that included larger numbers. I also tried to include elements to decrease repetition in the shapes I was using, such as by adding the swine object and using the people object to go along with certain statistics. I felt it was important to have enough space in between each statistic so that the infographic did not look too crowded, which may come off as overwhelming. I used three articles from the 2013 edition of Illinois Agriculture:
- Illinois Agriculture: An overview of the State's Diverse Agriculture Industry, 2013, pg. 9
- Top Agriculture Products, 2013, pg. 11
- The Finest Swine: Illinois'' Pork Industry Leads the Country in Breeding and Genetics, 2013, pg. 17
Part C:
I believe that Marion Nestle would be largely unimpressed with my infographic and would not be that interested in the statistics I included. I think she would believe I focused too much on the quantity of pigs produced and the economic impact of the swine industry in Illinois. Due to having included statistics about the
amount of money generated by the industry, Nestle may wonder if this means that the industry is putting profit over food safety. She may also wonder if the economic impact of the industry means a great influence over governmental policies that deal with food safety. It may be that the influence of the industry is leading to policies with fewer constraints in terms of food safety as this may be saving the industry money.
Discussion of "ExerciseIllinoisInfographic_Jeanette"
Add your voice to this discussion.
Checking your signed in status ...