PDO in Close 5v5 Situations
The next metric included in the model is called PDO in 5v5 close situations. PDO, named after a blogger's internet username who first began to track the statistic, refers to the sum of a team's shooting percentage (what percentage of shots taken score) and the team's save percentage (the percentage of shots on goal that the goalie saves). The average PDO is 100%, and this year the average shooting percentage fell just over 9%, while the average save percentage was just under 91%.
However the PDO in 5v5 close situations refers a team's PDO when the goal differential in a game is 1 in the first two periods, or the game is tied in any of the three periods, and neither team is on a power play. This accounts for good teams who may play less aggressively when holding a large lead, thus diluting the PDO statistic. This metric is included to quantify the "skill" of a team. If a team has an incredible goalie or very good scorers, they are more likely to win. This is clear in the scatterplot below, where the R-squared value is 47%, indicating 47% of variance points can be explained by variance in PDO in close 5v5 situations.
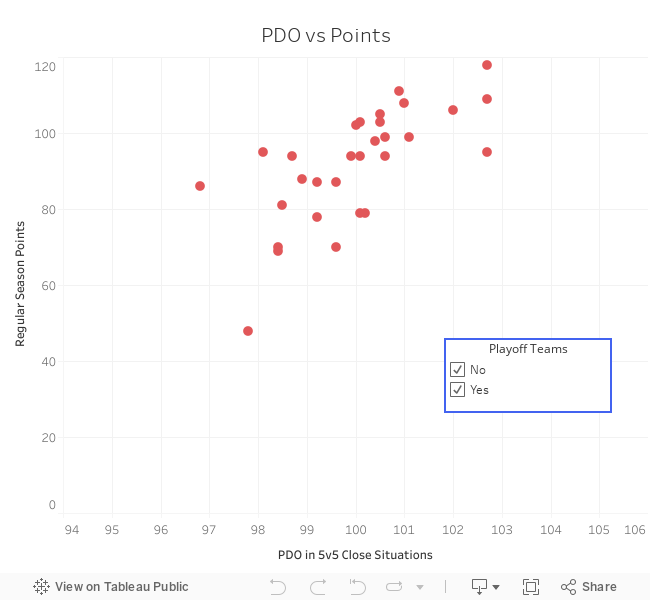
Mouse over each datapoint to see more about specific teams, and toggle between playoff teams and non playoff teams to see what sets them apart!