Team Blocks
The first metric included in the model is the number of shots blocked by a team. Blocking a shot is constituted by positioning oneself in between an opponent and your goalie, so that when the opponent takes a shot, the shot is blocked and your goalie does not need to make a save. A great example is shown to the left, as the defender sprawls on the ice to block the shot.
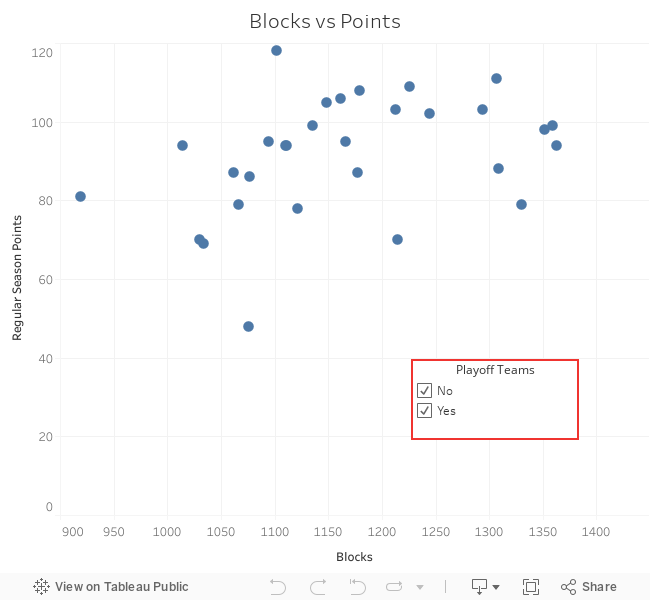
Any hockey coach would tell you that a team's ability to block depends on the team's defensive effort. Blocking a shot is often painful, and is seen as a personal sacrifice made to better your team's chances of winning. As expected, a team that blocks more shots is more likely to win, because the goalie has to make fewer saves and often possession of the puck is gained by the blocking team. This trend is apparent in the team data from the 2016-2017 regular season, with an R-squared value of 49%.