Fenwick For Percentage in Close 5v5 Situations
The third metric included in the model is called Fenwick For Percentage in 5v5 close situations. Fenwick For Percentage, named after its creator and blogger, Matt Fenwick, is calculated as the number of shots taken (on goal or misses) by the team, divided by the number of shots taken by both teams playing.
Thus a Fenwick For Percentage above 50% means the team being examined generates more scoring chances than their opponent, while a team with a Fenwick For Percentage below 50% generates less scoring chances. This value is taken in 5v5 close situations to account for lopsided games that skew the data towards the 50% average Fenwick For Percentage. This metrics a great measure of puck possession ability. The more shots generated in close situations, the better a team is a possessing the puck, specifically in the offensive zone. The higher the Fenwick For Percentage in 5v5 close situations, the more points the team earned in the regular season. This trend is seen below, with a R-squared value of 40%, meaning 40% of variation in regular season points can be explained by variation in Fenwick For Percentage in close 5v5 situations.
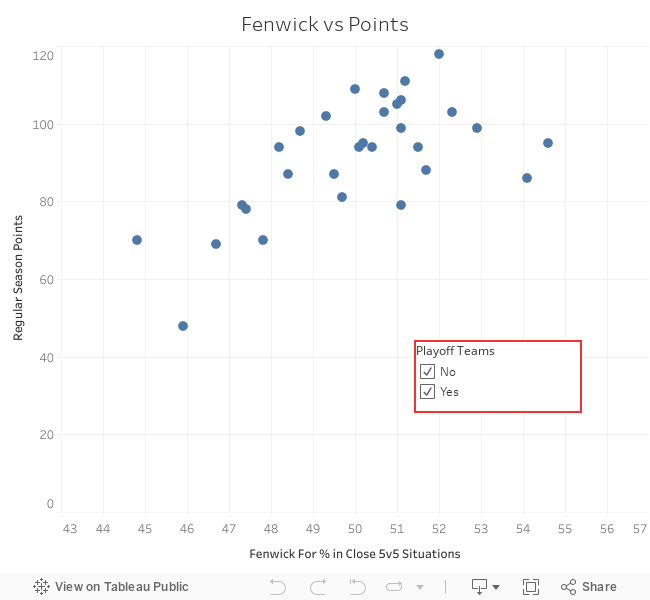
Mouse over each datapoint to see more about specific teams, and toggle between playoff teams and non playoff teams to see what sets them apart!