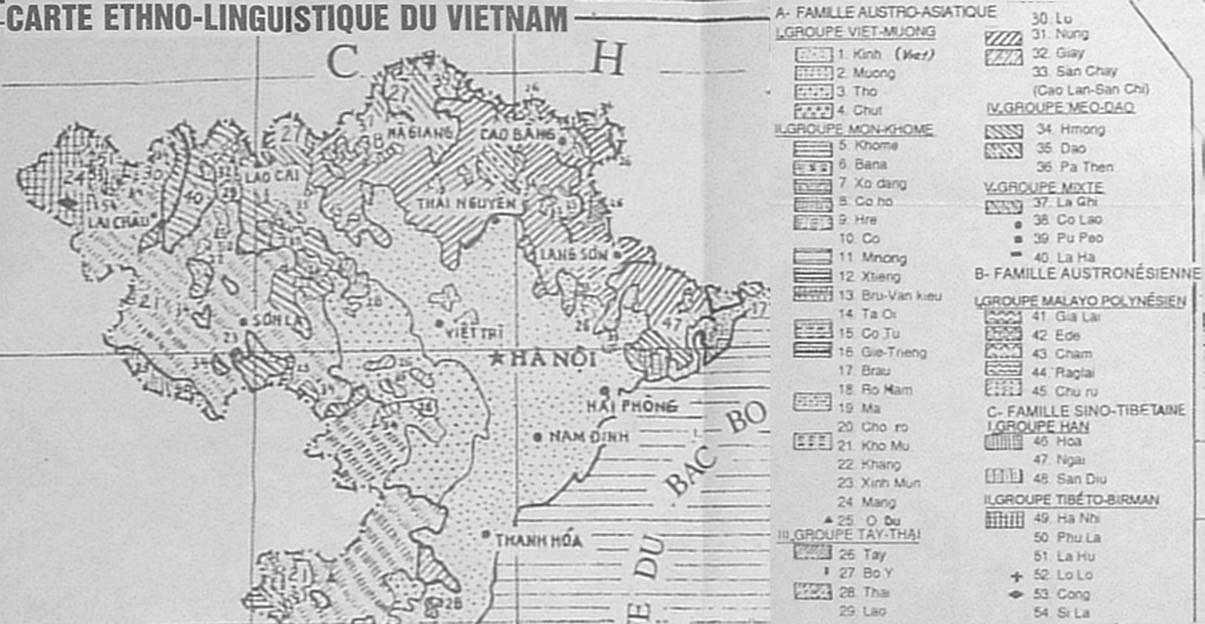
Map of Ethnolinguistic Minorities in Vietnam
This map is dated 1993. It shows the distribution of ethnolinguistic population.This map was published in the Ethnic minorities in Vietnam book by Dang, Chu and Luu, edited in 1993. The map has no scale, but shows the patterns of population. It does not show the topographic view of Vietnam, so we cannot see where minorities are living. If we were to use a topographic map and place it next to the ethnolinguistic map, we can assume that most minorities live in the highlands/mountains. The limit to the map is that there are only 54 ethnic minority groups, which was determined previously in the 70’s by the French’s guidance of a national survey. This number could have increased or decreased depending on contact. According to a study, there is no source that is given to prove this ethnolinguistic division (Michaud et al., p. 289). Also, the map does not represent any form of metrics to show the count or actual distribution; it merely shows the area for which the groups may inhabit. After the Vietnam War, the communist party tried to reunify the country, expelling non-Vietnamese populations and creating hostility towards Christian groups. After the realization of the economic conditions after the War, the communist party enacted the Doi Moi policy, or Renovation. The Doi Moi policy influenced a better study and count of ethnic minorities in Vietnam. Later maps show a cluster of ethnic groups, whereas this map presents the 54 distinct populations.
I suspect that ethnic minorities are still fleeing from their homes due to ethnic and religious persecutions by the Vietnamese government. What I hypothesize is that ethnic minority populations are still located in mountainous regions and highlands. If I were to re-represent this information during this time, I would see a shift in Northern Vietnam’s ethnic minority population to Central Highland and other mountainous areas, or even a push back further into the mountains. Like the Hmong Christian leader and many other vulnerable populations, moving away from the communist core may be an effective method to adjusting to ongoing persecution. I believe that a map showing the current population trends for ethnolinguistic minorities will shed light on Vietnam’s economic and political investments to areas where there are high numbers of ethnic minorities. In the end,is the Doi Moi policy exploiting these vulnerable populations with intentions of research or are ethnic minorities simply moving further into the mountains to avoid nasty confrontation?
Source:
Jean Michaud, Turner, S., and Roche, Y. Mapping ethnic diversity in highland Northern Vietnam. In GeoJournal 57: 281–299, 2002. Received 5 March 2003; accepted 29 July 2003
| Previous page on path | Critical Maps of Ho Chi Minh City, page 2 of 2 | Path end, return home |
Discussion of "Map of Ethnolinguistic Minorities in Vietnam"
Add your voice to this discussion.
Checking your signed in status ...