Deformation: Mapping Dialogue in Roister Doister
Here is a handout featuring various Gephi visualizations.
1. Full Frame
I'm going to discuss deformation as a critical practice, with particular reference to my project, "Mapping Dialogue in Ralph Roister Doister." I'm going to move, briefly, through two broad points: representing the text and deforming it through two different ways of manipulating the representation of the play.
2. Dialogue Map with Arrows
As a reminder, my project is a visualization of dialogue patterns in Roister Doister. My goal involves two visualizations: the first visualization will model exchanges of dialogue between characters, when one is addressing another. If Roister Doister speaks to Merygreeke, for instance (they are two main characters), then that will be an exchange between nodes, irrespective of response. The second will model the occurrence of speech headings as they appear in Act III. The contextual direction of dialogue does not matter here, but only who is actually signaled to be speaking by the text, in a more linear fashion. Today I'm only going to use the first, directed-dialogue visualization.
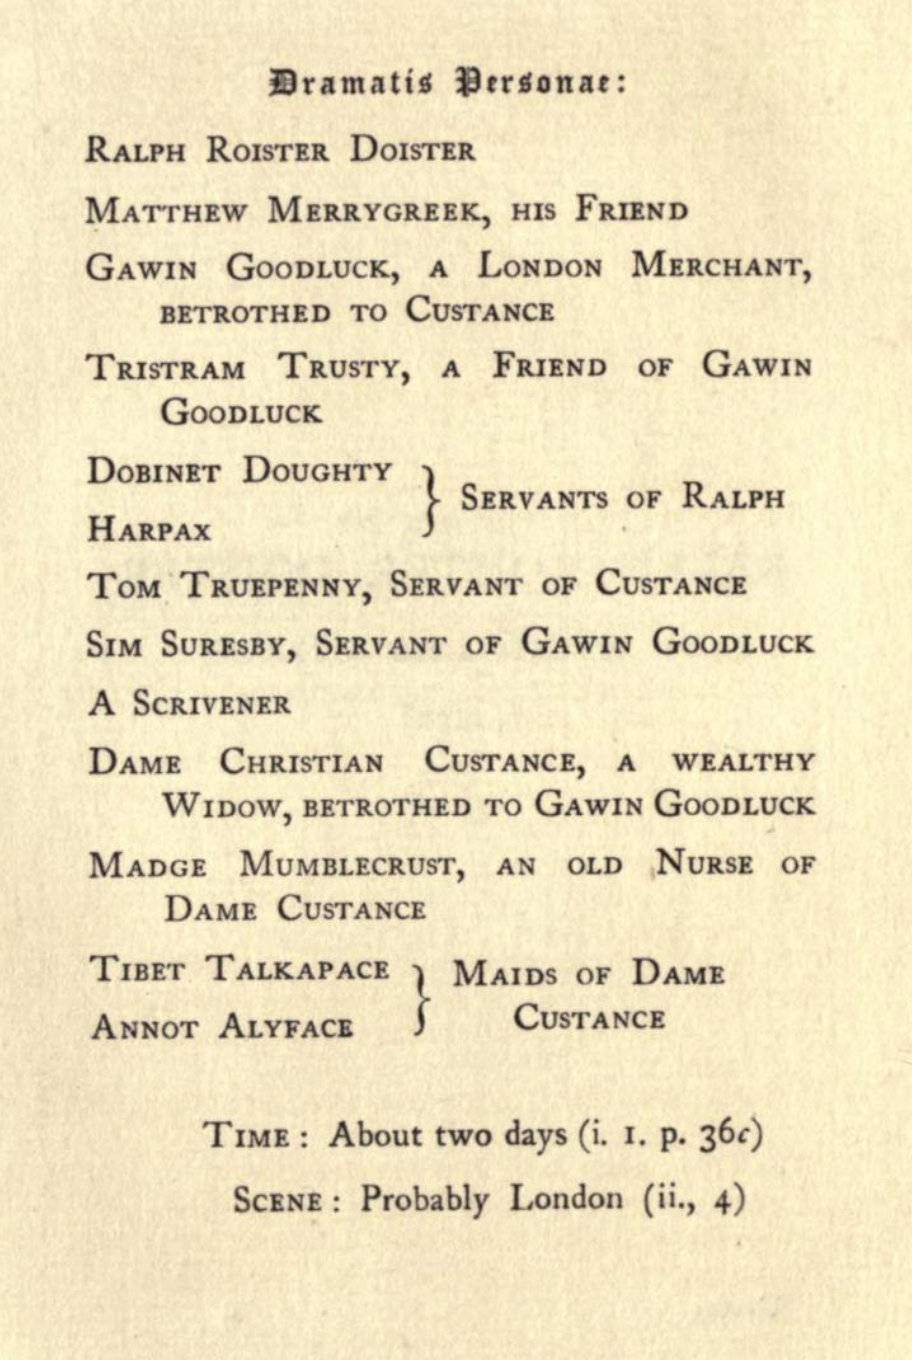
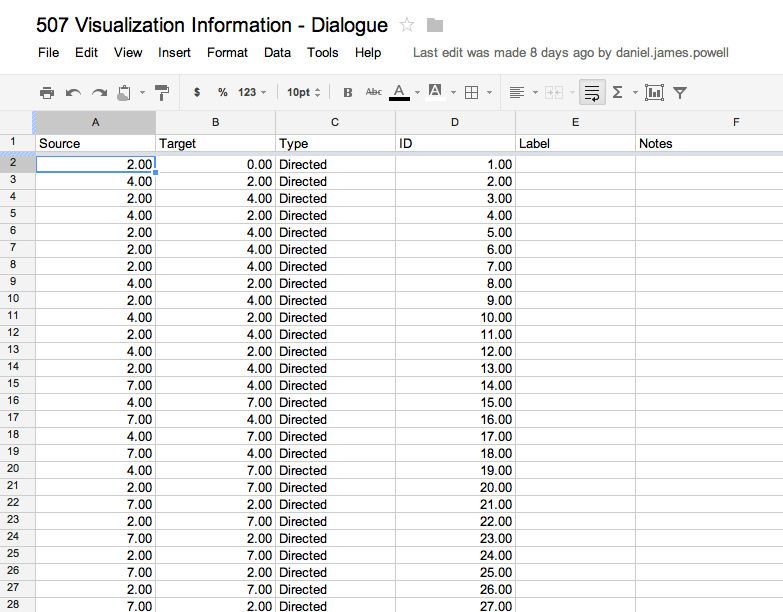
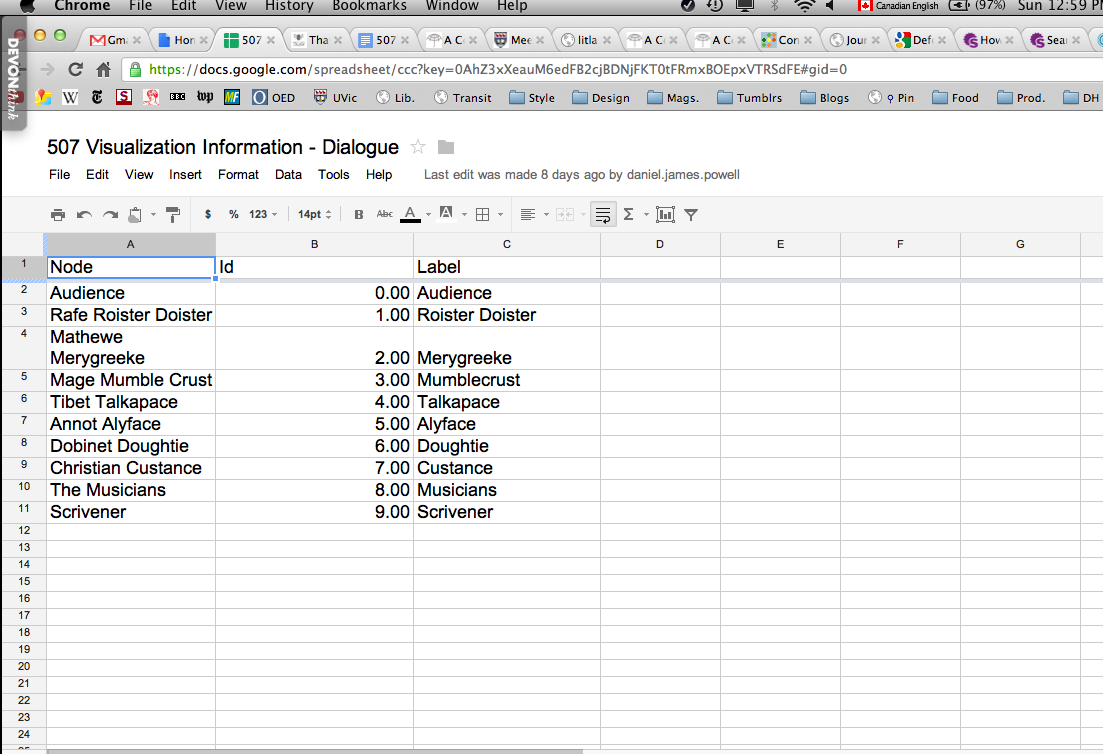
3. Representing the Text; Roister Doister Title Pages and Google Spreadsheets
To recap: I'm attempting to represent the dialogue in Act III of the play using Gephi. First, this means I, using pen and paper, determine the direction of dialogue in the play. Then that information is added to Google Spreadsheets.
4. Google Spreadsheets and Gephi Data Laboratory
These spreadsheets are then imported into the Gephi Data Laboratory.
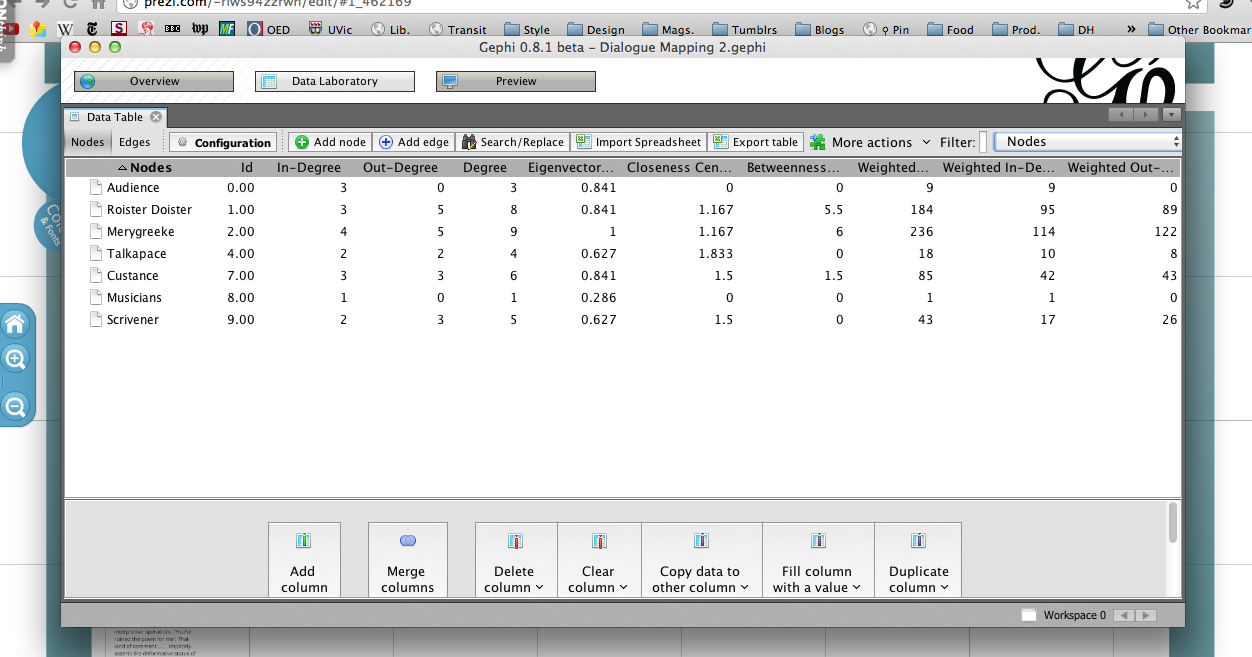
5. Gephi Data Lab Closeup
Gephi automatically collapses multiple identical data pairs, yielding the weighted numbers you can see in the bottom screenshot. So for every node 7-2 connections (Custance to Merygreek), it collapses them to give them a weight, in this case 35.
6. Raw Gephi Visualization (Complete Mess)
And this is what would come out with absolutely no tweaking except making each node an individual colour. As you can see, it's a complete mess.
7. Proportional Node Cloud (Size of Node and Label Based on Centrality)
This is what a Gephi visualization of Act III's dialogue looks like with some cleanup. Each node has an individual colour. Each name corresponds to the node, and both nodes and labels are proportionate to the weight it carries. This can be loosely considered a sort of Wordle cloud, where size corresponds with importance.
8. Deforming the Text; Explanations and Tweaked Gephi Viz; McGann and Samuals, McGann
The idea of deformation is one that Jerome McGann has discussed extensively, not least in his book Radiant Textualities. In it, he recounts his experimentation with Photoshop and the critical insights it gave him about the art of Dante Gabriel Rossetti. Although he is speaking particularly of paintings, his conclusions are applicable to textual studies: deforming texts can "expose the characteristic formal features" of a work, while also helping to "release perception from the spell of precisely those kinds of characteristic formal patterns, and open a perception of different arrangements and patterns" ("Visible and Invisible Books" 149).
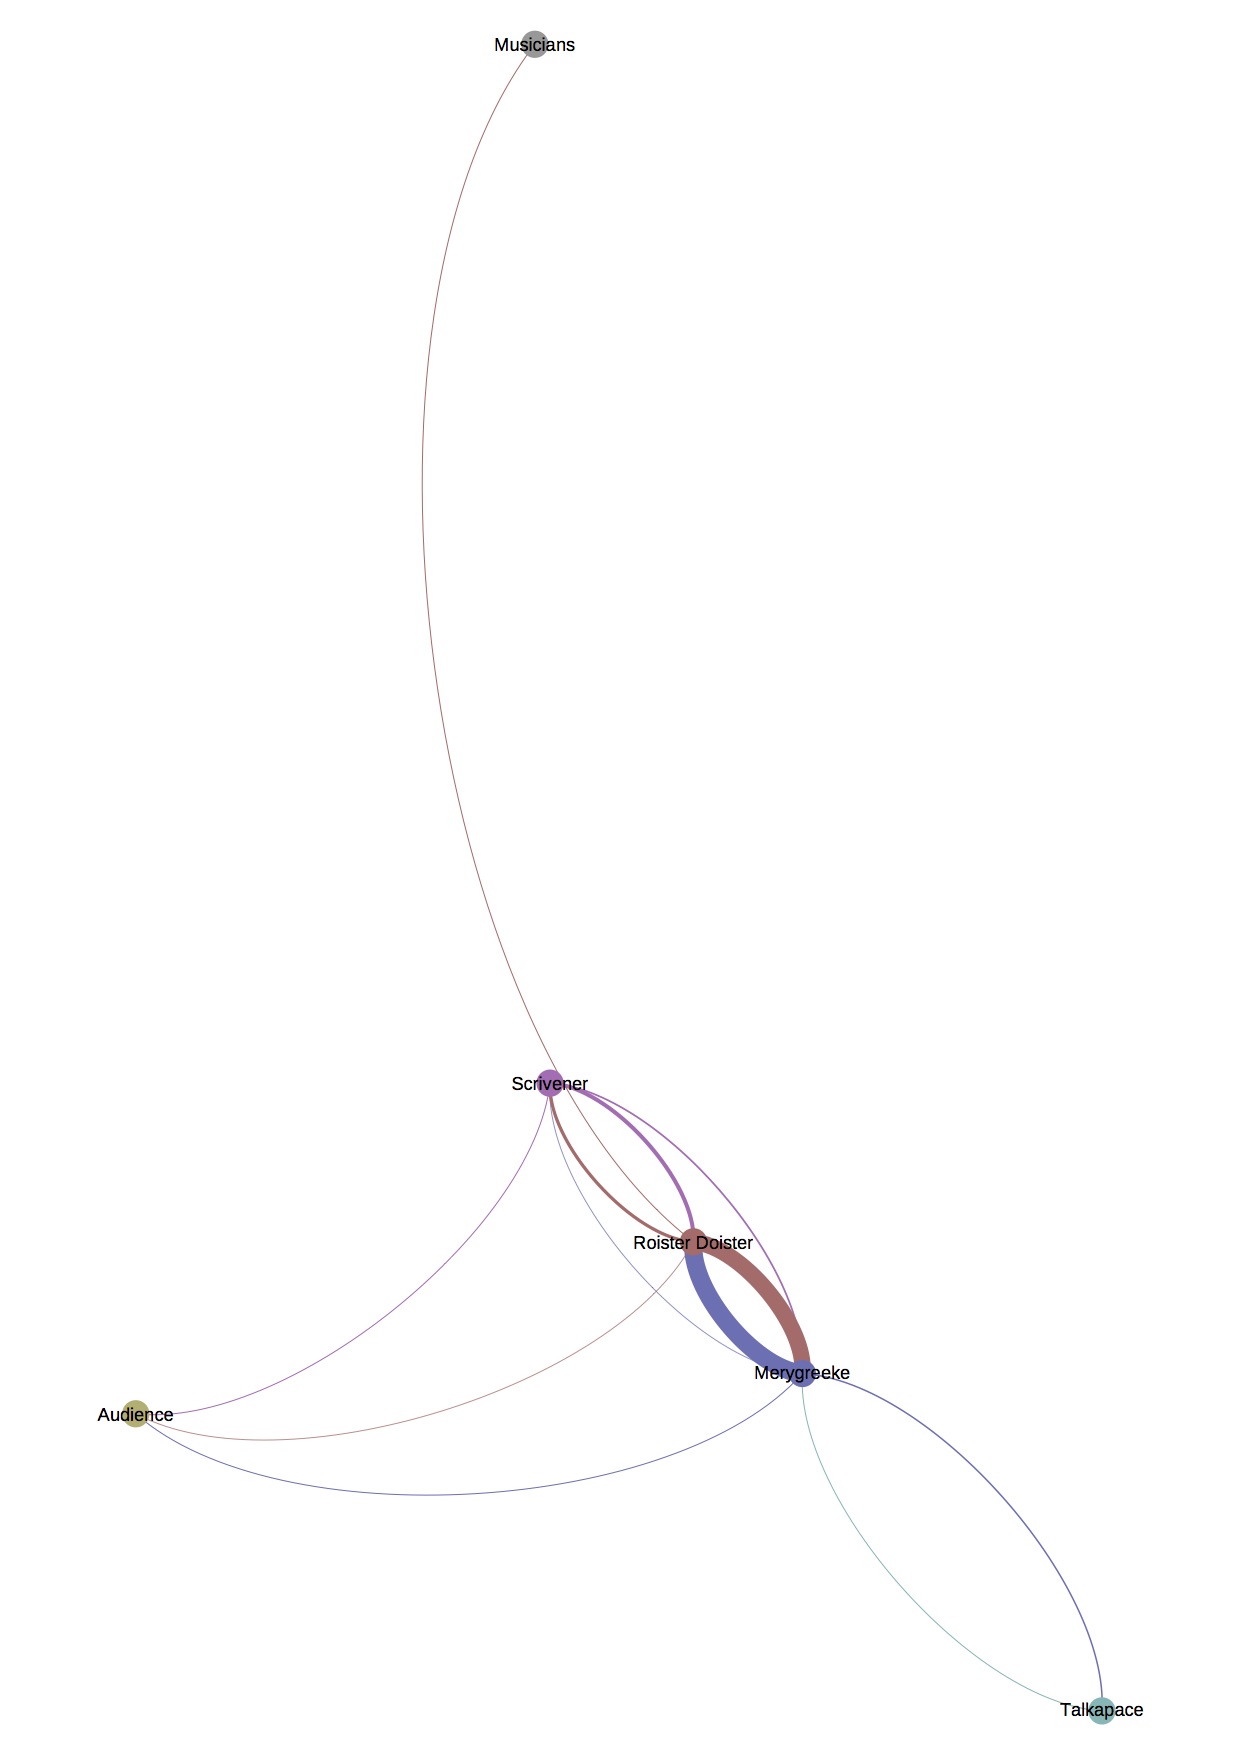
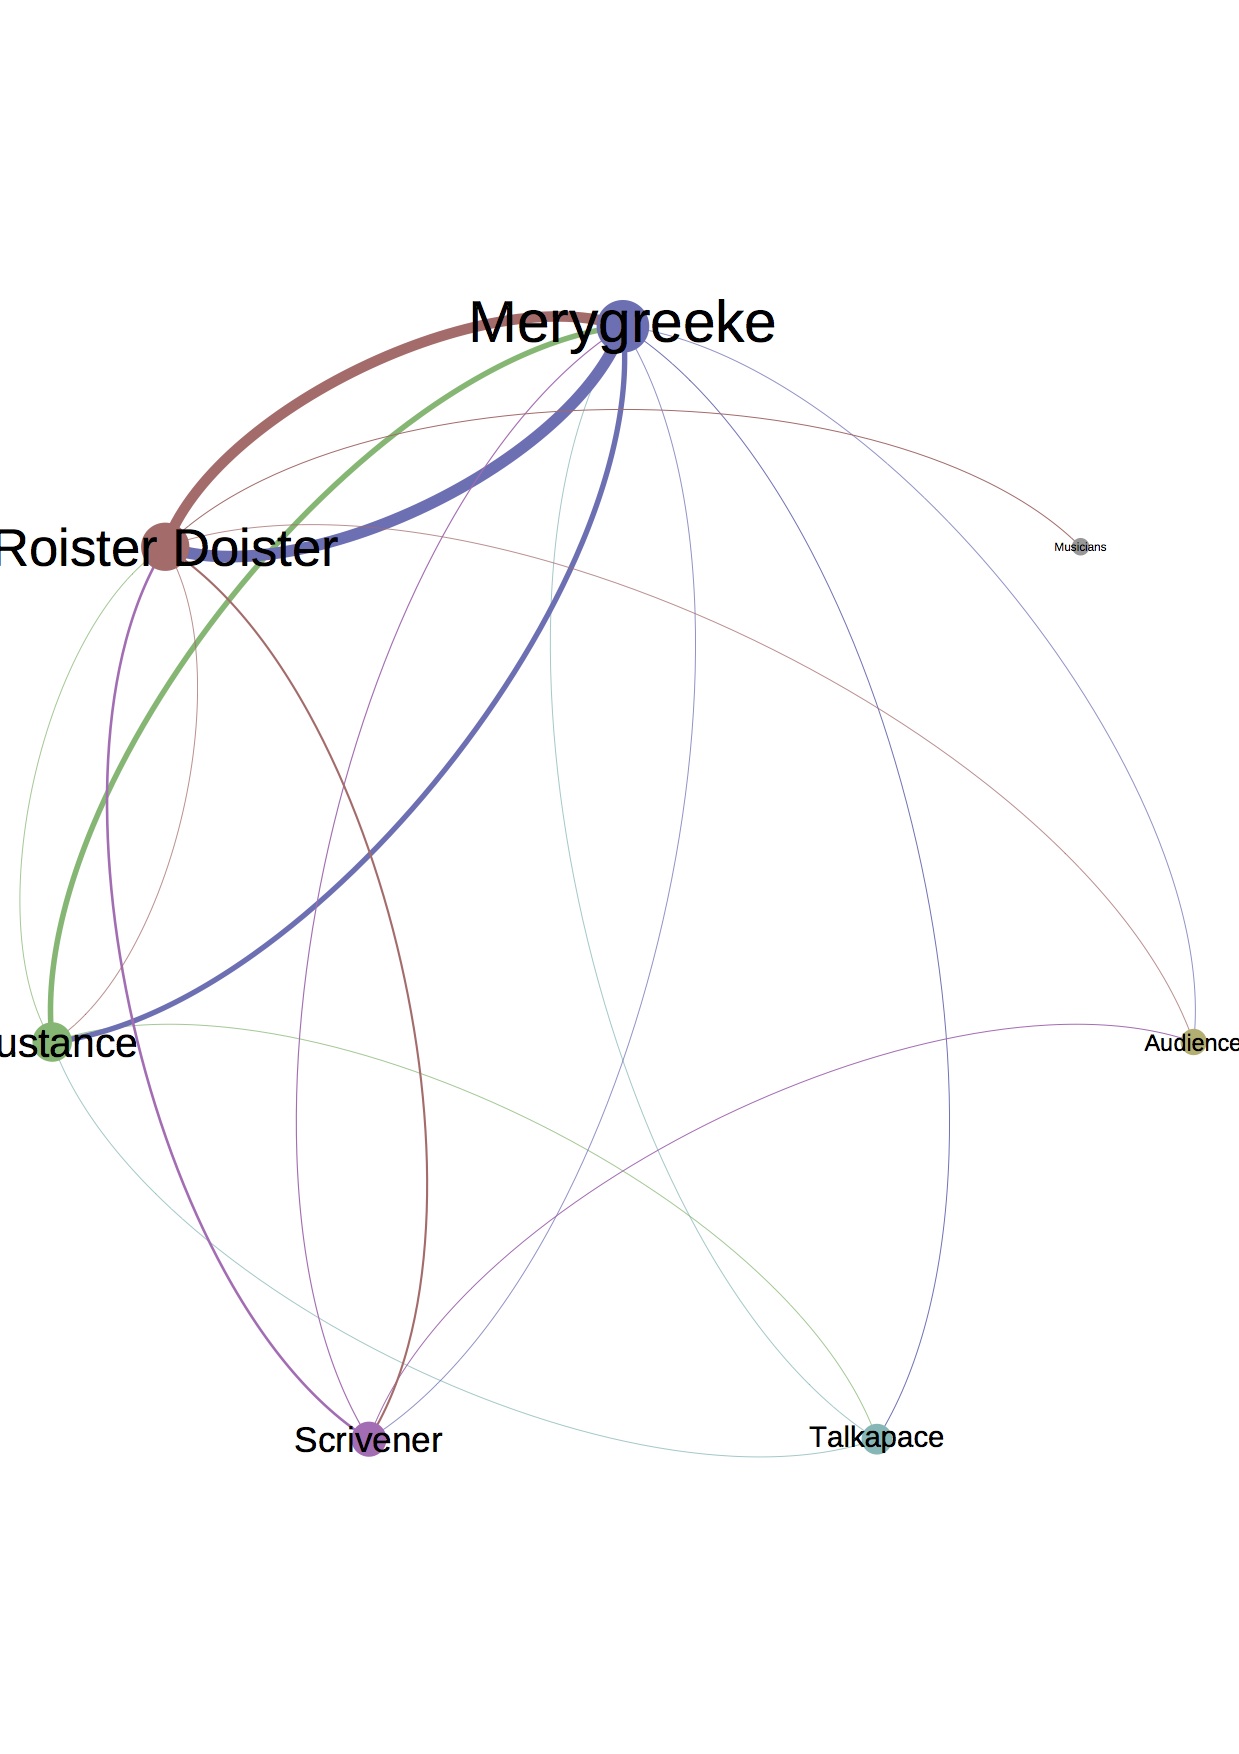
9. Gephi Viz Closeup Showing Proportional Connecting Lines Based on Weight of Exchanges
This is a cleaned up and tweaked Gephi visualization, formed by applying a Force Atlas algorithm to the imported dialogue information. Here, each node is coloured for each individual character. The lines emanating from each node match it in colour and are weighted acceding to the density of connection between characters. As Michael suggested with his map of Dublin, this is a representation of the text. As such, it will be my "baseline" for deformative manipulations.
10. Removing Characters; Removing Custance; Baseline Viz on Left, Custance Removed on Right
The first set of these are removing characters. What this means is that in the Gephi Data Lab (its spreadsheets), I simply remove the node for the character I want to excise. This removes them from every exchange. This comparison is what happens Custance is removed from the play. It's also the first pairing on your handout. As is immediately obvious, she is a major character who has disappeared. The relative weight of the exchanges between Roister Doister and Merygreeke have, however, increased. Also, the overall shape of the visualization remains intact.
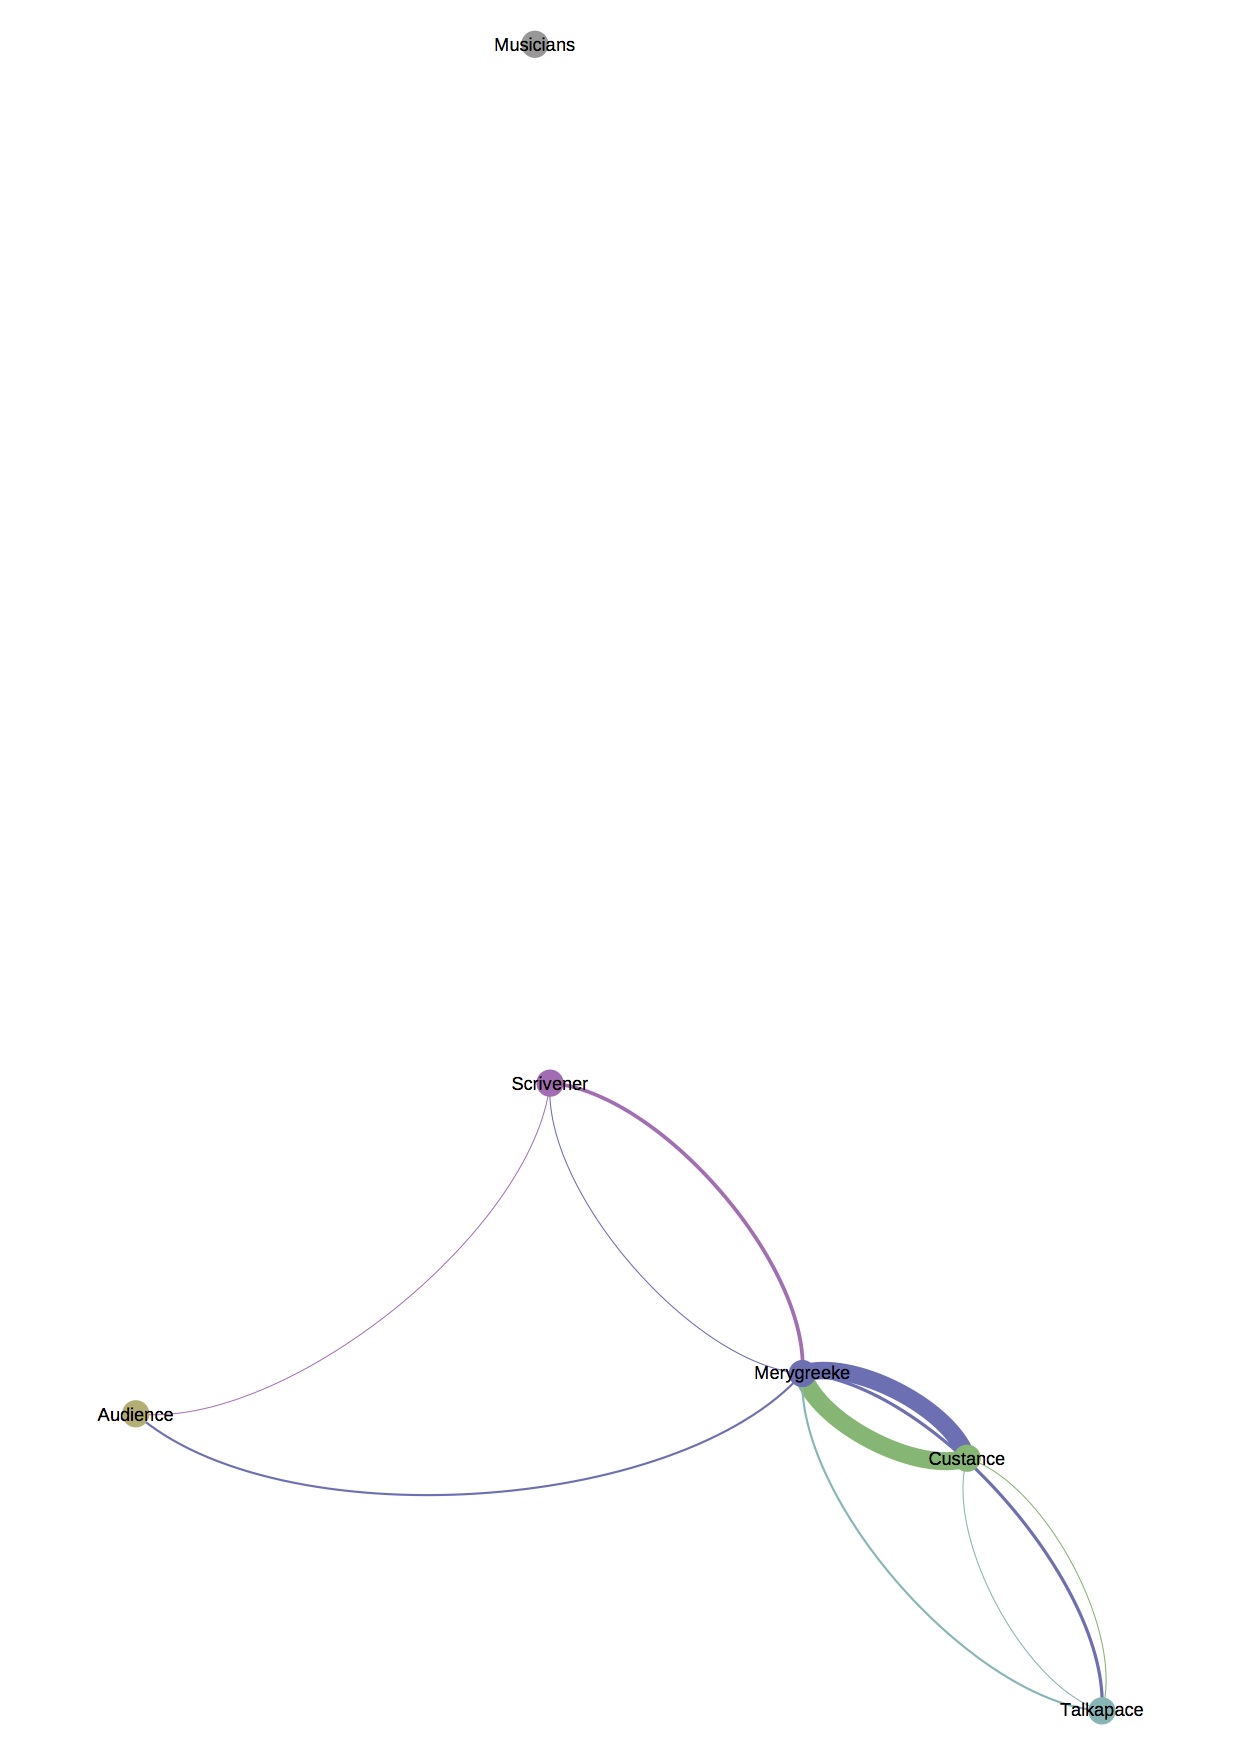
11. Removing Roister Doister; Baseline Viz on Left, Roister Doister Removed on Right
Again using the baseline visualization, always on the left, we remove Roister Doister from the data set. Although the overall shape remains the same, the number of exchanges dramatically alters. Notice the numerous small lines, representing one through three exchanges, have vanished. Additionally, the weight of dialogue between Merygreeke and Custance has increased.
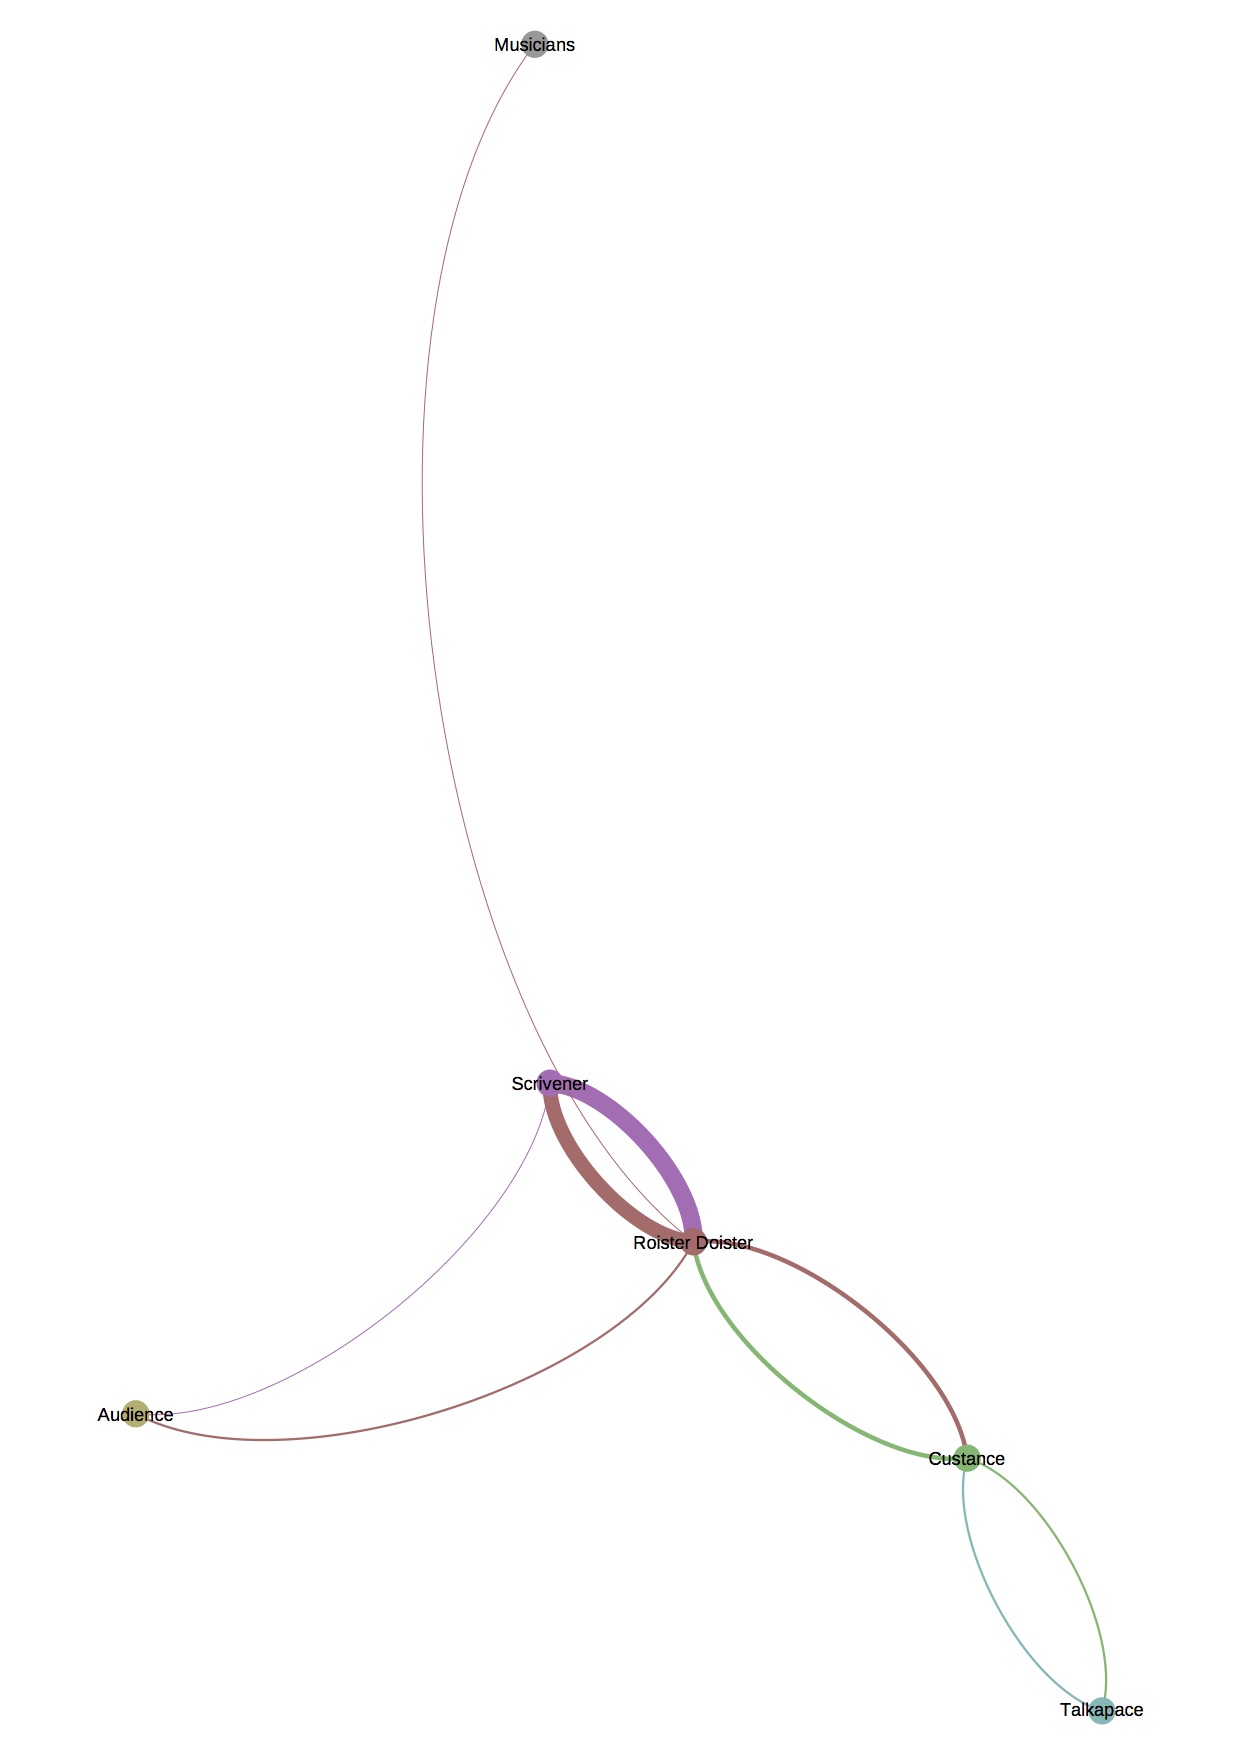
12. Removing Merygreeke; Baseline Viz on Left, Merygreeke Removed on Right
In this last deformation premised on character removal, Merygreeke has been removed. This is by far the most impact-heavy of these deformations. With his removal, the majority of small exchanges have disappeared. Roister Doister and Custance, ostensibly the focal point of the play, have barely any contact; in fact, Roister Doister interacts more with the scrivener, a character only on stage for a single scene, than he does with Custance through the entire act. The pivotal nature of Merygreeke is easily visible, as he serves to connect Roister Doister and Custance.
13. Explanation of Force-Directed Algorithms
Here I want to pause for a moment to comment on the way these visualizations were produced. In all the previous deformations, the algorithm has remained constant. Gephi has many options for this, but these were produced using the Force Atlas algorithm, meaning they rely only on the information within the data set and are modelled after physical phenomena. It's as if nodes were connected with springs, exhibiting repulsion and attraction.
14. Reconfiguring Visualizations; All algorithms Visible
This is important because here I begin to apply different algorithms to the same set of information. Very different visualizations result, although trends are apparent.
15. Yifan Hu Proportional Layout Algorithm; Viz Closeup
In this algorithm, for instance, node and label size are tied to weight of the node. Custance, Roister Doister, and Merygreeke are all large. In this instance, though, Merygreeke is placed firmly in the centre of the dialogic universe of the play. His centrality is quite visual.
16. Circular Layout; Viz Closeup
In this circular layout, all nodes are evenly spread around, as if on the edge of a circle. Again, the three main characters dominate the visualization, with Merygreeke the most connected node by far, as well as the one with the heaviest ties to other nodes.
17. Reconfiguring Interpretation; Quotation from "Speculative Computing: Aesthetic Provocations in Humanities Computing," by Drucker and Nowviskie
For the most part, I have refrained from commenting on the implications of these deformations, hoping instead to highlight the ease and speed with which they can be affected. As Alison will discuss, however, these practices are useful because they lead to new interpretive possibilities. Seen as a speculative practice, every digital deformation becomes a reconstitution of a model that then precipitates new interpretations by the individual enacting the transformation.
Author: Daniel Powell
Word Count: 1172
| Previous page on path | 7. Roundtable, page 10 of 22 | Next page on path |

Discussion of "Deformation: Mapping Dialogue in Roister Doister"
Following Along: Integrating Prezi and Scalar
This page is my portion of our collaborative roundtable presentation. I have chosen to keep my revisions to a minimum, with the hope that the sparse nature of the page indicates the extent to which the Scalar-based portion of our roundtable presentations were integrated with and dependent on face-to-face interactions in the moment in the classroom.For my section of our discussion, I presented on deformative network visualizations of the early modern play Ralph Roister Doister. Each numbered item accompanies the deformation section of our included Prezi (linked to from our introduction). In fact, our final roundtable materials are perhaps best experienced by running the presentation while reading along in Scalar. The images on the page are samples from our group Prezi, but not completely inclusive.
In structure, this was much like the Pecha-Kucha-style presentations we each used to propose our final project. At this point, though, I had progressed a great deal and was in a sense reporting some of my preliminary results to the class, highlighting how my methods fit into our overarching theme of "Representation, Deformation, Reinterpretation."
Author: Daniel Powell
Word Count:181
Posted on 9 July 2013, 11:44 am by Jentery Sayers | Permalink
Add your voice to this discussion.
Checking your signed in status ...