This page was created by Karen Hallett. The last update was by Andrea Davis.
Anonymous's Visualization
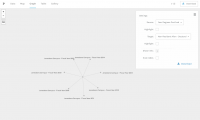
Difficulties with this assignment - formatting the spreadsheet so that Palladio would accept it was difficult, but was finally successfully achieved. This lead to the observation that this particular data set is not conducive to this type of visualization. This data would be better served using traditional bar graphs, line graphs, and pie charts. A network style visualization does not add to or enhance understanding of the data.