Importing a Survey into NVivo Using a Microsoft Excel File
Survey Data Import Using an Excel File
[The visual examples in this work refer to older versions of the tool, but the basic ideas still apply.]
---
Another way to use the strengths of NVivo 11 Plus and NVivo 12 Plus (on Windows) while uploading survey data is to first extract the data from the online survey system. Often, the extracted files may be extracted as Excel or text file formats and tend to be in zipped files. The zipped files have to be downloaded and then the files extracted.
NVivo 11 Plus may take survey data as native Excel files (such as an .xl or .xlsx file) or in text formats like .csv, .txt, .rtf, and other formats. If the original download from the survey system is a .csv format, that can be opened in Excel and converted if a different file format type is desired.
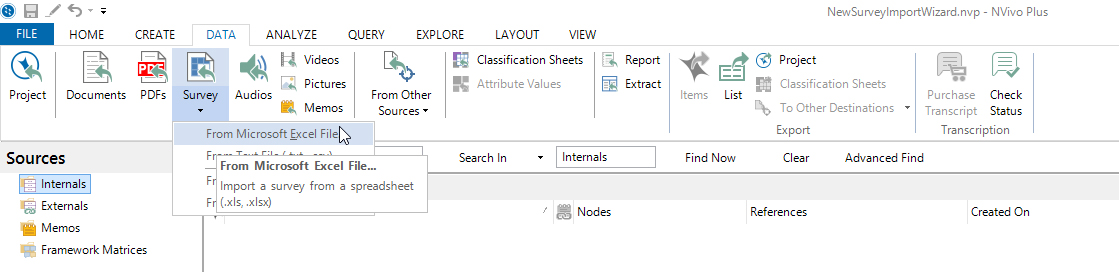
Figure 1: Survey from Microsoft Excel File
To start this process, in the NVivo ribbon, go to the Data tab. From there, select the Survey button. In the dropdown menu, select “From Microsoft Excel File.” Browse to the location of the file-of-interest. Select it. The moment it is selected, the “Welcome to the Survey Import Wizard” window opens.
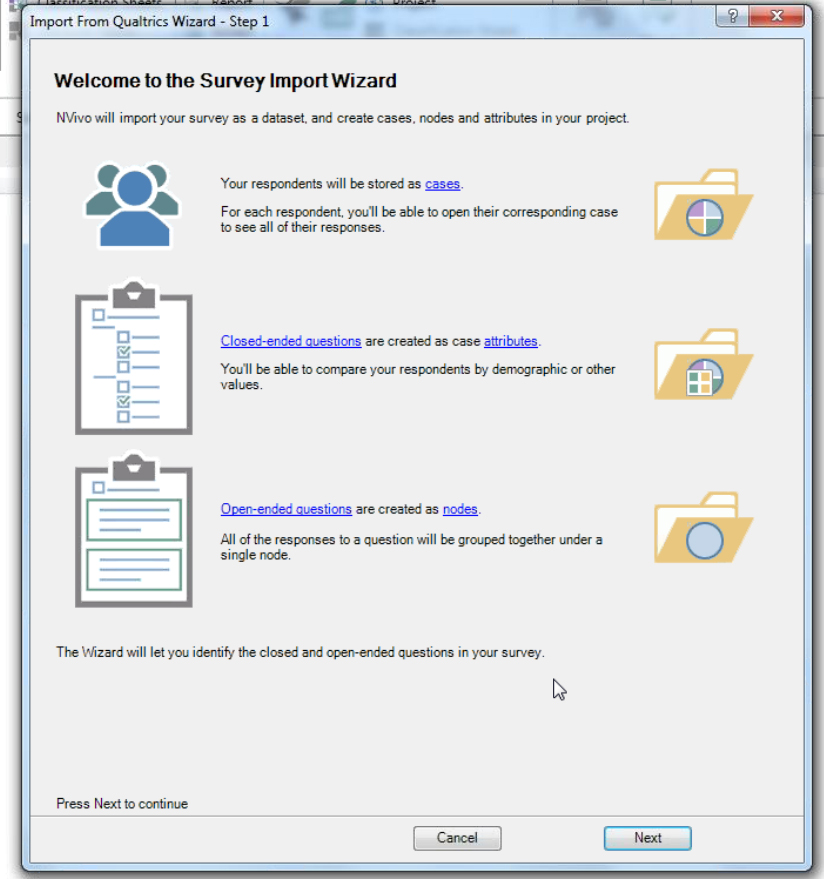
Figure 2: Welcome to the Survey Import Wizard Opening Screen
This window summarizes how NVivo will “autocode” the data from the Excel worksheet. Respondents will be stored as cases, with related classification sheets. Close-ended questions will be treated as categorical case attributes (or categorical data) in the case classification sheets. Open-ended questions will be treated as question-based nodes (with all responses to the respective questions integrated into one node each).
Click “Next.”
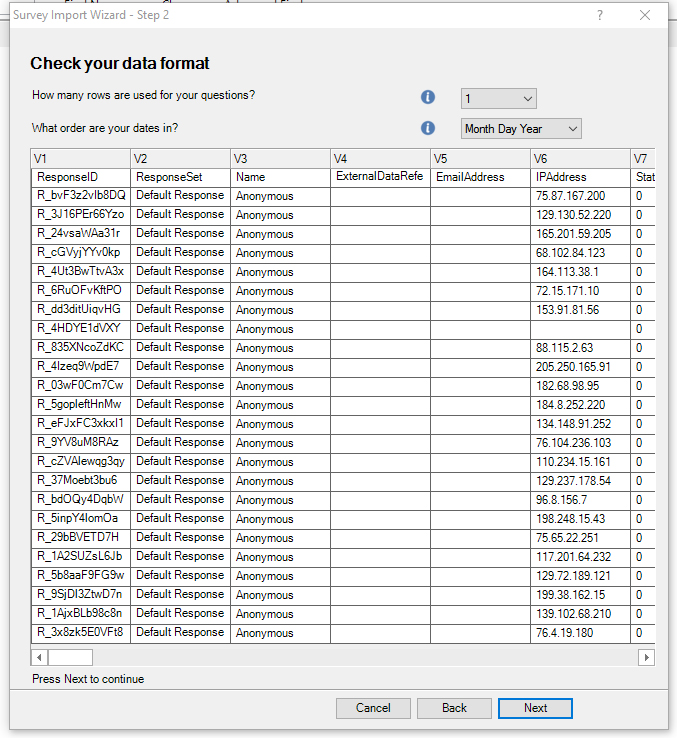
The “Check your data format” window opens (Step 2). While most (if not all) of your data fields will be auto-recognized by the software, if there are residual questions, those have to be answered at the top. There may be various questions about the way the data is structured in the table. The date structure also requires clarification here (in this sample set). There is a forward arrow at the bottom right which may be used to help scroll through the data columns. There is a backward arrow to go in the other direction as well.
Figure 3: Check Your Data Format (Step 2)
Click “Next.”
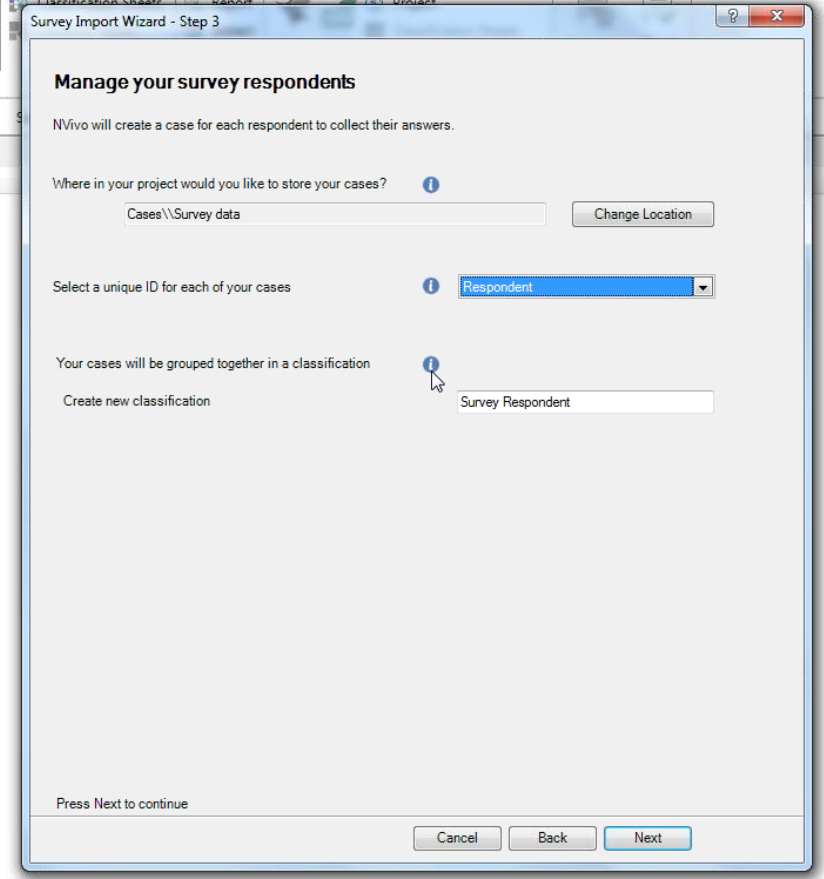
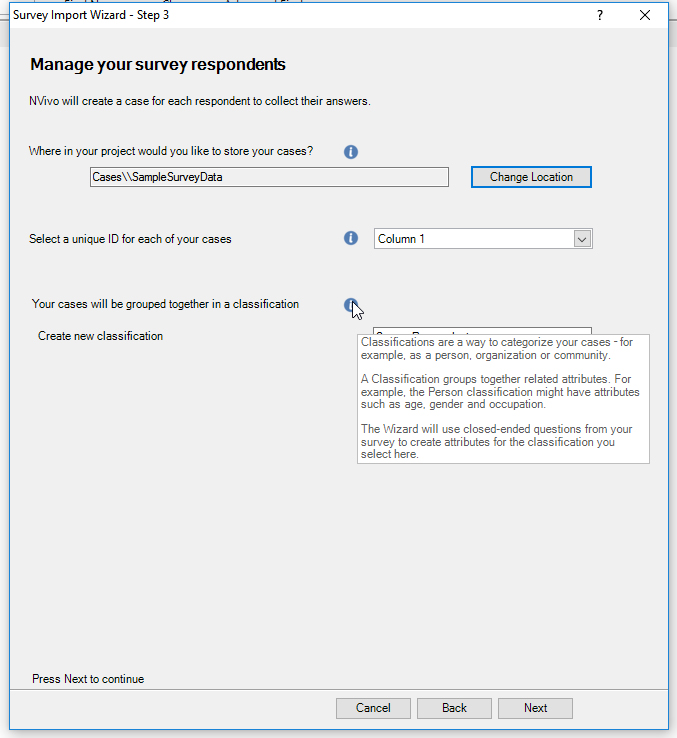
In Step 3, users may “Manage your survey respondents.”
Figure 4: Manage Your Survey Respondents (Step 3)
Case nodes are placed in the Nodes -> Cases section. Users may change the locations.
Also, they may indicate the column with the unique identifiers. This is usually in the first column. (If respondents have to be de-identified, this should be done to the data before ingesting into NVivo 11 Plus on Windows.)
Also, they may choose to classify these cases as of a certain type.
For more information there is an “information” button which may be hovered over for more details. This button is indicated by a white lower-case “i” over a round blue button. (If the hovering doesn’t work, click into the window (anywhere) to activate it, and the hovering brings the support text right up.)
Figure 5: Information Button in the Survey Import Wizard
Click “Next.”
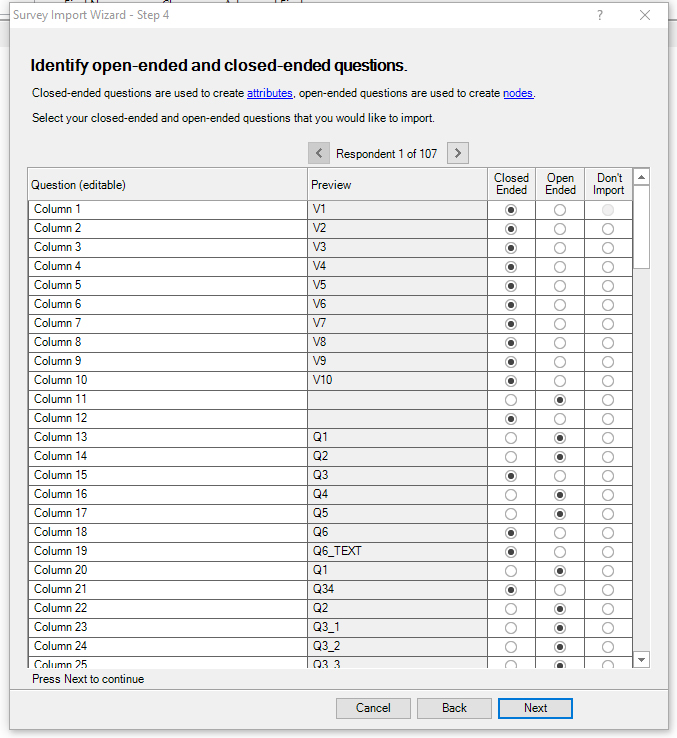
The “Identify open-ended and close-ended questions” window opens (Step 4).
Figure 6: Identifying Open- and Close-Ended Questions (Step 4)
The respective columns are already pre-labeled, but it will be important to verify whether the data fields are open- or close-ended. Open-ended data fields are codable and will be coded to nodes; the text, numbers, and other data in the cells may be highlighted and coded to additional nodes. Close-ended data columns are treated as deterministic attributes (or categorical data) and are not codable.
Click “Next.”
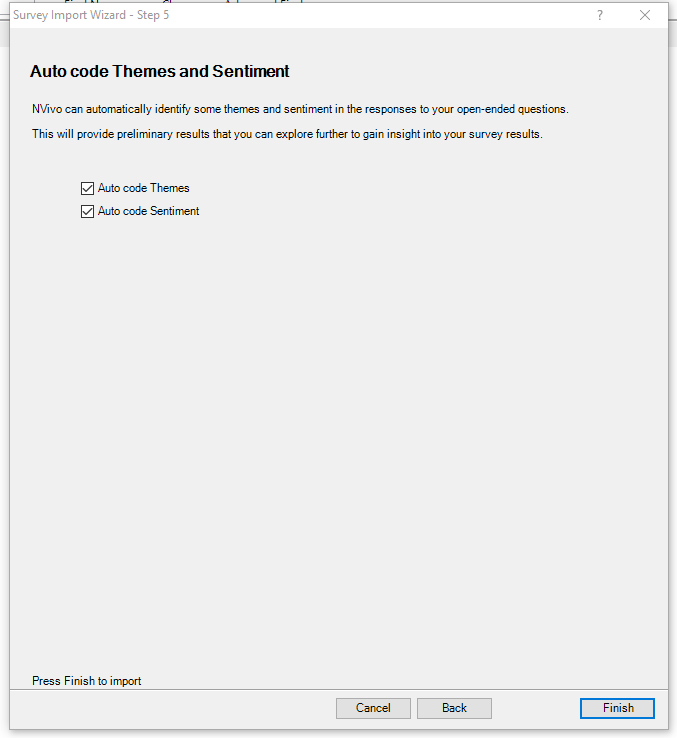
Figure 7: Auto code Themes and Sentiment (Step 5)
Here, the user may decide to apply the new NVivo 11 Plus autocoding capabilities for automatically extracting themes and sub-themes (topic-modeling) and for identifying sentiment (identifying sentiment-bearing text into four categories: very negative, moderately negative, moderately positive, and very positive).
Click “Finish.”
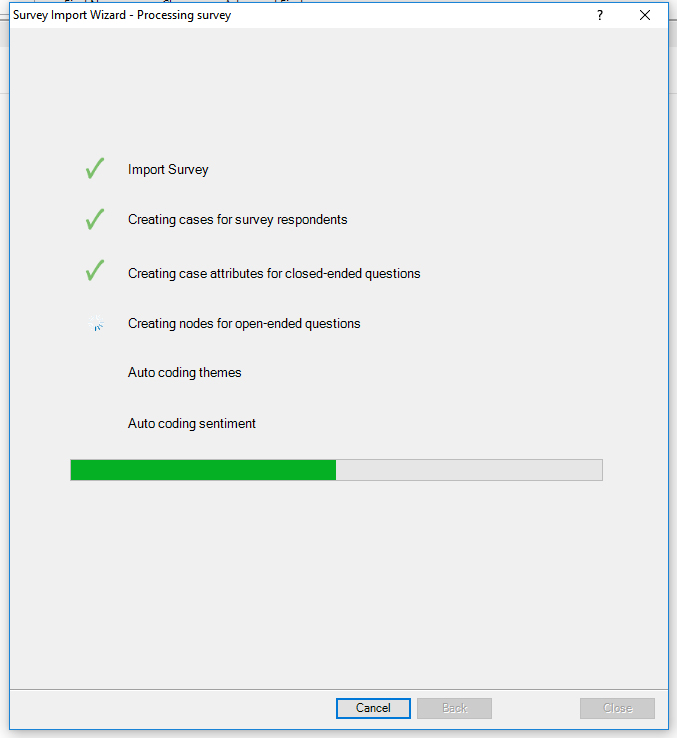
A window shows the progress as NVivo achieves the respective steps.
Figure 8: Processing Survey
When the progress bar is complete, click “Close” at the bottom right.
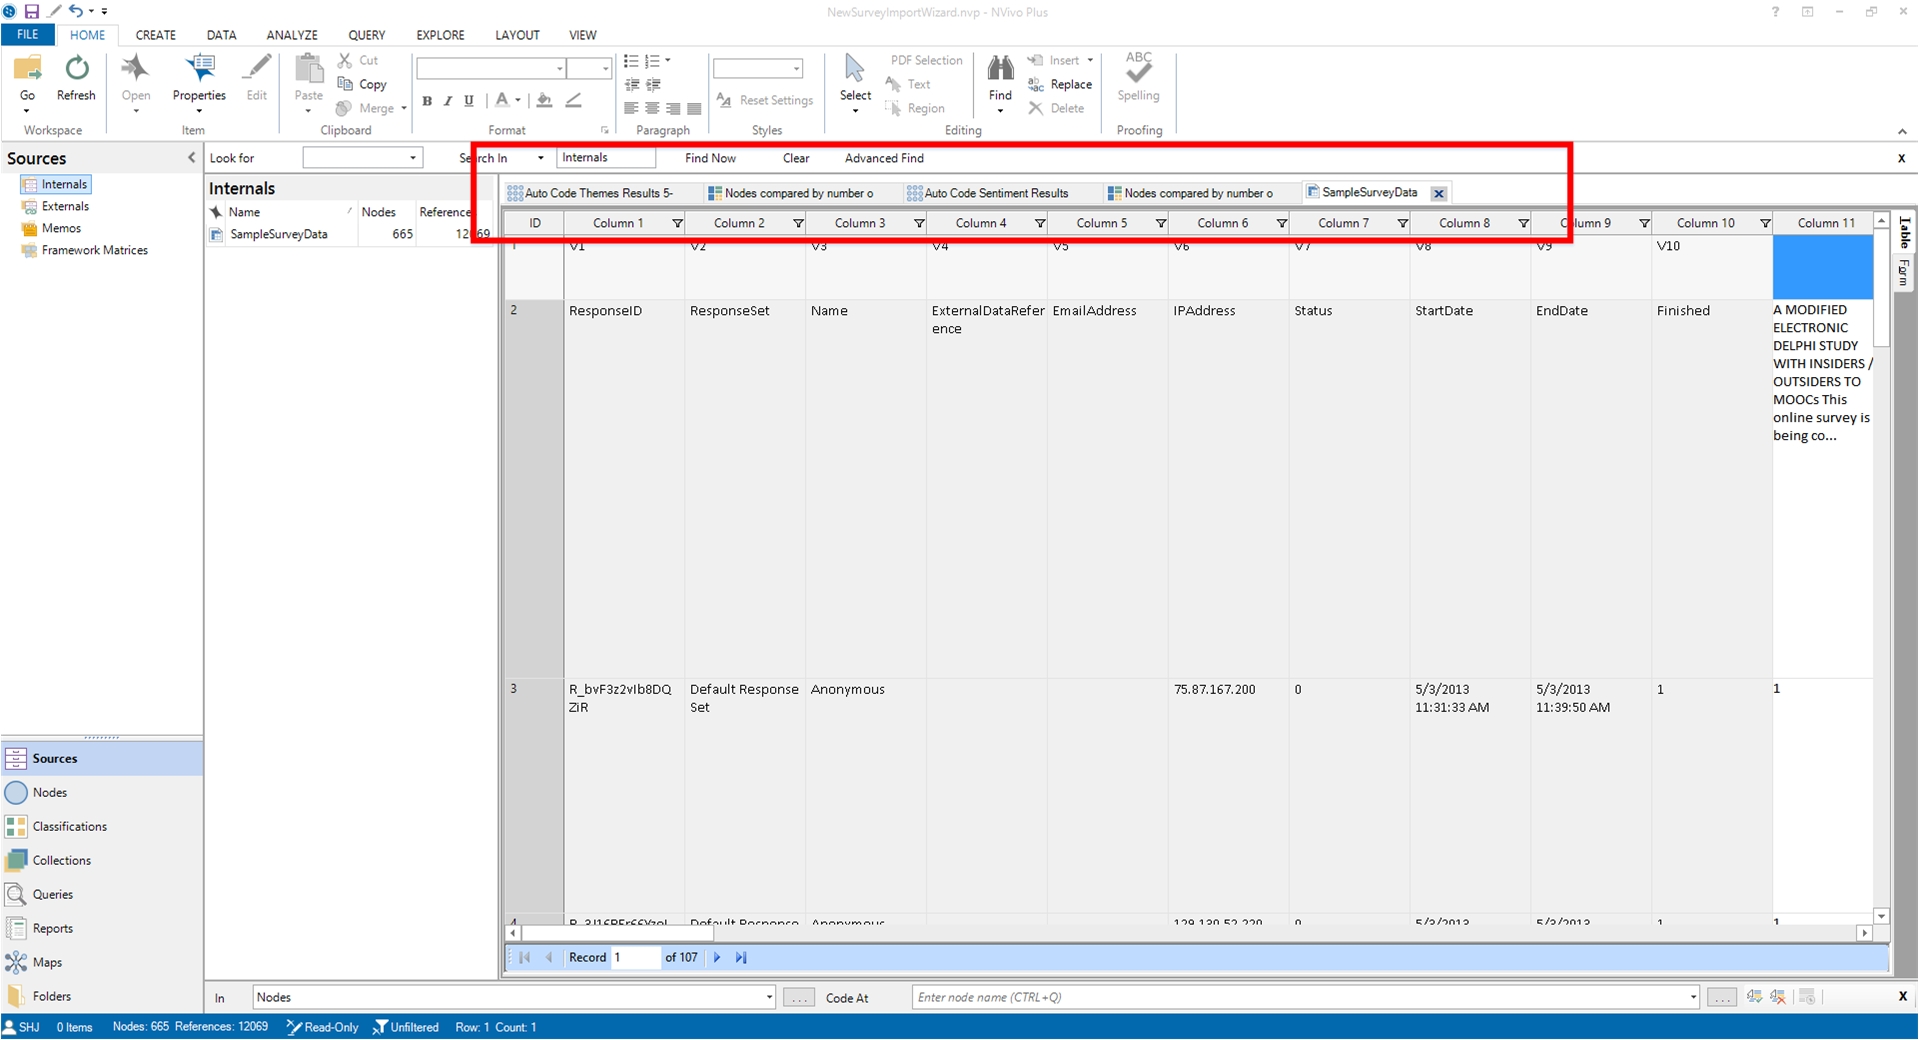
Five tabs have been created in the Detail View: a mix of autocoded themes, sentiments, and data visualizations.
Figure 9: Five Tabs with Processed Survey Data
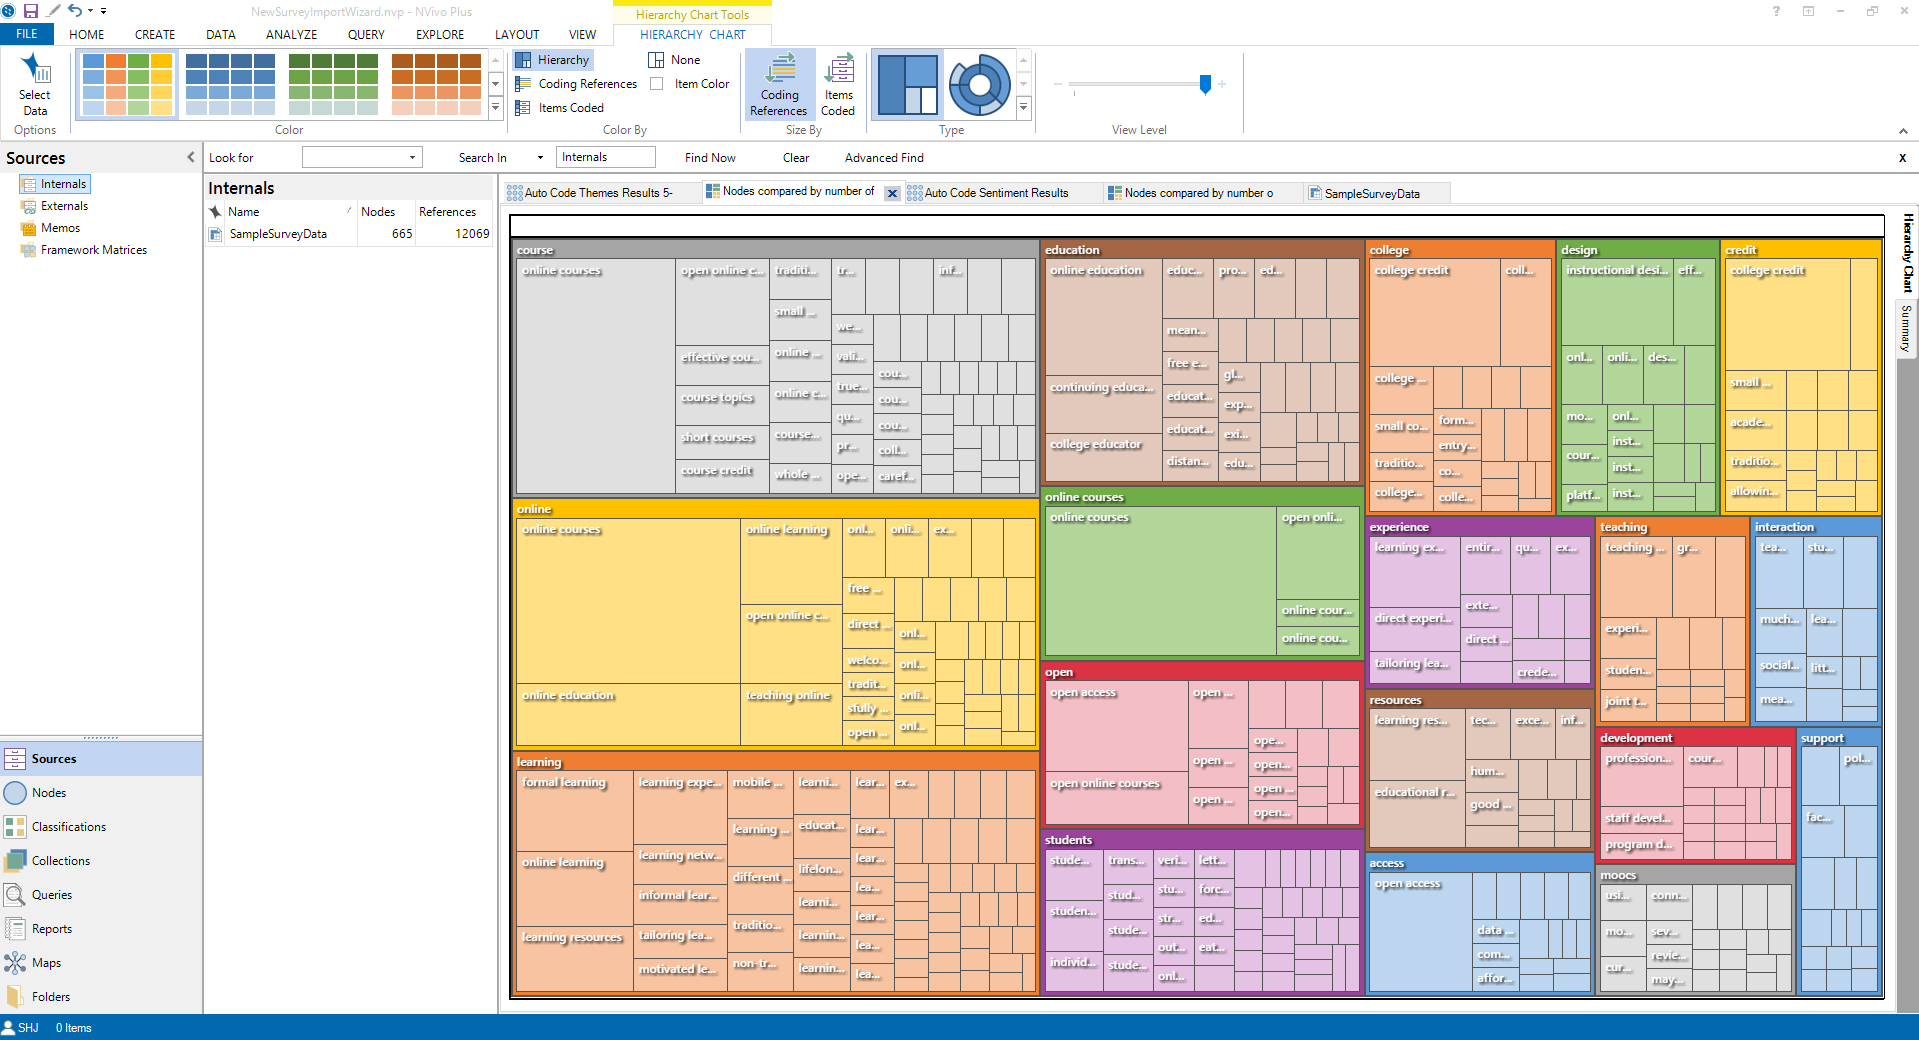
Extracted themes (and subthemes) from the survey may be viewed in a hierarchical treemap diagram.
Figure 10: A Treemap Diagram of Extracted Themes and Subthemes from the Survey Data
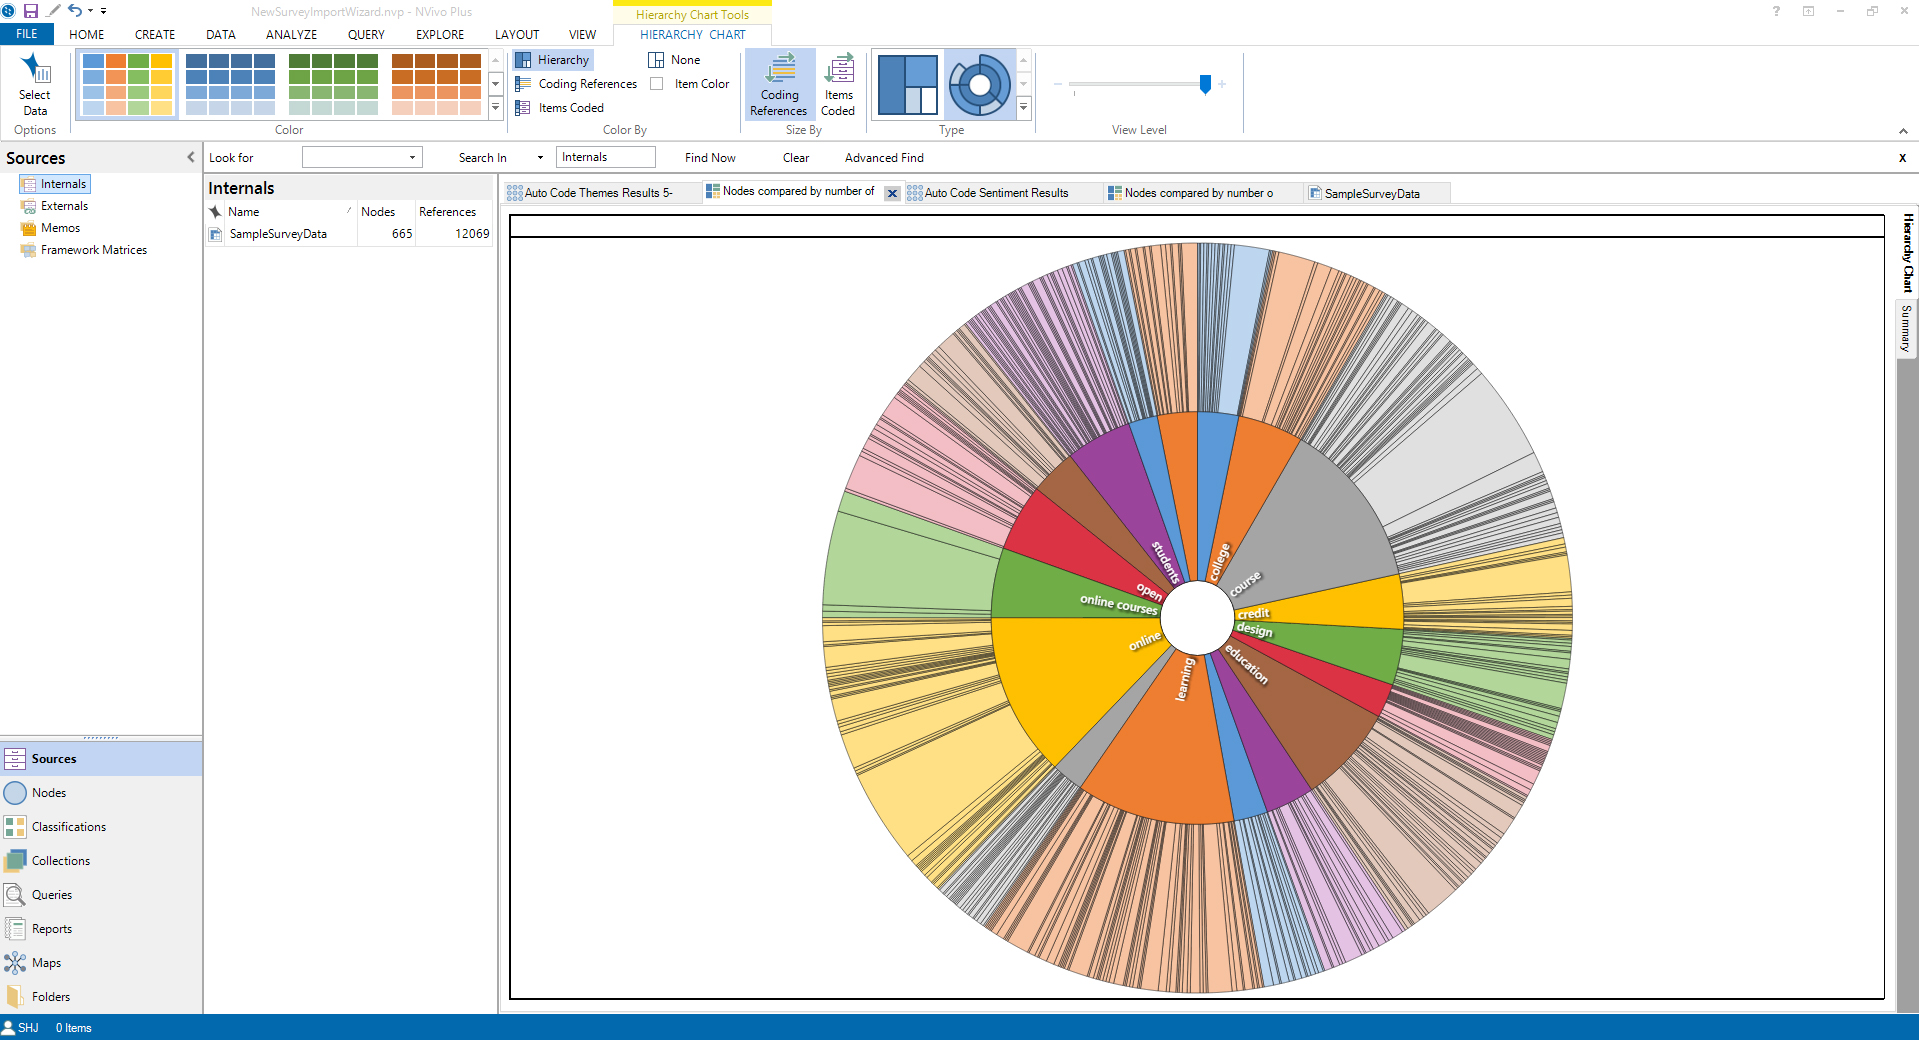
The same survey data may be viewed as an interactive sunburst.
Figure 11: A Sunburst Diagram of Extracted Themes and Subthemes from the Survey Data
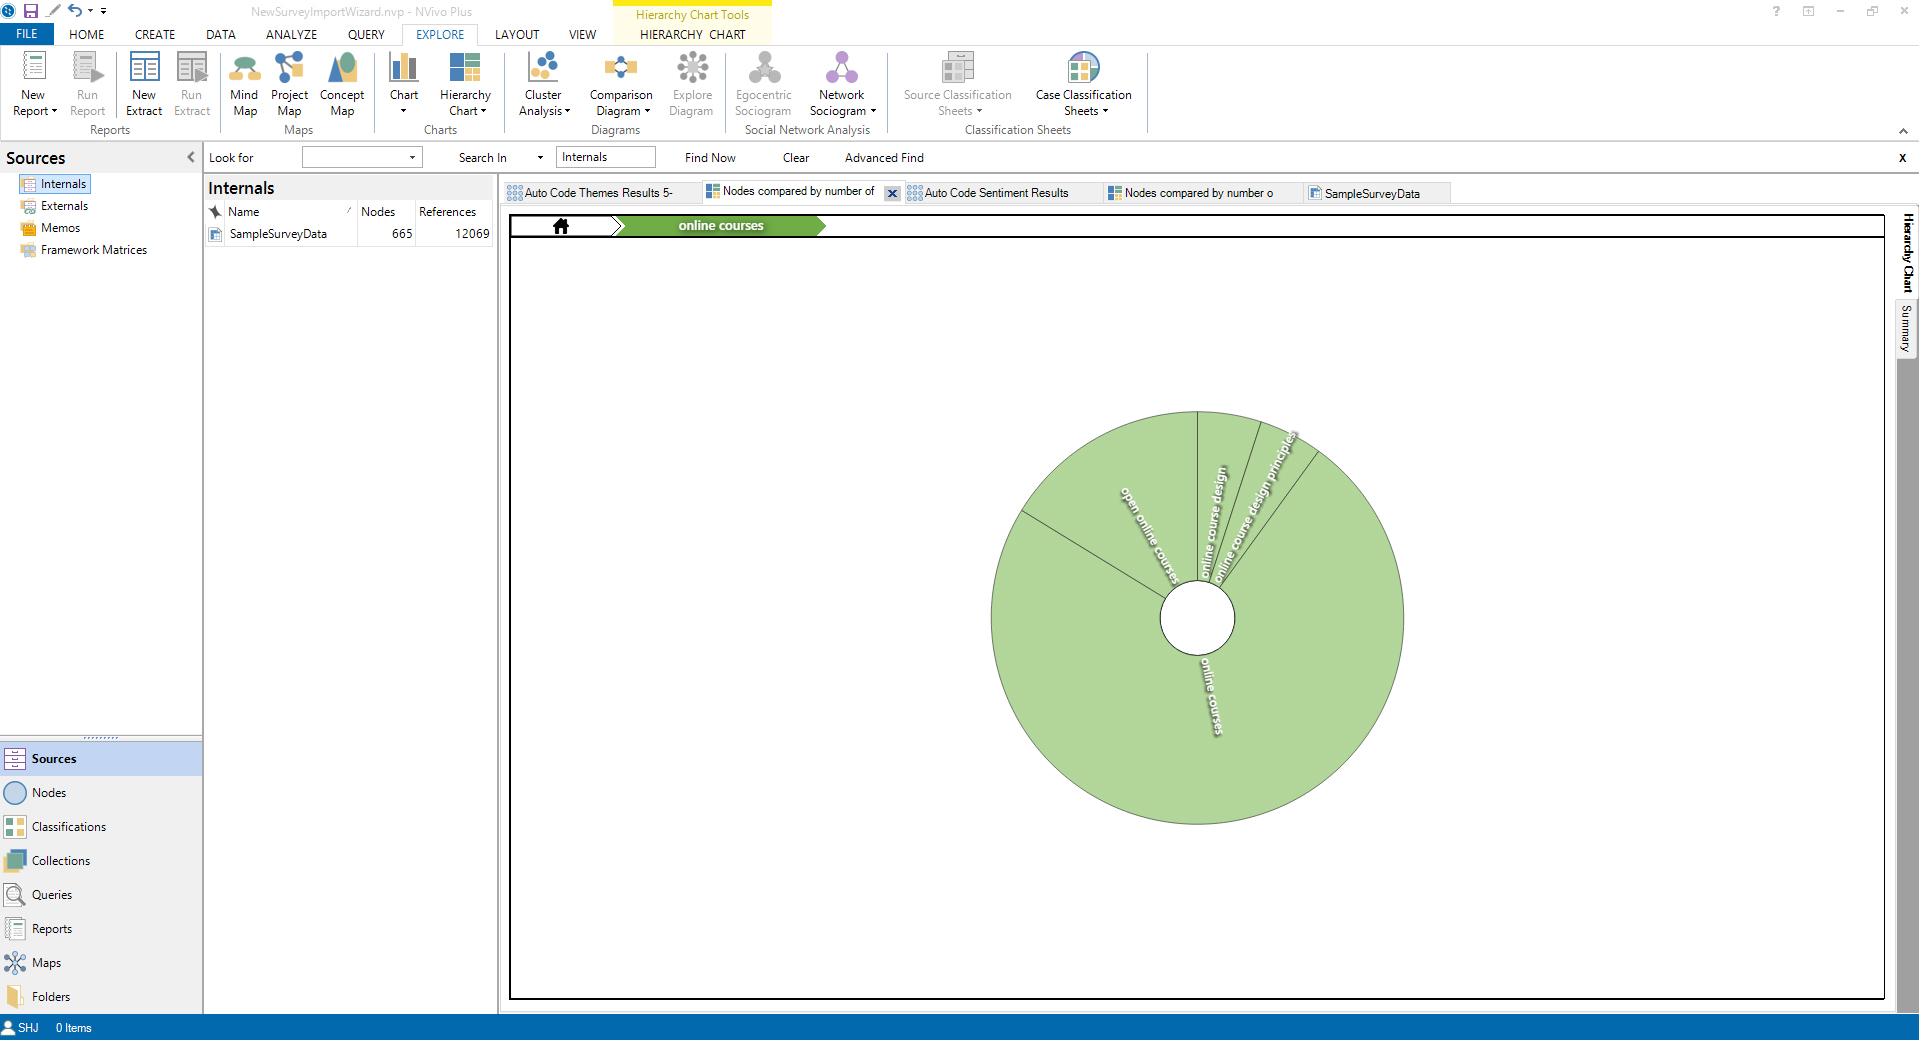
(All the data visualizations are interactive, and the coded textual data may be reached by double-clicking on the areas of interest.) For example, “online courses” was selected, and the subthemes may be seen in a sub-sunburst.
Figure 12: “Online Courses” Theme Extraction and its Subthemes as a Sub-Sunburst
There is also an intensity matrix of sentiments in the four sentiment categories: very negative, moderately negative, moderately positive, and very positive.
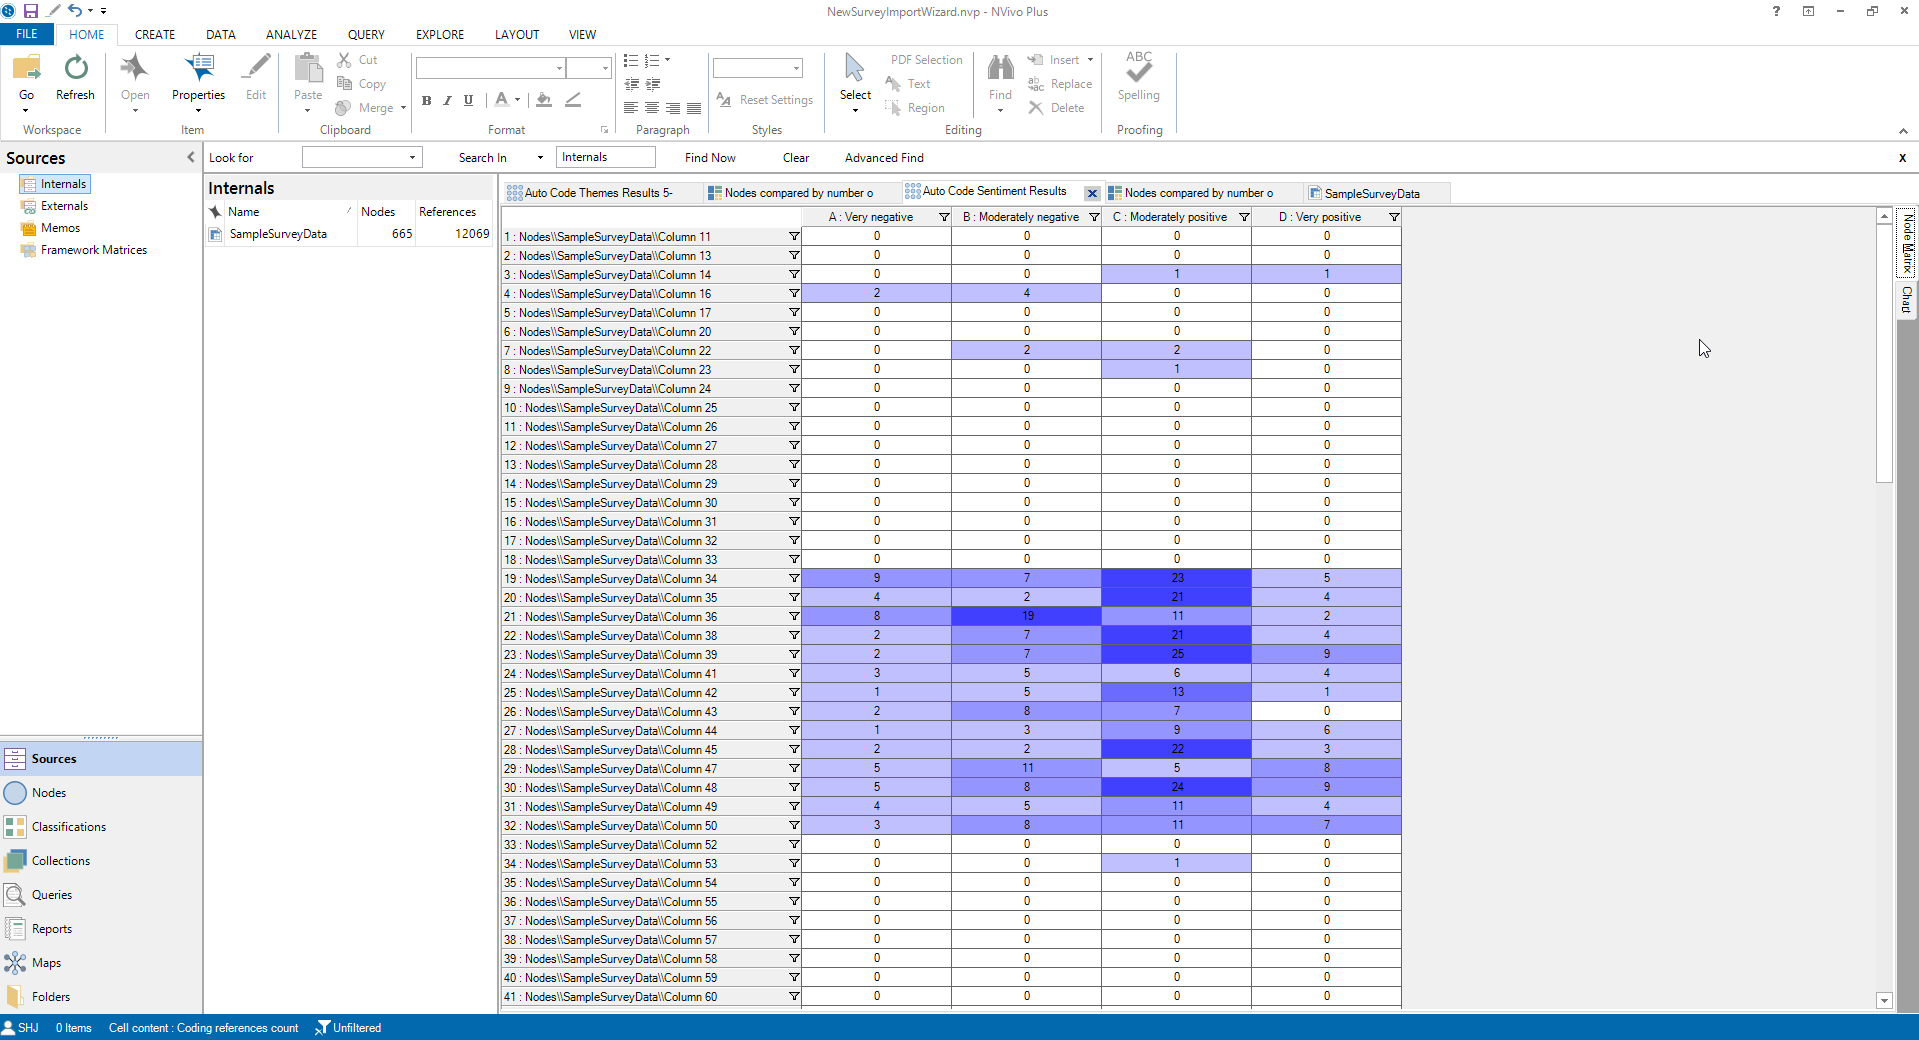
Figure 13: An Intensity Matrix of Sentiments in the Four Sentiment Categories
The same sentiment data may be represented as hierarchy charts, namely a treemap diagram or a sunburst diagram.
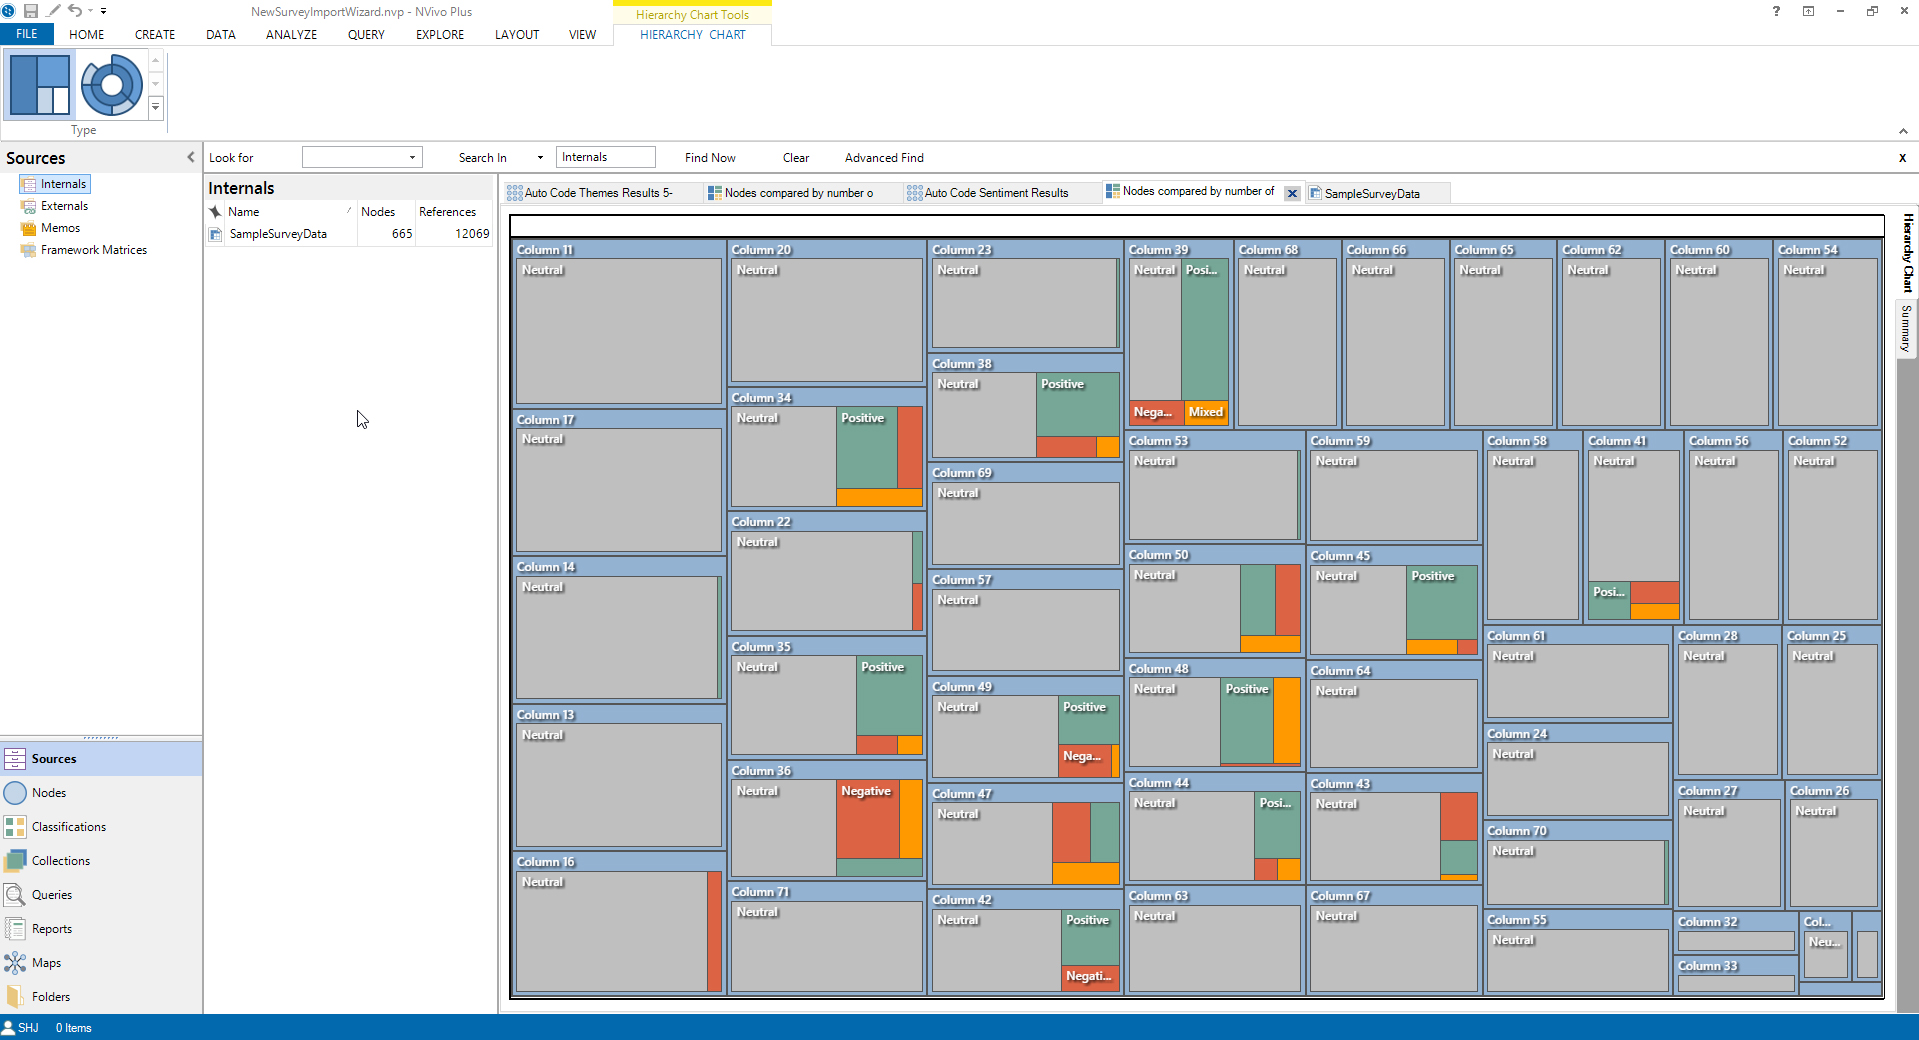
Figure 14: A Treemap Diagram of the Four Sentiment Categories per Record and the Neutral Category
All these prior visualizations were auto created as part of the process of the New Survey Import Wizard. This wizard enables autocoding (collecting certain data and putting them into nodes) in order to enable researchers to start their analyses faster. There are also the autocoding features for theme and subtheme extraction and sentiment analysis to provide other types of summary data that may lead to insights.
A range of other visualizations may be created from this data, such as network sociograms, mapped models, and others.
Discussion of "Importing a Survey into NVivo Using a Microsoft Excel File"
Add your voice to this discussion.
Checking your signed in status ...