Building and Exporting Reports
Building and Exporting Reports
In NVivo, a researcher can just left-click in the left-menu at the bottom under Reports...and output either a formatted report or a textual report.
Reports may be ingested as a data source from other projects in NVivo.
They are in near-printable format as well.
##
[Below, this information is somewhat dated. There are more ways to create reports now more efficiently than having to go to reports.]
A report is a file containing select contents from an NVivo project...in a pre-structured format. Reports offer a portable way to move data from a project to view externally and in a different format. Reports--whether fully auto-generated or human-generated--provide a way for researchers to share their work with others—in a preliminary way or even in a finalized way.
Different file types. A report may be output in a range of file types: ASCII text (.txt), Rich Text Format (.rtf), portable document format (PDF), Excel Workbook (.xlsx or .xls), and a web page (.htm or .html). Reports may be exported in any number of editable file types and revised there for even more presentable formats than the few built-in report styles in NVivo.
Building a Report
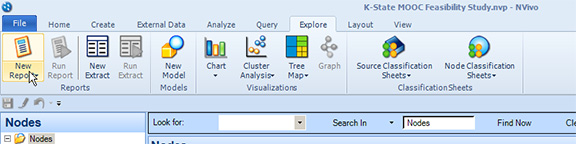
To begin the report building process, go to the “Explore” tab in the NVivo ribbon. Select the “New Report” button at the far left.
There is a choice between “New Report via Wizard” or “New Report via Designer.” The first choice offers a more supported step-by-step approach to building a report. The latter is for those who have already been through the report building process a few times and is comfortable focusing more on issues of report style. This page will introduce the Wizard one first and then the Design one second.
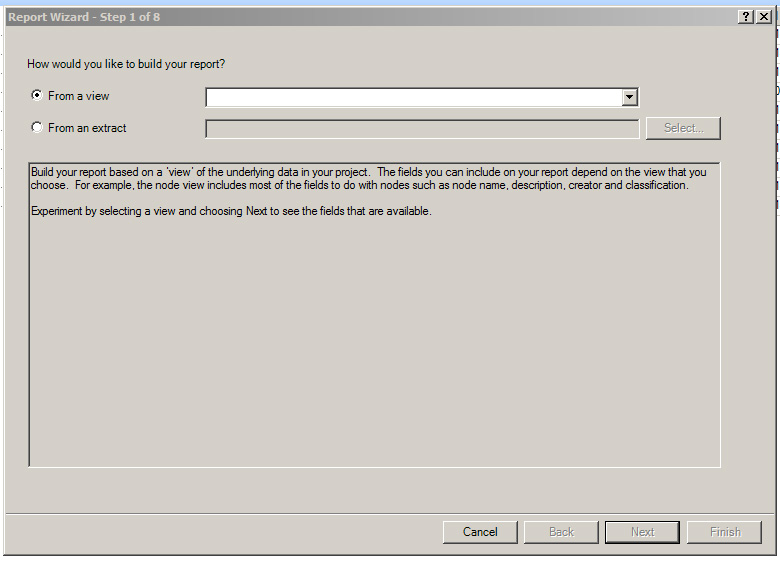
Clicking on “New Report via Wizard” brings up the Report Wizard window, in the first of eight steps.
At this first window, a researcher may build a report based on a “View” or from an “Extract.” “From a View” enables a dropdown menu from which various contents may be extracted: Node Classification, Node, Project Item, Source Classification, or Source. “From an Extract”
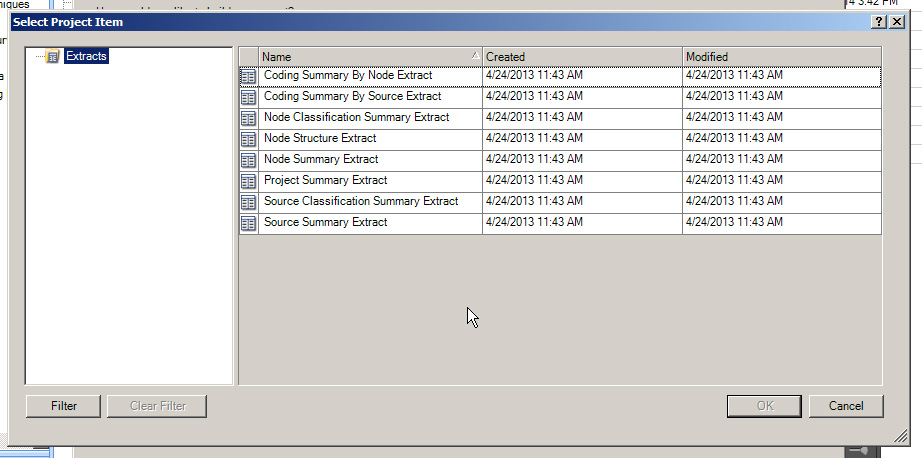
An “extract” defines criteria from the project, including the following: Coding Summary by Node Extract, Coding Summary by Source Extract, Node Classification Summary Extract, Node Structure Extract, Node Summary Extract, Project Summary Extract, Source Classification Summary Extract, and Source Summary Extract.
This book will first show “From a View” and then one “From an Extract.”
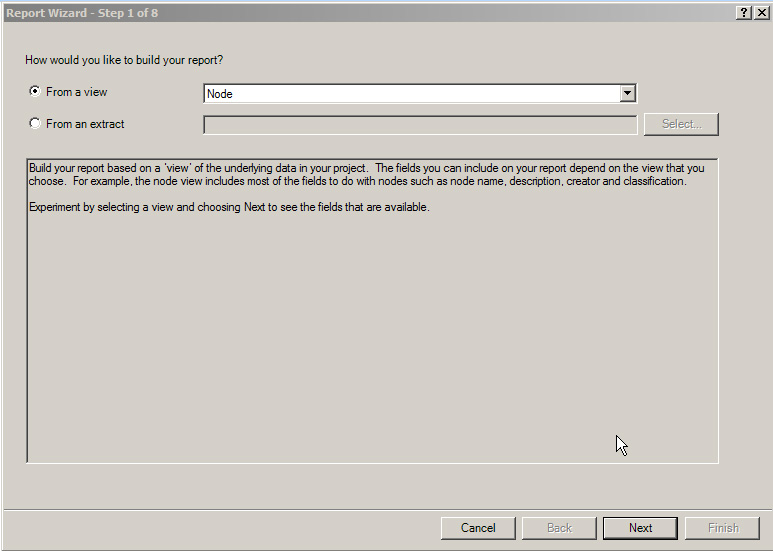
For this extraction, this will show “From a view” and “Node.”
Click “Next.”
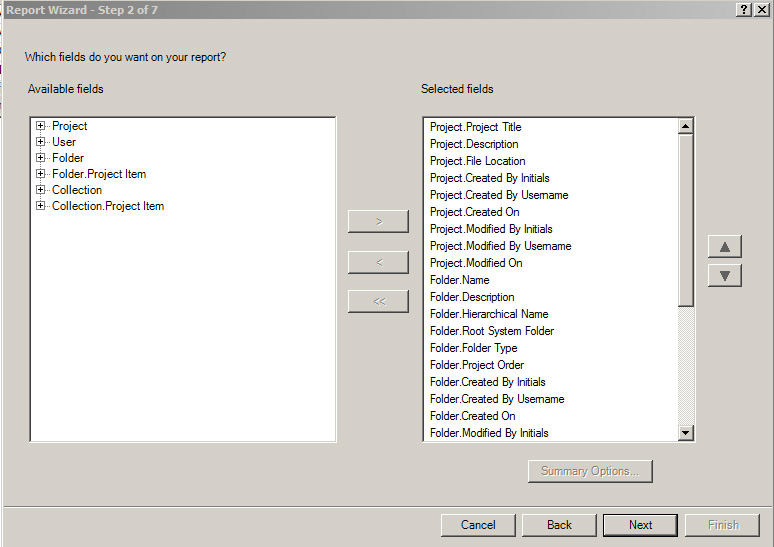
Step 2 of 8 in the Wizard shows a selection of available fields based on Nodes. To make the selection on this graphical user interface builder, click the plus signs to reveal the subnodes. Click the desired elements and click the right > arrow button to move the elements to the right.
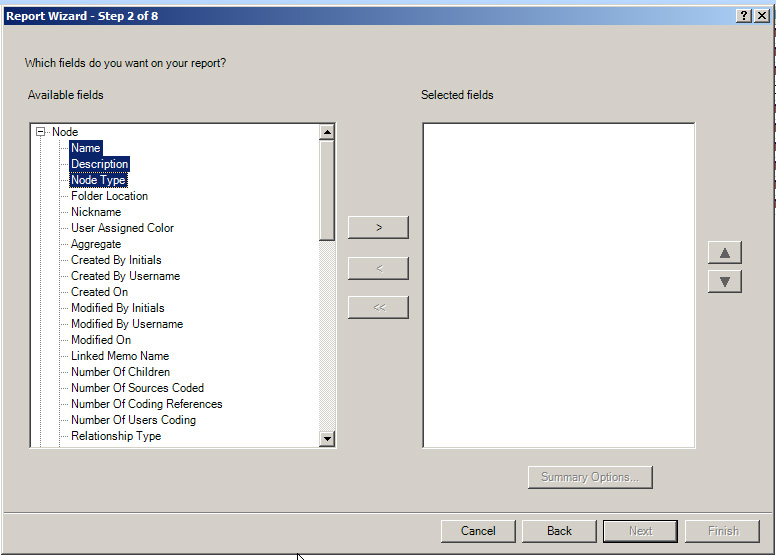
Click the plus signs again to minimize the drop-down and select the other items as desired.
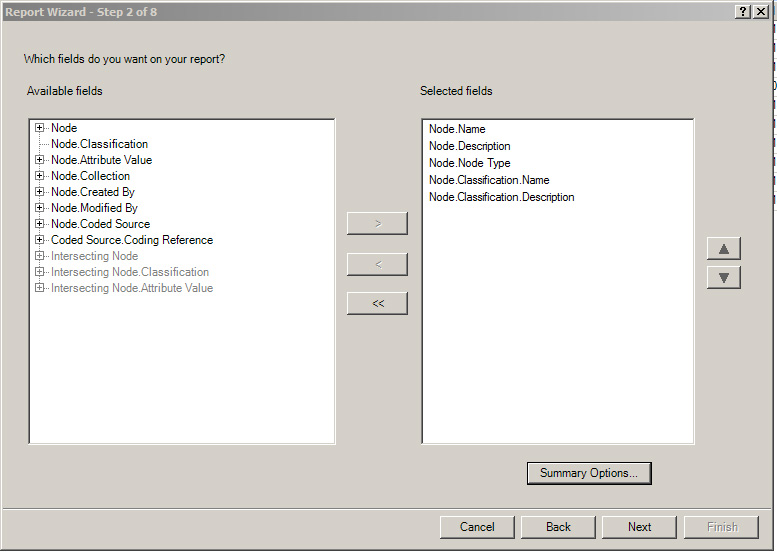
If the data is numerical, a researcher may want to click the Summary Options button under the right column.
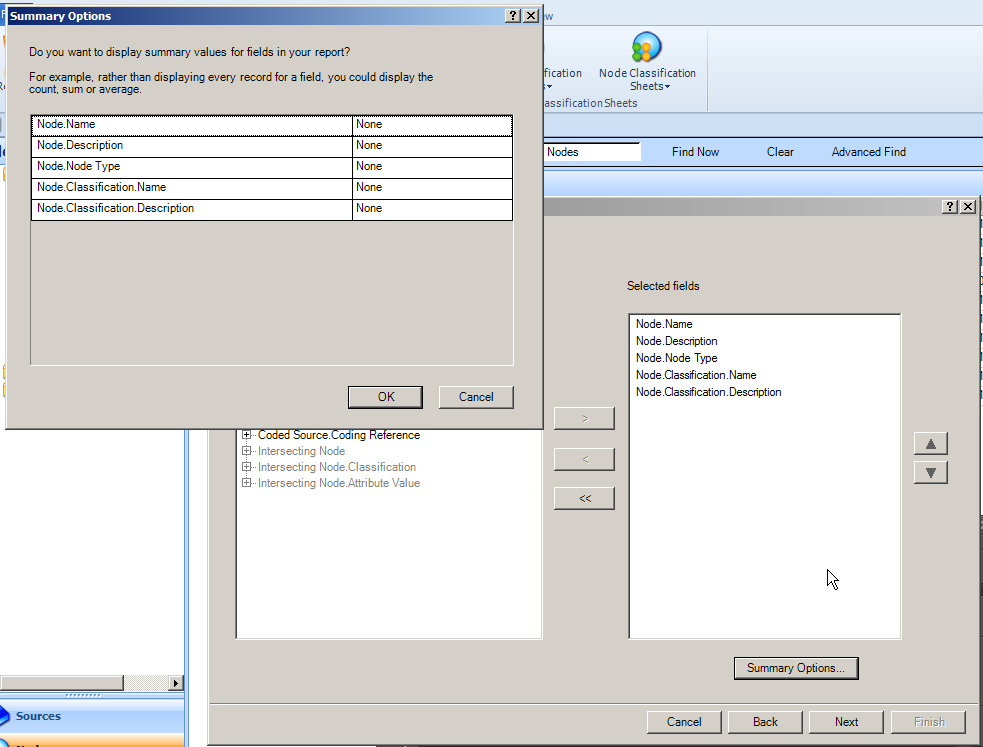
The Summary Options button enables the displaying of summary values for the selected fields of the report. This version would mean that the report would display counts, sums, or averages, instead of the cumulative individual records. Summary information may be more relevant for an Executive Summary or other sort of summary views.
Click “Next.”
Step 3 asks whether the researcher wants to filter the fields in the report. If there are no fields to filter, then the work area is blank. By clicking “Add” at the bottom left, fields may be added to the window, and the conditions of the filtering may be defined.
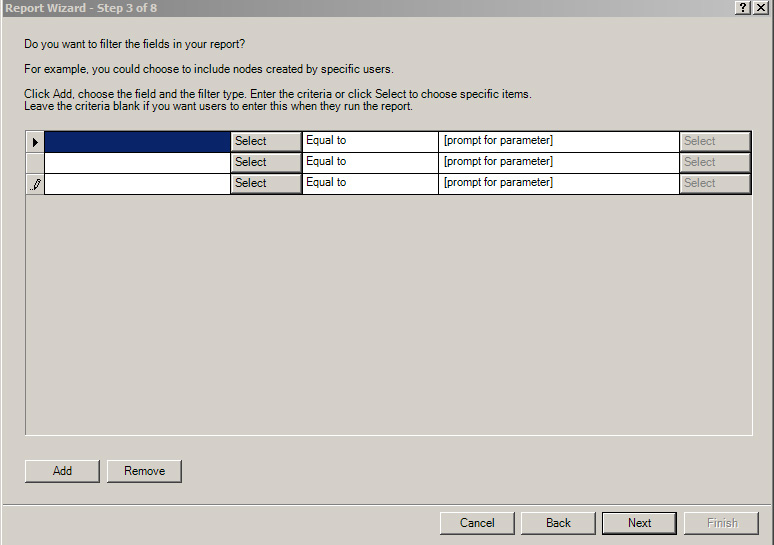
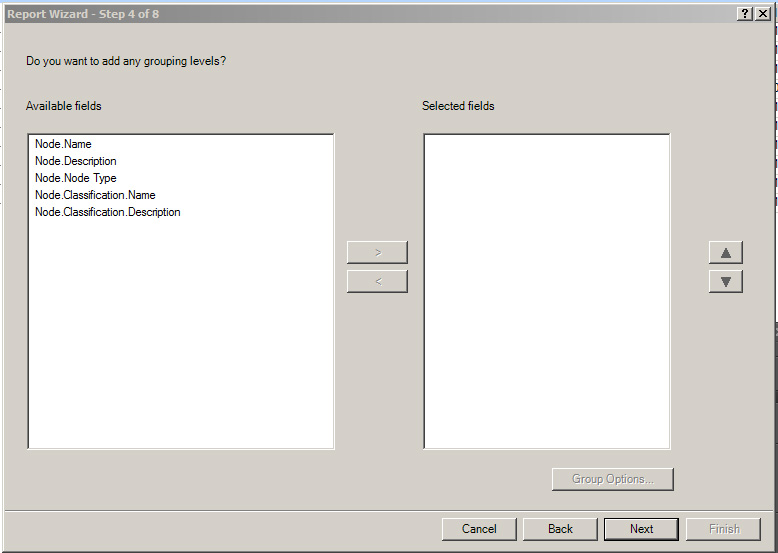
The next step involves defining whether the researcher would like to add grouping levels. This offers another way to combine numerical data. To group contents, move the desired fields to the right window. Those items may be re-arranged based on the up and down arrows to the right of the right column. Click the Group Options button at the bottom right, and define how the grouping should be arranged. For this sequence, this Grouping Levels will be skipped.
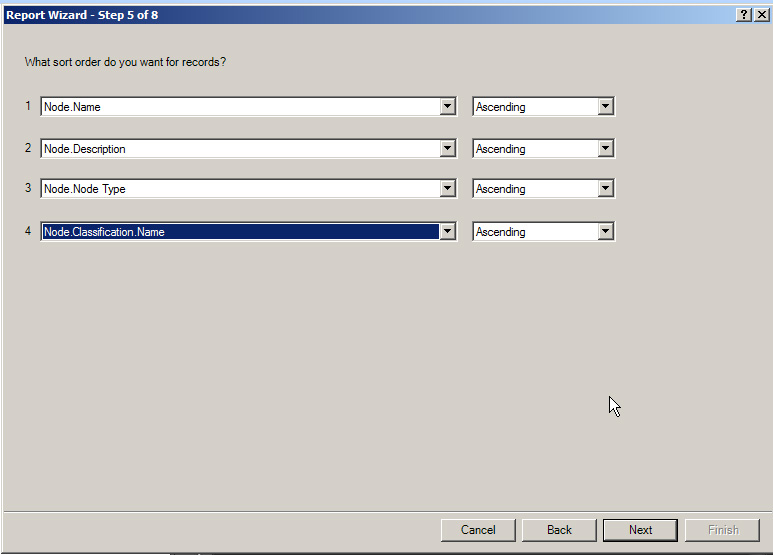
The next screen enables researchers to use dropdown menus to order the way the information will be presented in the report. The dropdowns that are labeled enable the placement of the contents. The dropdowns to the right—indicating Ascending or Descending—represent the data within that particular data type. Generally, it is good to keep report parameters in a consistent order, so the ascending will be used for all.
Click “Next.”
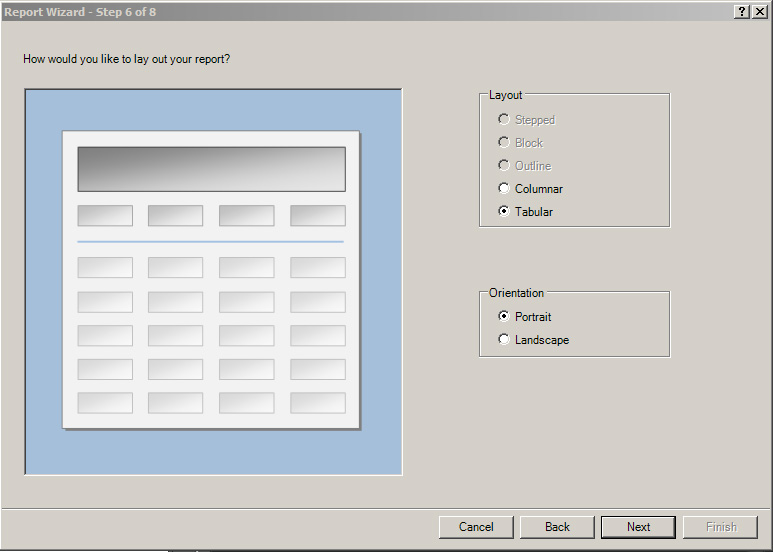
Step 6 of 8 enables the researcher to set the layout of the report as either columnar or tabular. The layout orientation may be either portrait or landscape.
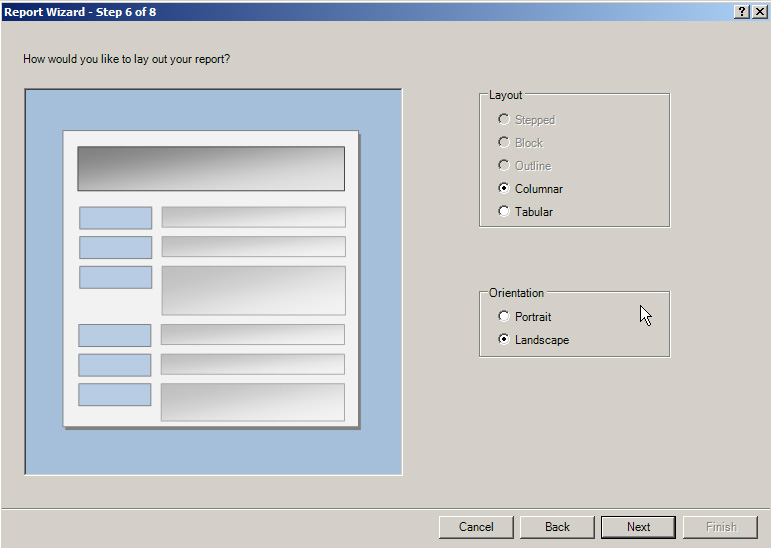
The columnar is set up to go with the landscape. Any grayed-out options are not relevant to the type of data being extracted to a report.
For this context, the tabular and portrait version is used.
Click “Next.”
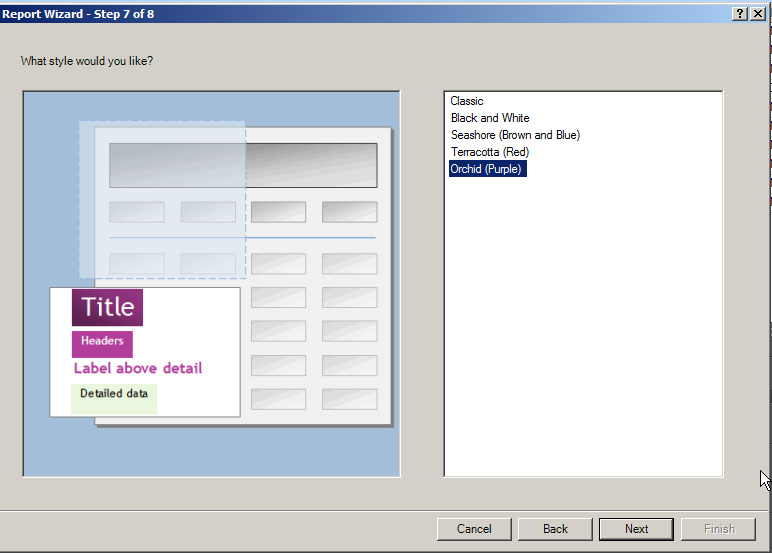
NVivo offers some basic “styles” for the look-and-feel of the report. There is the Classic, Black and White, Seashore (Brown and Blue), Terracotta (Red), and Orchid (Purple). Clicking on each of the text selections will change the visualization to the left, which may give a sense of the look-and-feel.
In this case, “Terracotta (Red)” was selected.
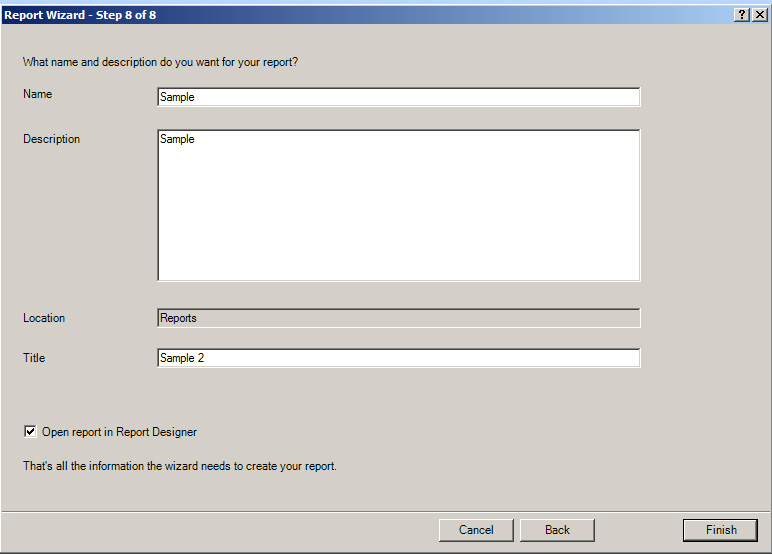
The final step enables the researcher to name the report, provide a description. There is a box which may be checked to open the report in the Report Designer. If there is any question about the look-and-feel of the report, it’s a good idea to open this in the Report Designer because that allows another chance to change up the design features. Click “Finish.”
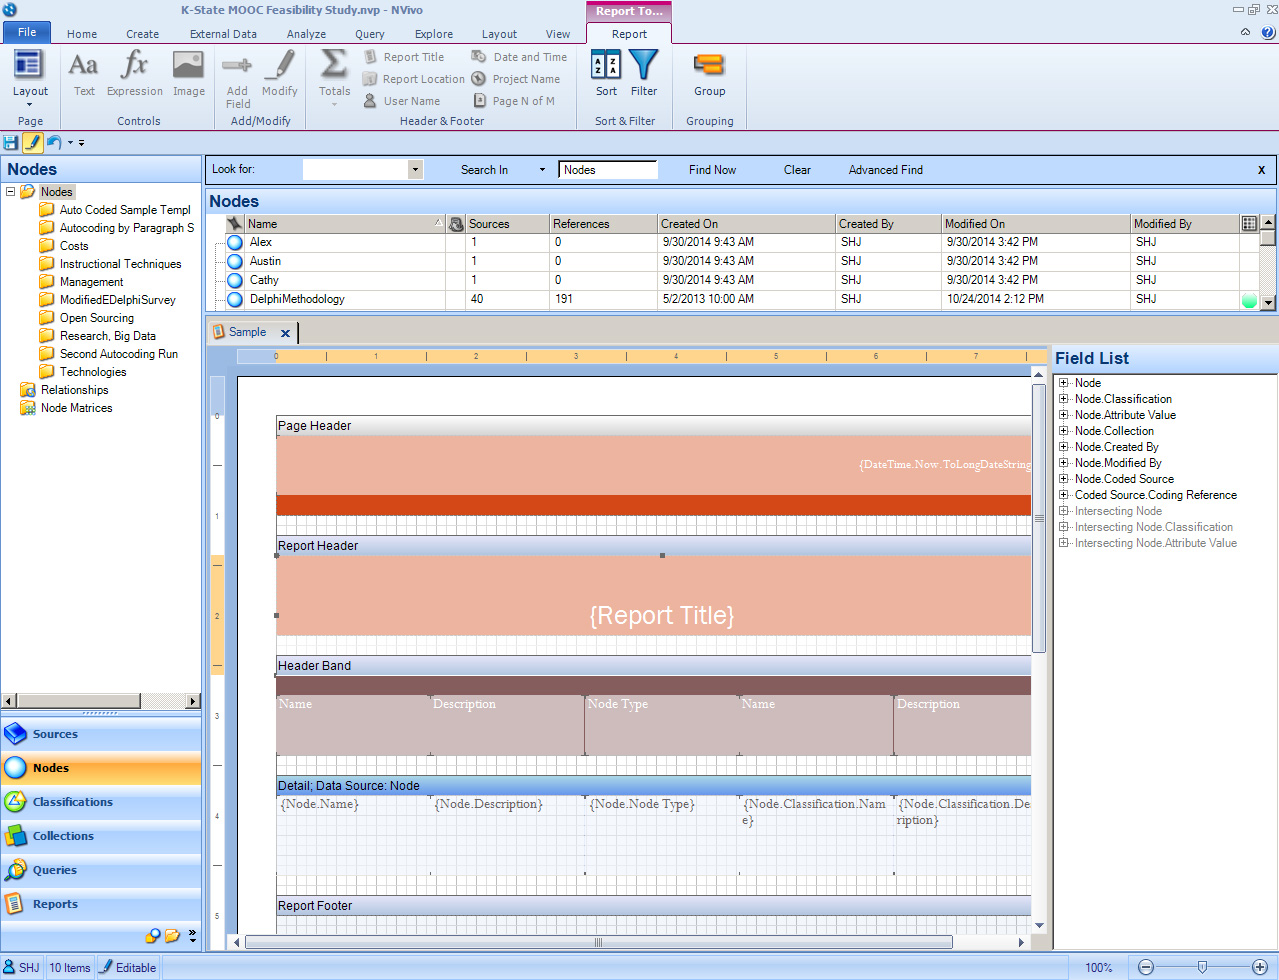
The general template for the report may be seen.
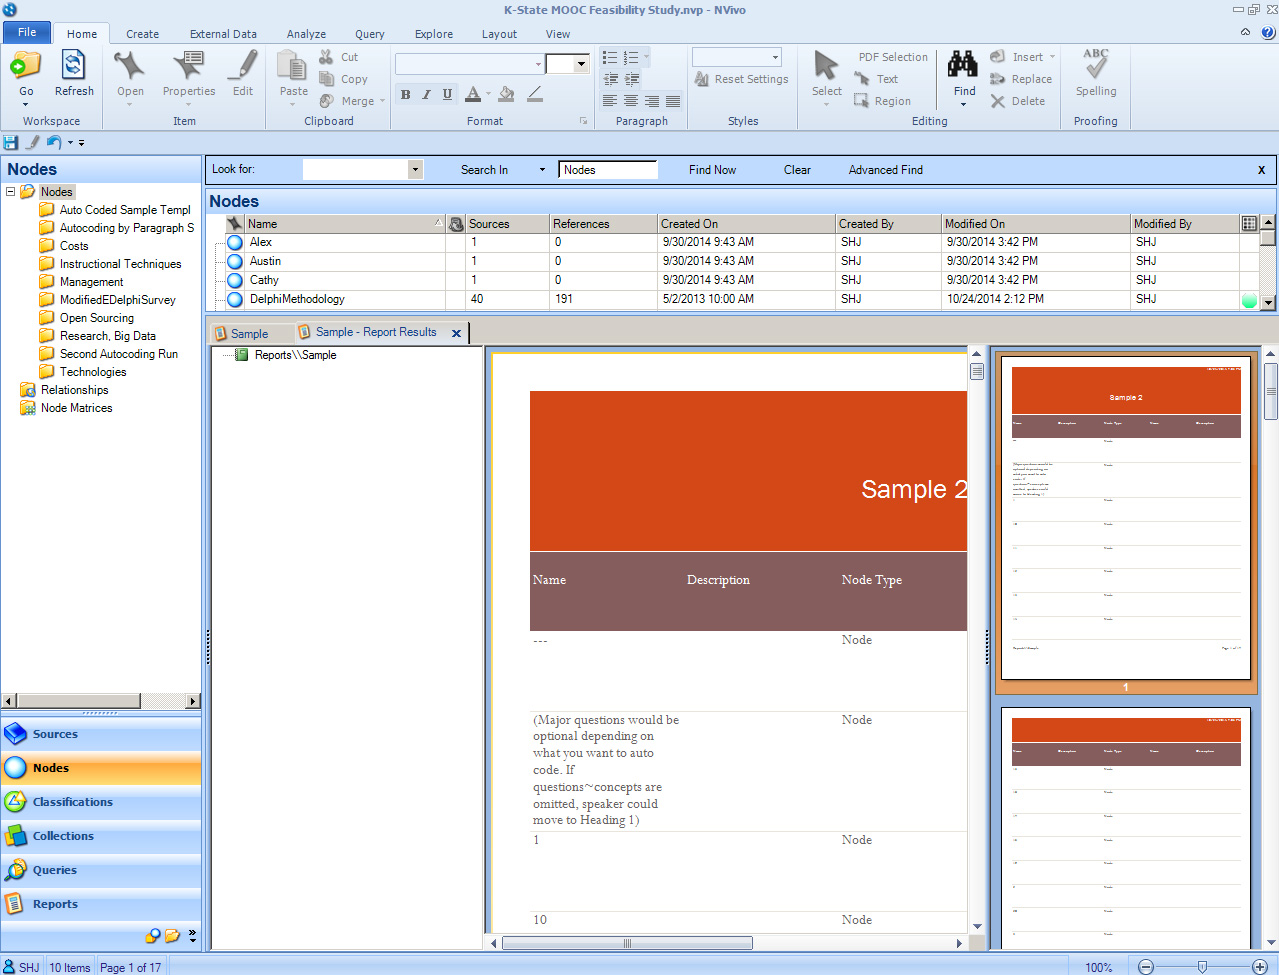
Right-click on the report template, and in the dropdown, click “Run Report.”
If it all looks right (and we’ll assume it does), right click on the run report and Export Report Results. Or, a researcher may print.
The most editable formats is the .docx version (if the researcher wants to keep some of the visual touches). Exporting in .txt or .rtf will lose some of the formatting. A Portable Document File will be fairly fixed and uneditable. The Excel formats will result in an Excel workbook.
From an Extract
This next section provides a very quick view of what creating a report from an extract might look like.
Explore - > New Report -> New Report Via Wizard -> From an Extract
For our purposes, we will select Project Summary Extract.
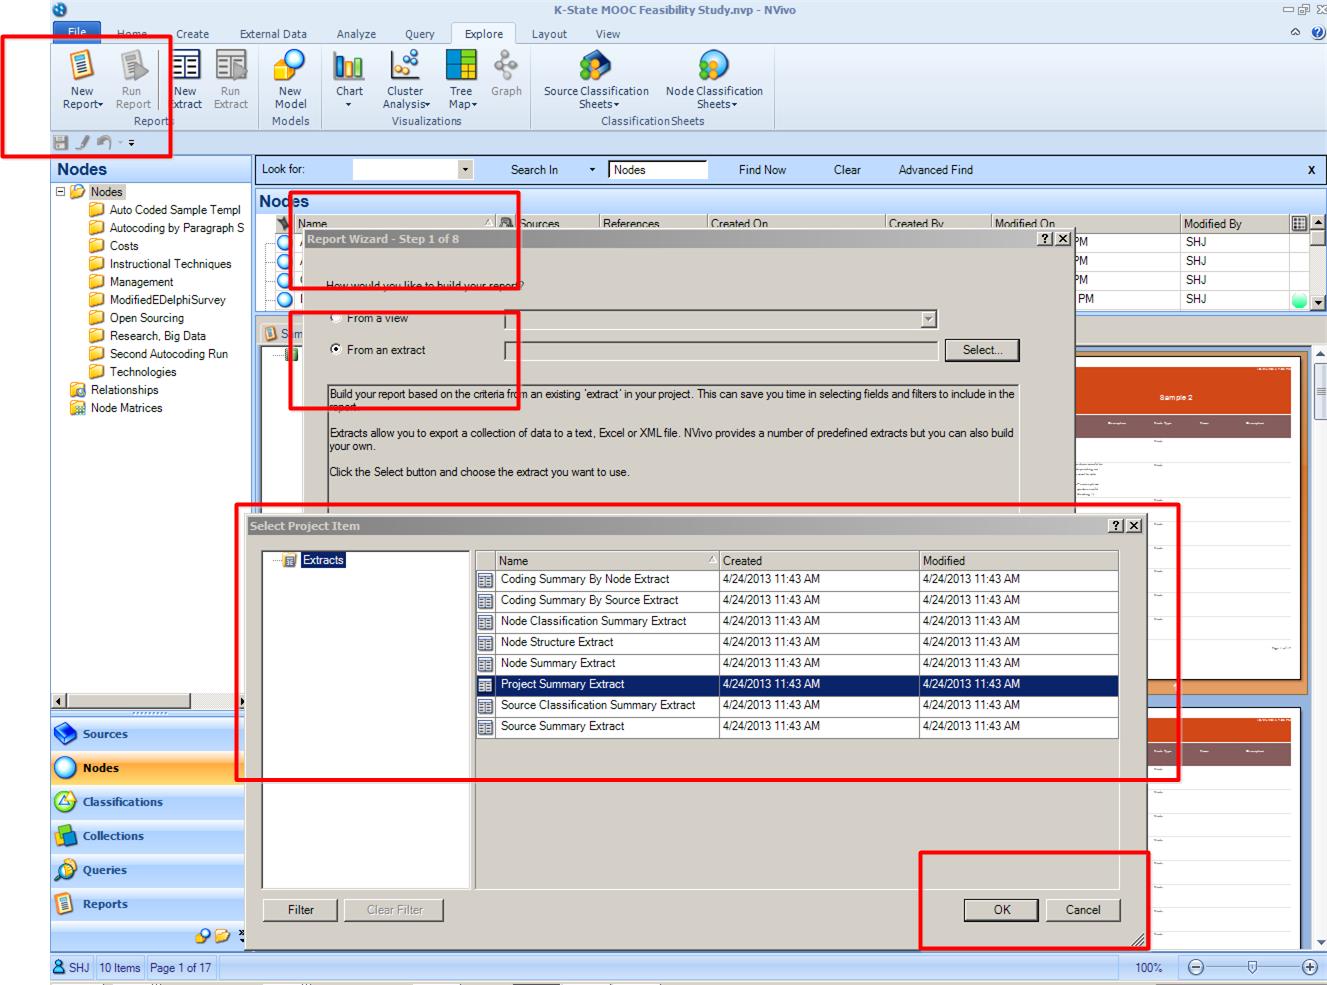
Click “OK.” Click “Next.”
A whole other set of data is extracted out for a potential report.
It is important to experiment with the data to see what is involved in the actual report and what the outputs are. We will leave off this one for now (and forever). The other steps are similar to the report build above.
New Report Via Designer
In terms creating a “New Report via Designer,” go to the Explore tab via the NVivo ribbon. Click “New Report.” Select “New Report via Designer.” A "New Report" window opens.
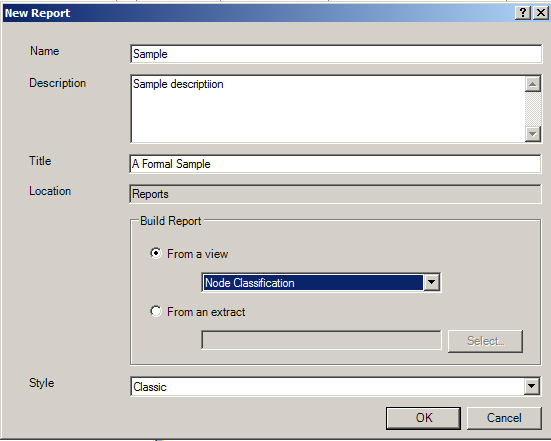
Fill in the blanks. Select the desired style in the dropdown menu at the bottom. Click “OK.”
The next view is the template view of the report. From there, a researcher may run the report and export it. This is a more expedited approach to creating a report for export.
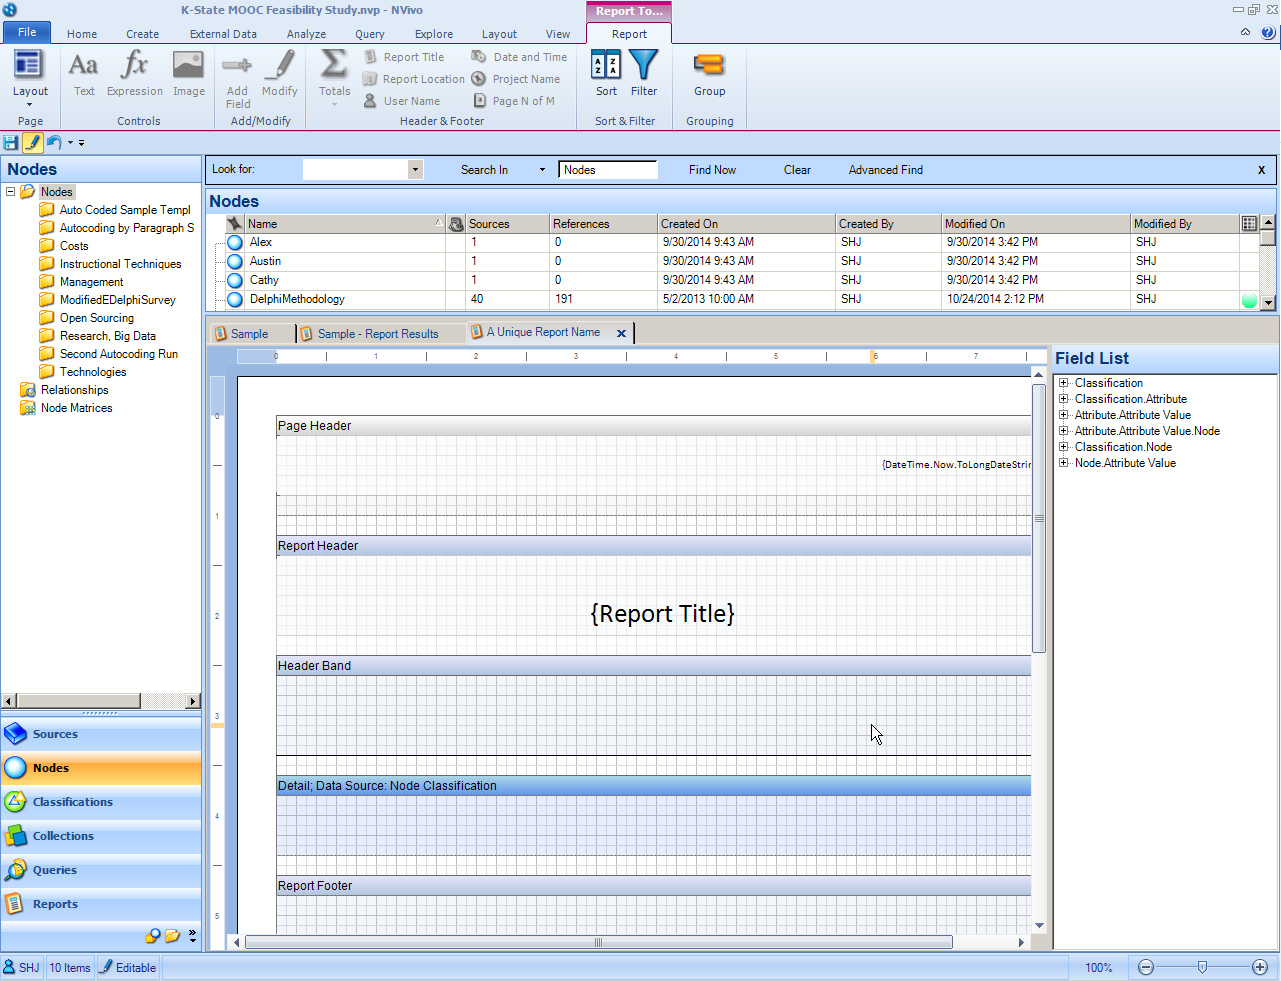
Accessing Reports
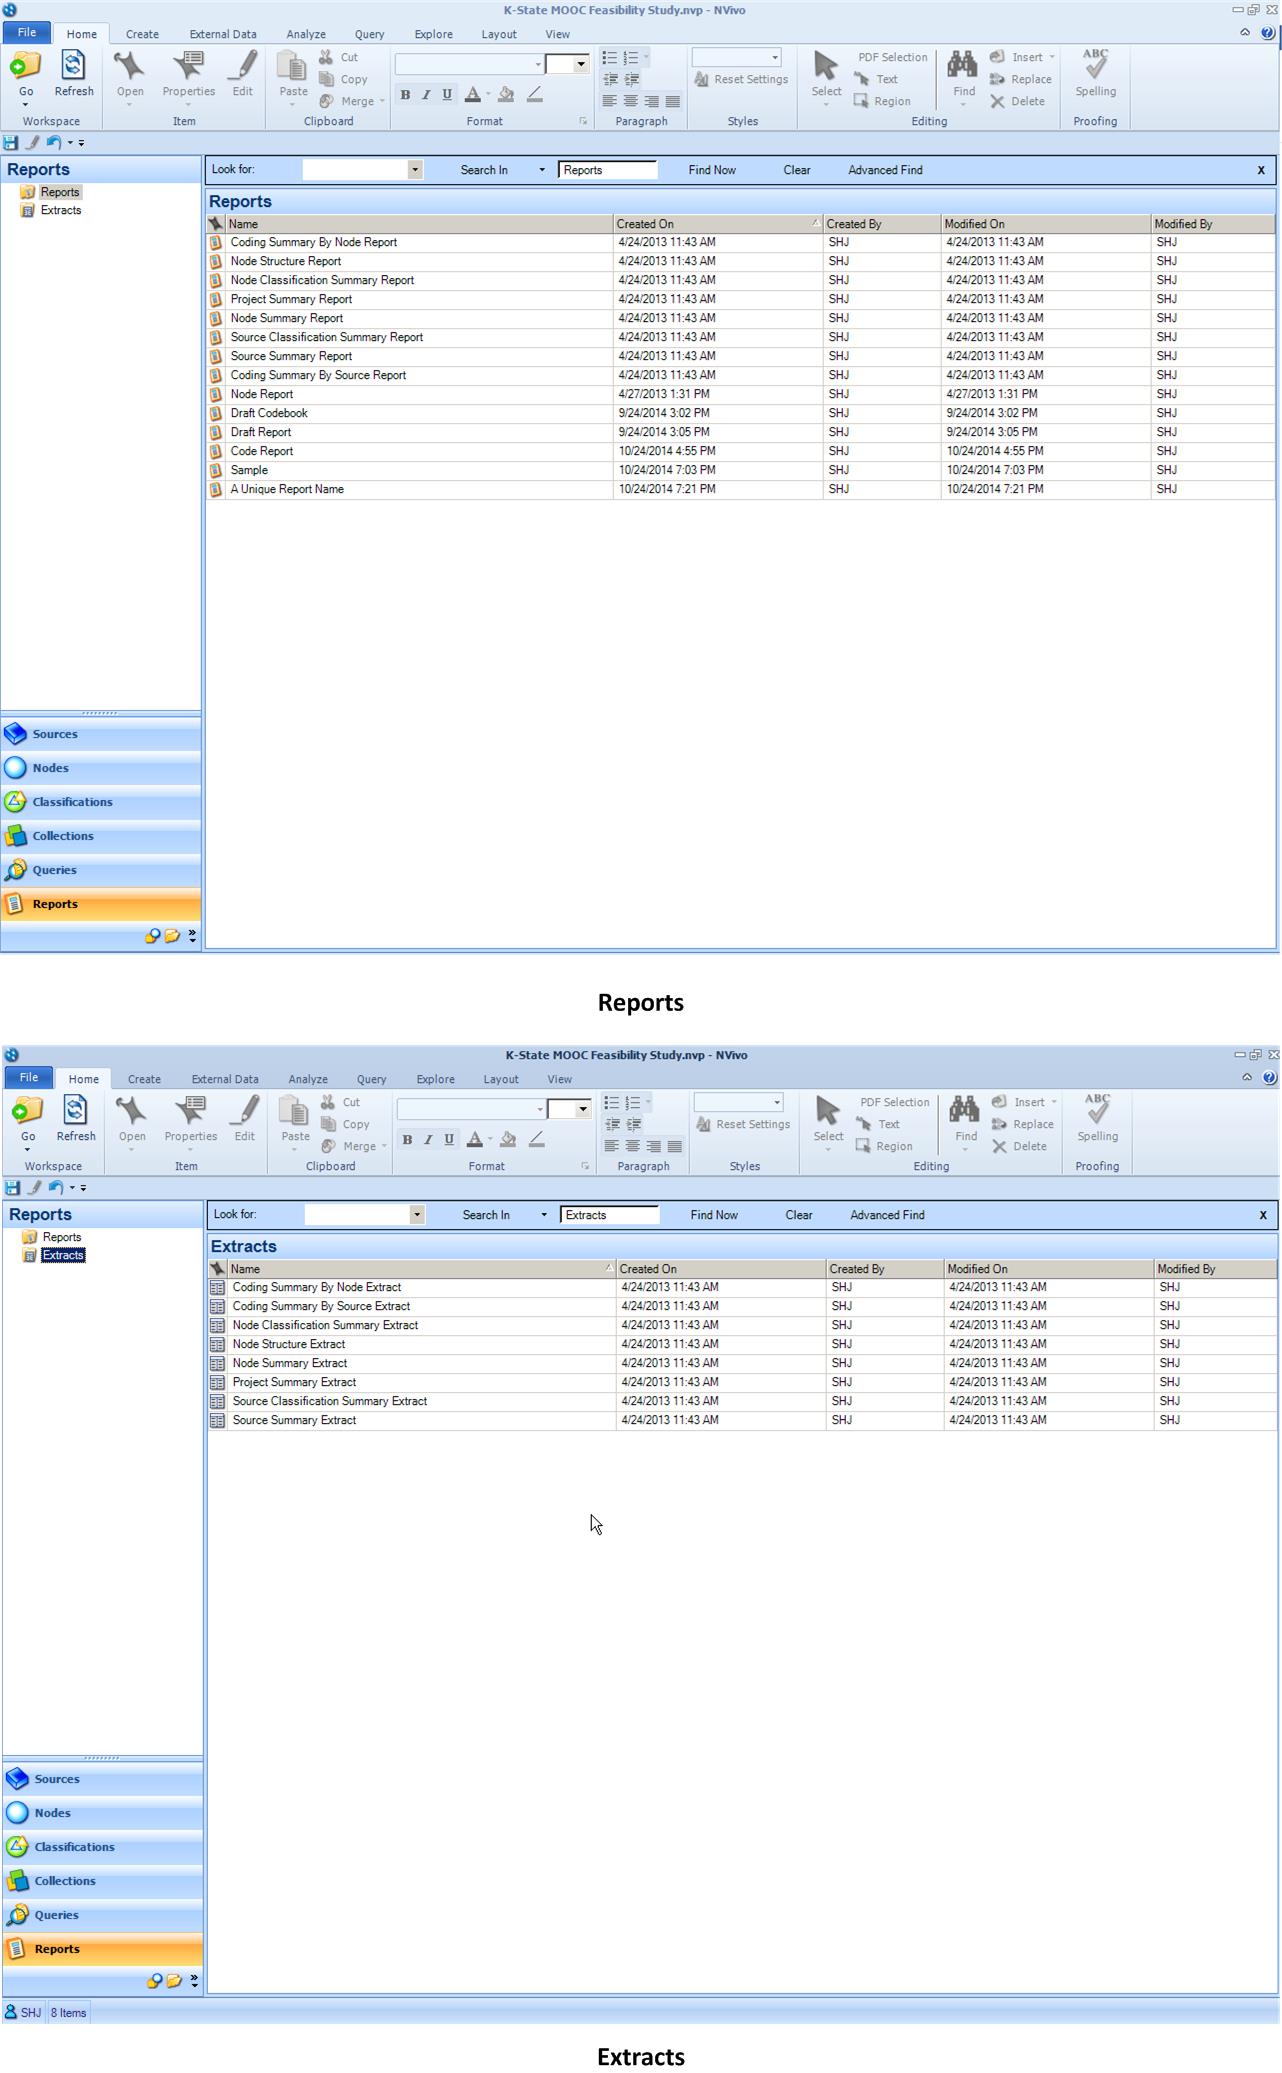
To access reports that had been run, in the Navigation View, go to Reports at the bottom left; select between “Reports” or “Extracts” at the upper left space. In the List View, all the reports will appear.
Any of those may be activated with a double-click. Or, a researcher may choose to go to the Extracts and view those.
Remember that a codebook may be extracted as a report by extracting all the nodes and the descriptions.
In newer versions of NVivo Plus (on Windows), there are more direct ways of outputting a codebook without having to use the Reports feature.
For More…
For more, please reference QSR International’s “About Reports and Extracts.”
There are predefined reports that may be explored and accessed.
For more about the Report Designer, please access this resource.
Discussion of "Building and Exporting Reports"
Add your voice to this discussion.
Checking your signed in status ...