Maps: Benefits and Challenges
Maps as Tools for Spatial Reasoning about Past and Present
Maps have a critical role to play across all the core social studies disciplines. In fact, they are the most common type of data visualization students will encounter in social studies texts. They help us determine geographic facts including absolute or relative location, the human and physical characteristics of places, as well as the physical connections between places. We can then use these geographic facts to employ spatial reasoning about the past or present, answering questions such as:
Maps can even help us understand ourselves—our own worldviews. Simple activities like the drawing and labeling of sketch maps can helps students reflect on what they know—and don't know—about the world. And GIS technologies allow students to track their own personal movement data, which they can use to examine where they go or don't go and how their everyday movements might shape their personal sense of place.How are/were places similar or different?
How is this place likely to affect or influence another?
How can this place be grouped with another?
How do things change between places? How do we know when we’ve gone from one place to another?
What larger places is this place inside? What smaller areas are inside of it? What impact does this hierarchy have on the places involved?
What other places are like this place?
Are things located in a distinctive arrangement? What patterns are evident?
What features or phenomena tend to occur together in the same places?
In history, maps are fundamental for telling and reading the stories of past. They allow historians to discover and visualize relationships hidden in written text and graphs, and conceive of space, place, and time in concert, and at both small and large scales. Maps make the invisible visible—revealing ways that people moved over long stretches of time, or how diseases or languages spread. Maps can show both the world and parts of the world at the same time, and thus, make the shifting of scales a possibility for scholars who want to move between local, regional, national, and global frames. In short, maps are powerful tools for inquiry, as is evidenced by the widespread use of maps and GIS technologies in digital history projects over the last several years. Notable examples include Mapping Segregation in Washington, D.C., Digital Harlem, and Voting America.
For learners, maps help establish a spatial context for events, interactions, and developments. To be sure, students will likely see them all over the texts they use to study history. Maps account for approximately 72% of all data visualizations in middle school world history textbooks, and 58% of all data visualizations in middle school U.S. history textbooks. Numbers are similar in high school history textbooks—maps account for 59% of all data visualizations in world history textbooks, and 49% in U.S history. And the majority of these high school history maps are spatiotemporal, showing change or movement over both time and space.[21] As Clara Webb argues in the journal World History Connected, “Maps can be powerful visual tools that provoke us to think about the how and why of history.”[22]
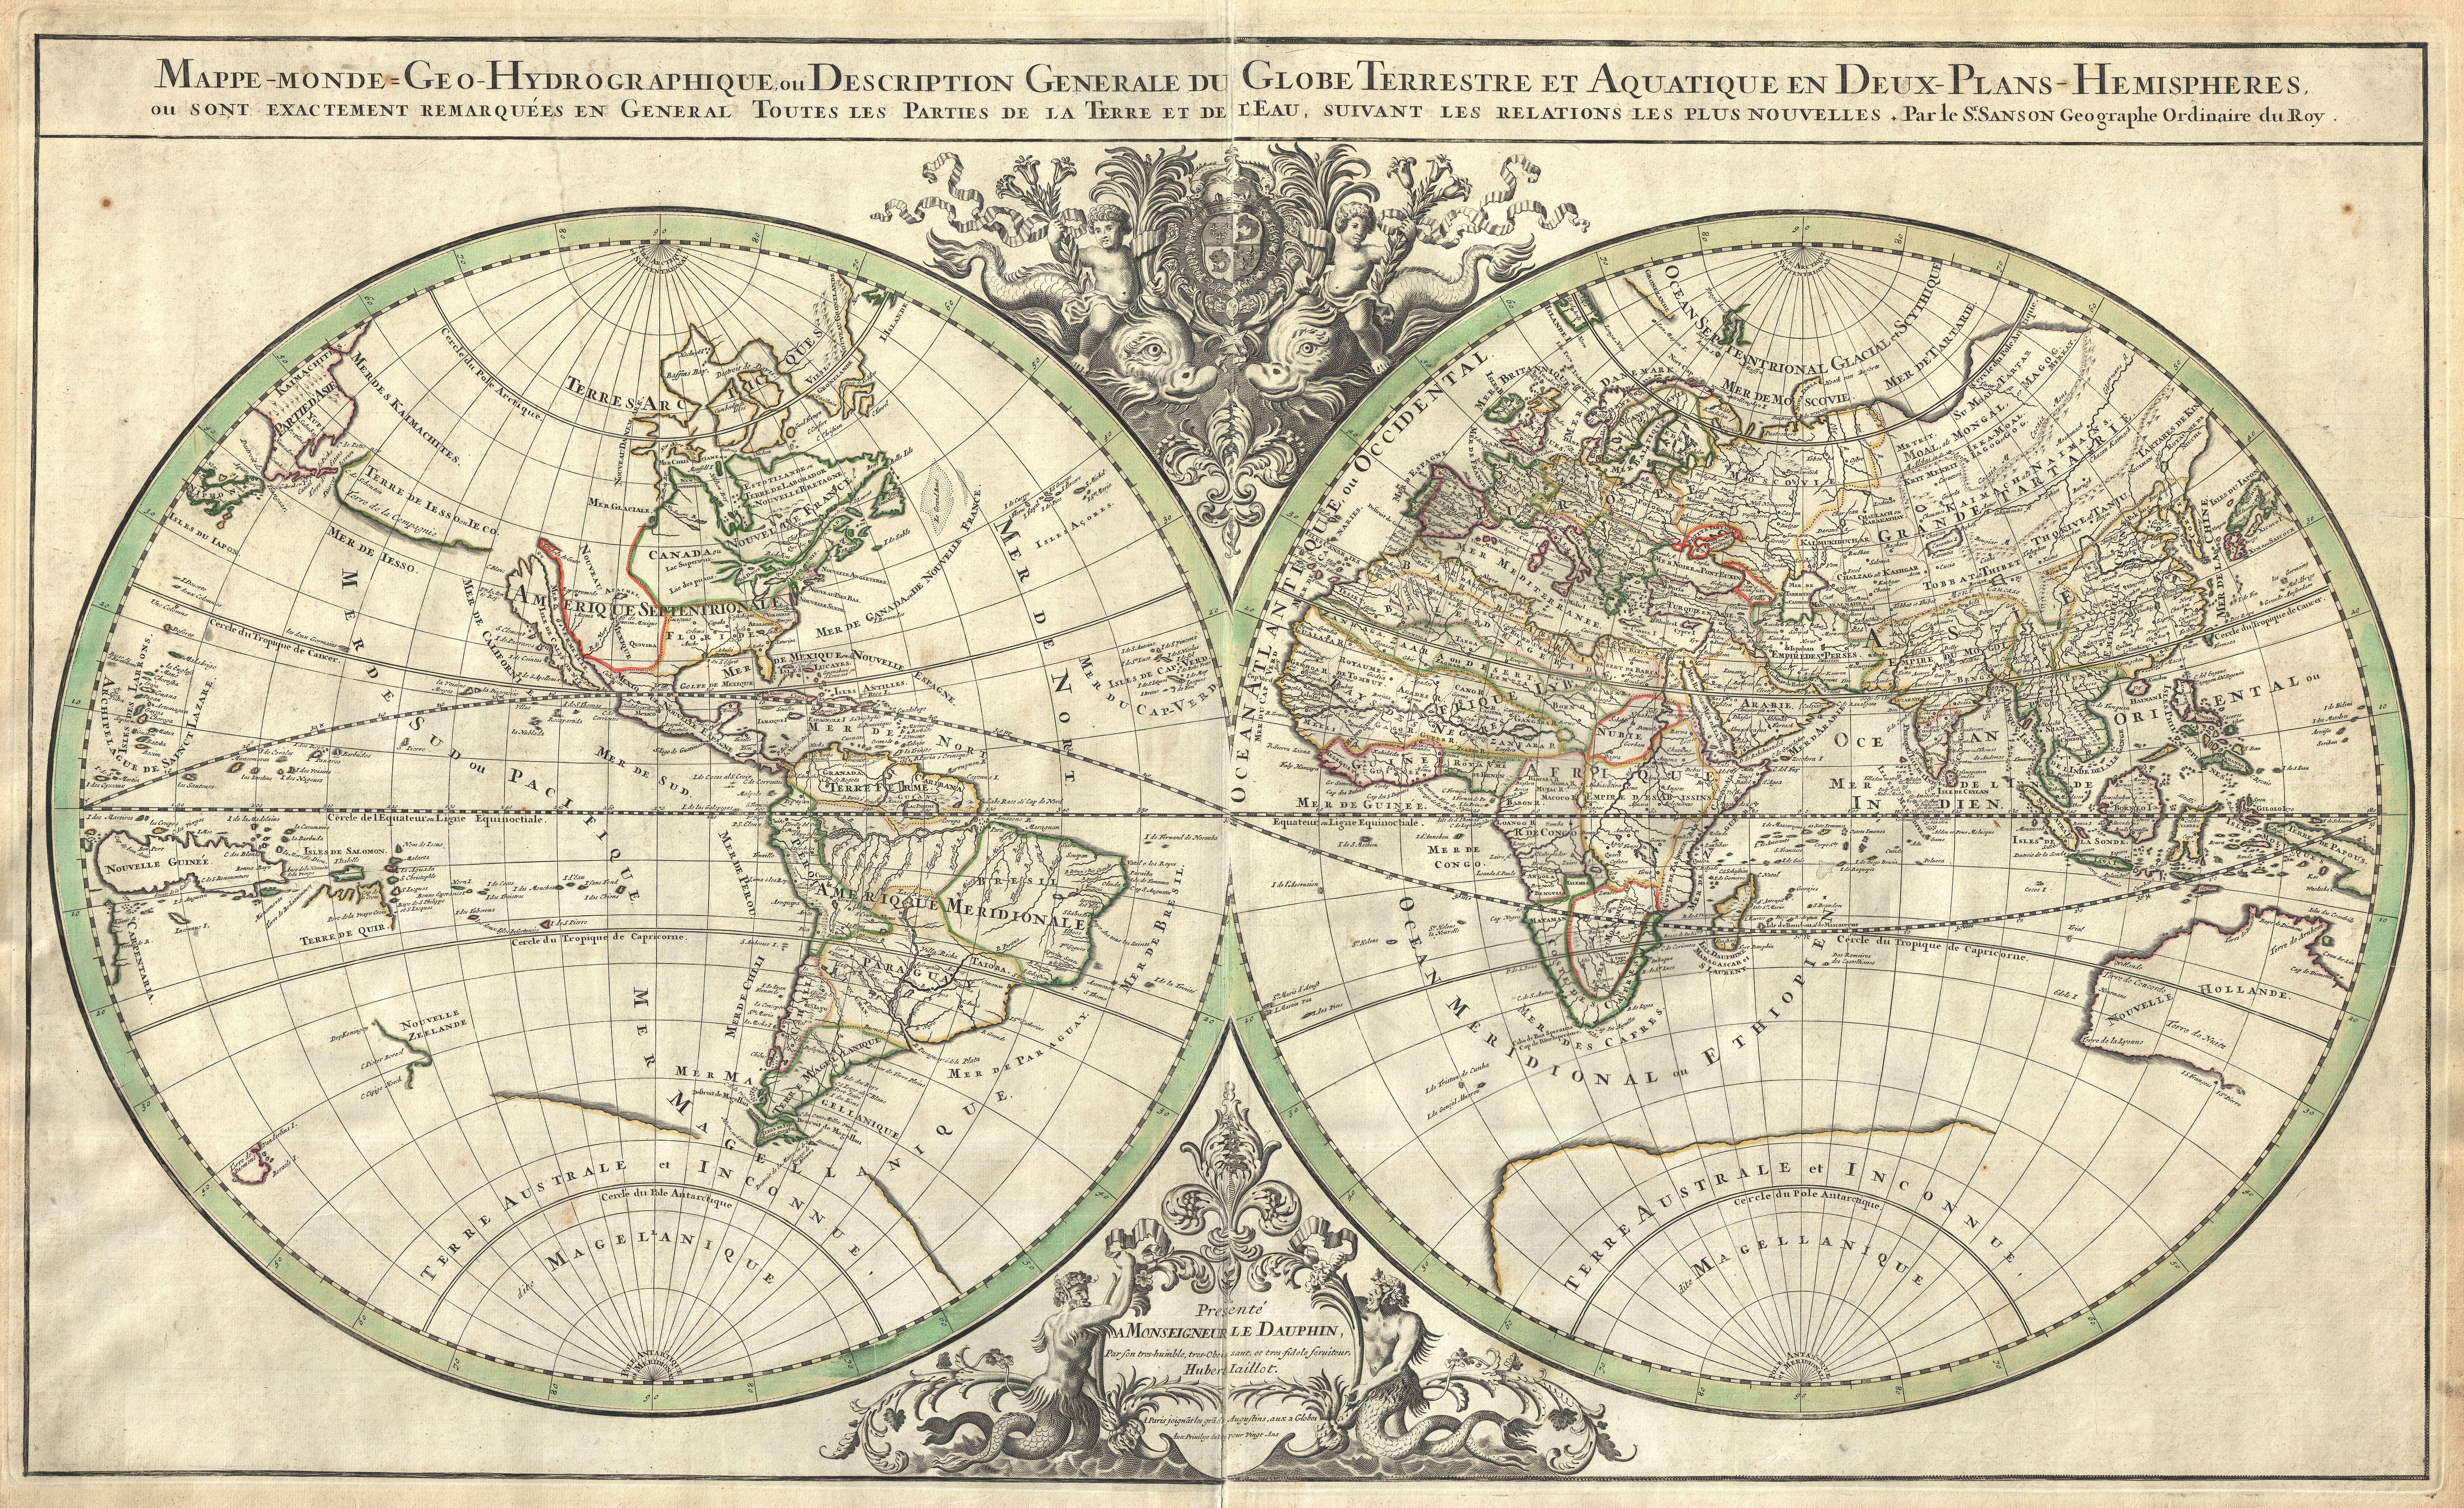
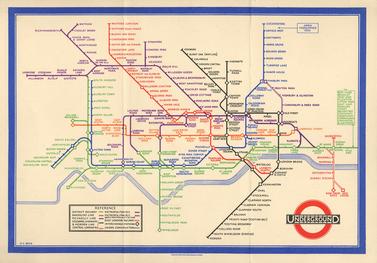
While many of the maps students encounter in school are intended to serve as visual aids to the spatial dimensions of historical developments, they can also be primary sources that provide students additional insight into change over time, causation, and historical perspectives. Indeed, maps as way-finding tools have played a significant role human lives throughout the world’s past, and have been as wide-ranging as an early map created by Egyptians of the 12th century BCE to find their way to gold and silver, to the iconic 1930s map of the London Underground. Some way-finding devices proved truly transformative in history, such as the map that may have helped encourage Christopher Columbus to find his way to the East Indies with a westward route, charting the course to the great global convergence of the Eastern and Western worlds. Other maps—such as those of the Chinese in the classical age, or the British at the height of imperialism—reveal to the historian the habits, thoughts, and perspectives of the people who created them, helping us understand how people of the past saw the world, where they had gone, and where they thought they could go.Approaches to Map Reading and the Challenges Students Face
Because someone within a particular context and with a particular purpose created any given map, it’s important that students question the premises and choices that underlie maps, analyzing the arguments that the maps are conveying, and features that were included and left out in making these arguments. Maps have been and continue to be keys to knowledge and power, as well as mediums of propaganda.
It’s also important for students to recognize that all maps are inherently incomplete and distorted. They are merely representations of real space, and cannot possibly show us everything about the place they are intended to represent. Maps at different scales show different levels of detail but that does not necessarily make one more accurate than another. And of course, in the shape and/or size of landmasses. The Mercator projection, for example, which students probably see in their textbooks and on classroom walls most often, famously makes Africa look much smaller and Greenland look much bigger than they are in reality. As Tim Marshall points out in his book Prisoners of Geography, “You could fit the United States, Greenland, India, China, Spain, France, German, and the UK into Africa and still have room for most of Eastern Europe.”[23] Without revealing different projections and their distortions to students, there is no reason to think that they will ever understand, and they may then walk away from school with misconceptions about the world.
There are other challenges students face in reading maps as well. First, young elementary students may fail to recognize that maps play an important communicative purpose within a larger text, which may prevent them from carefully examining the map and trying to determine its meaning within the text, and then using it to facilitate their understanding of the geopolitical or social issue at hand.[24] Young children may have difficulty recognizing how maps are oriented in relation to real space, and they may have difficulty interpreting the abstract symbol system on maps (e.g., grid system, colors, icons), or recognizing how the symbol systems are used to communicate information about the real world. The concept of scale seems to be particularly difficult for students to learn because it is highly abstract and requires proportional reasoning, measuring abilities, and an understanding of the relationship between a map’s scale and the amount of detail that can be shown on the maps.[25] Furthermore, students must recognize the interconnectedness of map elements and exercise a degree of proportional reasoning. Researchers Bausmith and Leinhardt have thus argued that teachers should provide elementary students practice in making maps, while also providing instruction on basic map elements (e.g., scale, symbol, projection), so that students can learn that all maps have inherent inaccuracies and distortions. They also suggested that maps with multiple layers present additional challenges to students. Therefore, students should engage with maps that have multiple layers and practice making connections between the layers. However, students should begin with relatively simple layers containing less information, before progressing to maps containing more information-rich layers.[26]
Happily, maps receive the most attention in state social studies standards across the United States, including in Michigan. In forty-two states students are expected to work with maps across elementary, middle, and high school, with no more than two years of unmandated instruction. In Michigan, for example, students are expected to work with maps in every grade from kindergarten through 12th grade, and because Michigan uses process and skills standards that are supposed to be implemented across grade levels and disciplines, it could be argued that they are expected to work with maps in every social studies class as well. Across the United States, however, most map instruction is recommended to take place within the context of geography, and only 17 states address maps across all core social studies disciplines. Notably, 11 states make no mention of maps within the context of history, 30 make no mention of maps within the context of civics, and 32 make no mention of maps within the context of economics.[27]
State standards documents tend to pay attention to graphical conventions in maps far more than they do in timeline or graphs and charts. In Michigan, for example, 2nd graders are expected to “construct maps of the local community that contain symbols, labels, and legends denoting human and physical characteristics of place.” They are also expected to “use maps to describe the spatial organization of the local community by applying concepts including relative location, and using distance, direction, and scale.” This level of detail in describing visual elements and recognizing conventions is not provided in any standards that include references to timeline or graphs and charts.[28]
There is less attention paid throughout state standards documents to introducing students to increasingly complex maps; only five states indicate this through references to specific types of maps. Michigan fairs rather well on this point—they specify that students work with “simple” maps in early elementary school, learn about “thematic” maps starting in 3rd grade, and begin working with “data maps” in 6th grade. Notably, however, students may start encountering data maps earlier than 6th grade, so in this way the specific recommendations may actually prove a disadvantage if teachers think they don’t have to teach such maps and leave students to their own devices.[29]
Sadly, only eight states recommend that students should know how to critically analyze maps by the end of high school. There is little attention across state standards to the fact that maps are created by individuals that make choices about what to include and exclude, contain distortions, and can sometimes present data that should be questioned and interrogated. Nor is there sufficient attention in standards across the United States to the fact that maps are projections that can distort data. Again, Michigan does relatively well here, in that they require high school students “evaluate data presented in social science maps considering the origin, authority, structure, and context of the information.” However, Michigan does not make specific recommendations that teachers provide instruction on map projections and distortions.[30]
As with timelines, and graphs and charts, research on benefits and challenges related to maps in social studies indicates that they are important to teach, and that teachers can’t completely depend on state standards documents to provide instructional guidance. The next module provides some suggestions for helping students analyze and make meaning of different kinds of data visualizations.
This page has paths:
This page references:
- How Do Students Learn with Data Visualizations? References/Additional Reading
- Climatology of Michigan (1873)
- An Accurate Map of North America Describing and Distinguishing the British, Spanish, and French Dominions on this Great Continent (1755)
- Topological Maps
- Henricus Martellus's World Map at Yale
- John Bull and His Friends: A Serio-Comic Graph of Europe (1900)
- Why all world maps are wrong