Cloud Mask
1 2017-07-10T10:56:17-07:00 Madeline Whitacre ff6e9d0020839762e90346899bb13cc3647ebcbd 19702 2 Simple thresholding algorithm flow chart plain 2017-07-10T11:33:22-07:00 Madeline Whitacre ff6e9d0020839762e90346899bb13cc3647ebcbdThis page is referenced by:
-
1
media/Cloud Masks.PNG
media/Los Alamos Clouds.PNG
2017-07-10T09:18:06-07:00
MTI Cloud Images
13
Atmospheric interference and cloud mask algorithms
image_header
2017-07-20T08:00:44-07:00
When analyzing data collected from the MTI, atmospheric effects must be accounted for. Cloud cover is a common problem, and one way which this is dealt with is by utilizing a could masking algorithm.
LA-UR-00-2964
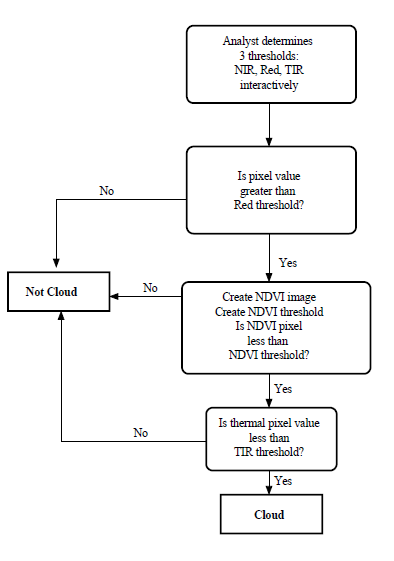
In order to interpret the data captured by the MTI, clouds must be removed from the images using a cloud mask. These algorithms are created by determining the important characteristics of clouds and determining thresholds for these attributes. The main characteristics of clouds are that they are white, bright, and cold. A cloud mask algorithm was created for the MTI using thresholds for these characteristics. Data to create the mask was collected from a visible band, a near infrared band, and a thermal band. Once data was collected and the thresholds were determined, an algorithm was created which would determine if clouds were present in images taken by the MTI.
This cloud mask was compared with two other existing cloud making algorithms, GENIE and MODUS. The MODerate resolution Imaging Spectroradiometer (MODIS) cloud mask requires additional information to run: is it day or night, is it a sun glint region, does the image contain snow or ice, ect. This method works well in regions containing snow or ice, but takes significant computing power to run. The GENIE method uses a genetic algorithm to create tools for processing images. GENIE takes several hours to evolve a solution, but then applies the cloud mask quickly. In comparison, the threshold system created for the MTI requires thresholds to be entered. The algorithm then applies the mask, which gives accurate results relatively quickly.
A cloud mask approach to MTI images is viable and practical option for environmental characterization, however a different approach was needed for the nonproliferation aspects of the mission.
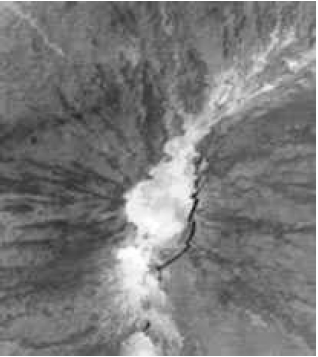
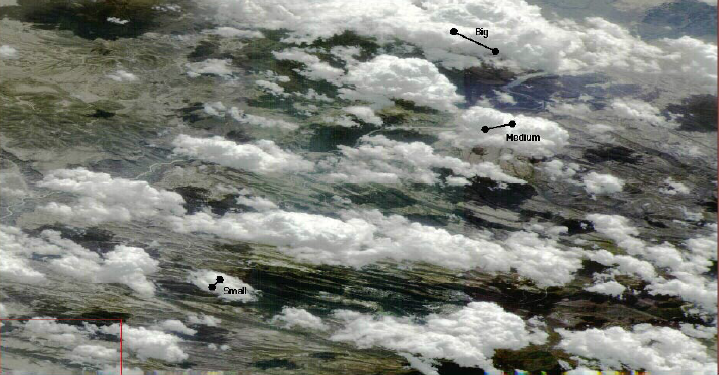
In operational remote sensing, the implicit model for cloud geometry is a homogeneous plane-parallel slab of infinite horizontal extent. Each pixel is indeed processed as if it exchanged no radiant energy whatsoever with its neighbors. The shortcomings of this conceptual model have been well documented in the specialized literature but rarely mitigated. The worst-case scenario is probably high-resolution imagery where dense isolated clouds are visible, often both bright (reflective) and dark (transmissive) sides being apparent from the same satellite viewing angle: the low transmitted radiance could conceivably be interpreted in plane-parallel theory as no cloud at all. An alternative to the plane-parallel cloud model is introduced here that has the same appeal of being analytically tractable, at least in the diffusion limit: the spherical cloud. This new geometrical paradigm is applied to radiances from cumulus clouds captured by DOE’s Multispectral Thermal Imager (MTI). Estimates of isolated cloud opacities are a necessary first step in correcting radiances from surface targets that are visible in the midst of a broken-cloud field. This type of advanced atmospheric correction is badly needed in remote sensing applications such as nonproliferation detection were waiting for a cloud-free look in the indefinite future is not a viable option.
- LA-UR-02-1520 -
1
2017-07-11T08:52:19-07:00
Image References
10
plain
2017-07-13T08:28:49-07:00
Balick, Lee, et. al. "ASTER image of the Mauna Loa summit caldera obtained at 11:21 local time on 14 July, 00." LANL Research Library. 2001. http://permalink.lanl.gov/object/tr?what=info:lanl-repo/lareport/LA-UR-01-1570
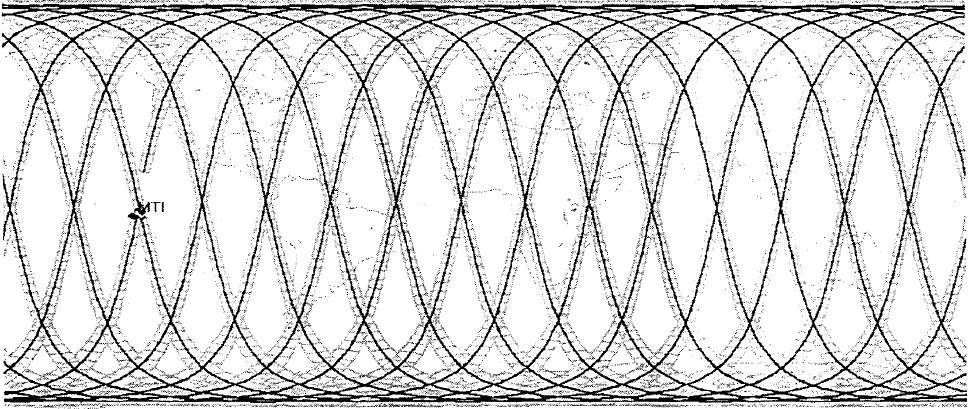
Bender, S. C., et. al. "Typical one day ground track +/- 200 kilometers, for MTI's orbit." OSTI. July 7, 1999. https://www.osti.gov/scitech/biblio/8953-ELzDWI/webviewable/
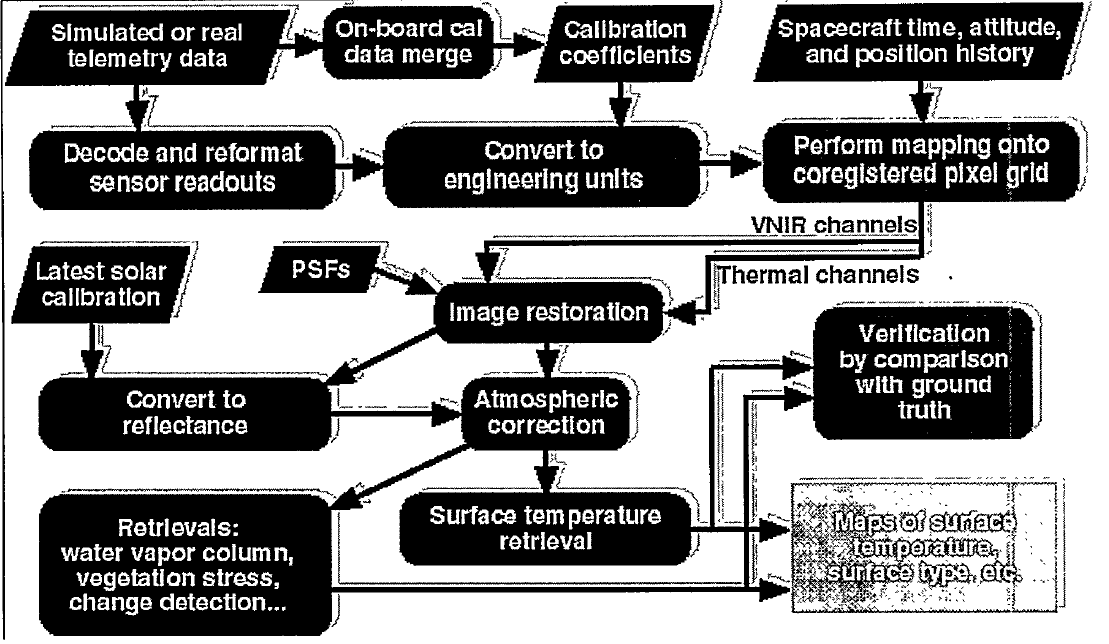
Borel, Chris, et. al. "Block Diagram of the specific implementation of the end-to-end modeling system for the MTI." OSTI. February 1, 1999. https://www.osti.gov/scitech/biblio/7403
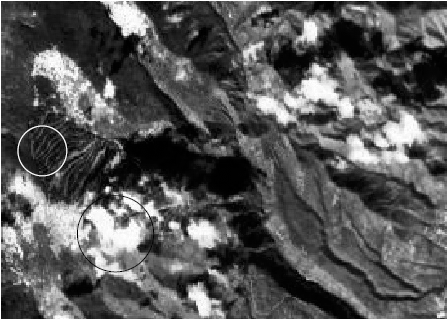
Davis, Anthony B. "Gray-scale version of a 'true color' channel combination of an MTI scene of Los Alamos (NM) in the presence of broken clouds." LANL Research Library. 2002. http://permalink.lanl.gov/object/tr?what=info:lanl-repo/lareport/LA-UR-02-1520
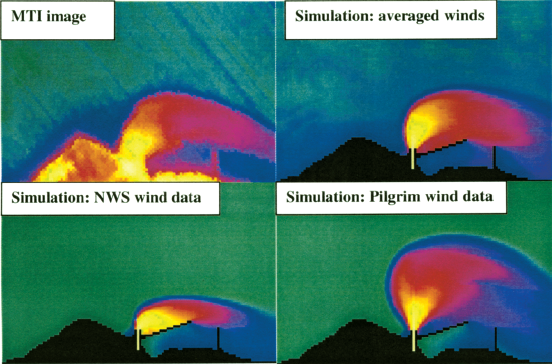
Garrett, Alfred J., et. al. "Comparison of 06/03/00 MTI thermal image of Pilgrim power plant plume to simulated plumes using Pilgrim wind data, National Weather Service wind data and averaged data from the two sources." SPIE Digital Library. July 29, 2001. http://proceedings.spiedigitallibrary.org/proceeding.aspx?articleid=892645
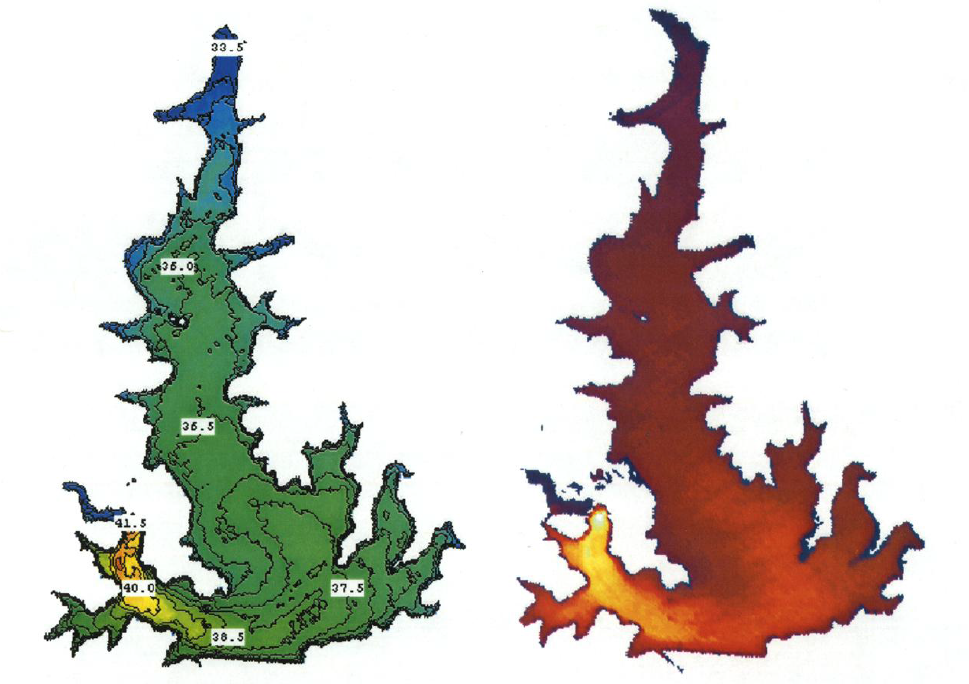
Garrett, Alfred J., et. al. "Calibrated, masked and warped thermal images of Squaw Creek reservoir." SPIE Digital Library. April 16, 2001. http://proceedings.spiedigitallibrary.org/proceeding.aspx?articleid=914113
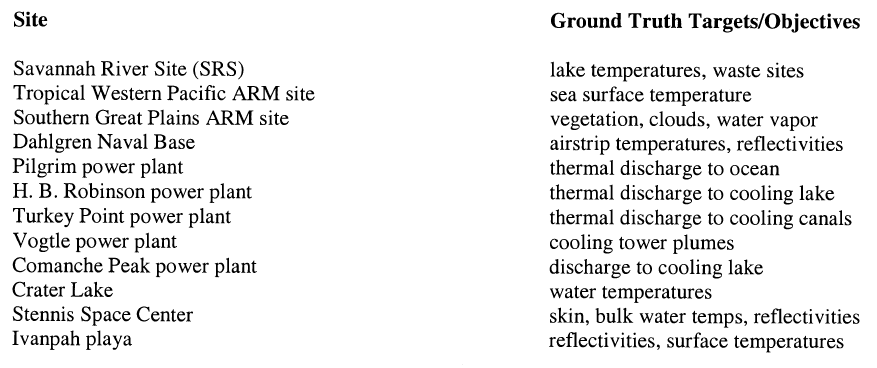
Garrett, Alfred J., et. al. "Ground Truth Targets/Objectives." SPIE Digital Library. April 16, 2001. http://proceedings.spiedigitallibrary.org/proceeding.aspx?articleid=914113
Garrett, Alfred J., et. al. "Simulated thermal image of Turkey Point cooling canals." SPIE Digital Library. July 29, 2001. http://proceedings.spiedigitallibrary.org/proceeding.aspx?articleid=892645
Hirsch, Karen, et. al. "Flow chart of the MTI simple threshold aglorithm." LANL Research Library. 2000. http://permalink.lanl.gov/object/tr?what=info:lanl-repo/lareport/LA-UR-00-2964
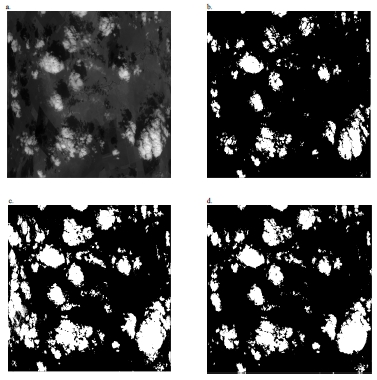
Hirsch, Karen, et. al. "The original data is compared with the three cloud masking algorithm results. (a) Shows the actual scene, a portion of flight 95-163 shown in a near infrared band. (b) The MTI cloud masking algorithm results. (c) The MODIS cloud mask results. (d) The GENIE cloud mask results." LANL Research Library. 2000. http://permalink.lanl.gov/object/tr?what=info:lanl-repo/lareport/LA-UR-00-2964
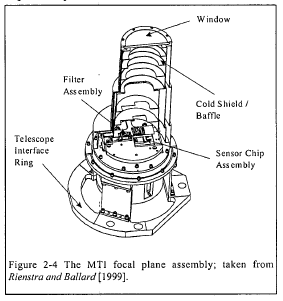
Lawson, S. L., ed. "The MTI focal plane assembly; taken from Rienstra and Ballard." LANL Research Library. 2004. http://permalink.lanl.gov/object/tr?what=info:lanl-repo/lareport/LA-UR-04-3378
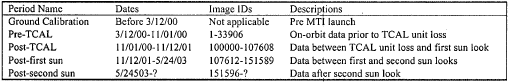
Lawson, S. L., ed. "The MTI image data sets grouped according to changes in the system performance." LANL Research Library. 2004. http://permalink.lanl.gov/object/tr?what=info:lanl-repo/lareport/LA-UR-04-3378
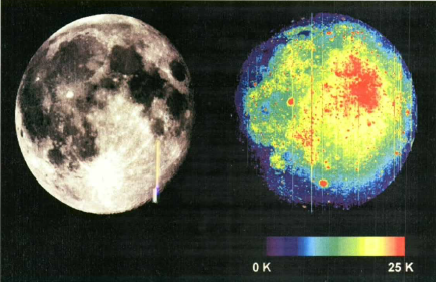
Lawson, S. L., et. al. "MTI 0.88 µm image and relative 8.6 µm brightness temperature map of the lunar surface during total eclipse." LANL Research Library. 2003. http://permalink.lanl.gov/object/tr?what=info:lanl-repo/lareport/LA-UR-03-0430
Nasa Administrator. "Bootprint on the lunar surface." NASA. July 30, 2015. https://www.nasa.gov/mission_pages/apollo /40th/images/apollo_image_11a.html
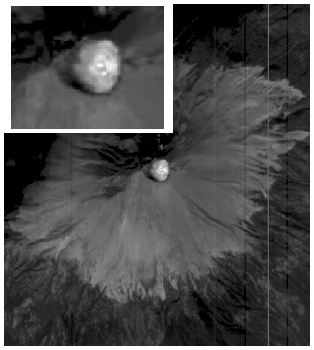
Szymanski, John J., et. al. "December 2000 thermal image taken in MTI band N of Popocatepetl." LANL Research Library. 2001. http://permalink.lanl.gov/object/tr?what=info:lanl-repo/lareport/LA-UR-01-0397
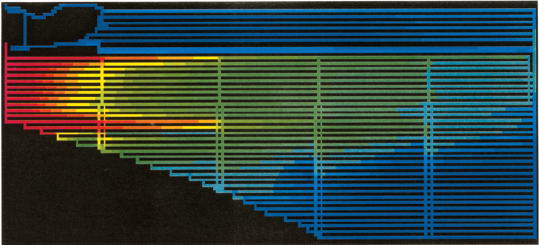
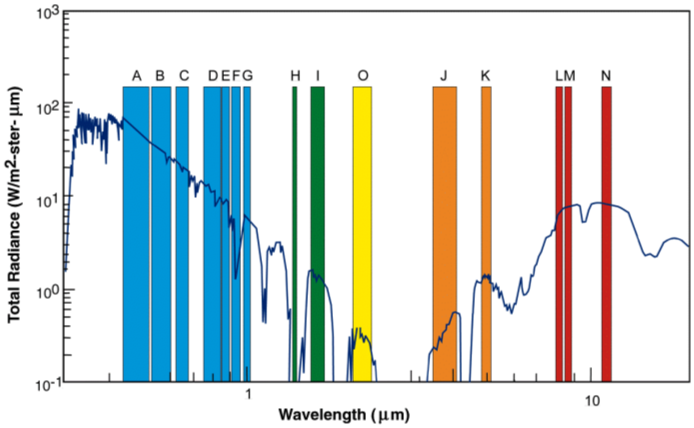
Szymanski, John J., et. al. "MTI spectral bands and superimposed solar spectrum and thermal emission spectrum." LANL Research Library. 2001. http://permalink.lanl.gov/object/tr?what=info:lanl-repo/lareport/LA-UR-01-0397
Szymanski, John J., et. al. "Snow on the upper portions of the ski slopes." LANL Research Library. 2001. http://permalink.lanl.gov/object/tr?what=info:lanl-repo/lareport/LA-UR-01-0397
Image References