Project Overview
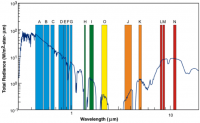
The purpose of this project was to support the nonproliferation of nuclear weapons and other weapons of mass destruction, to enable environmental characterization, and to examine the use of advanced multispectral and thermal imaging technologies from space. In order to achieve this, the satellite uses multiple spectral bands in the visible range, near infrared, shortwave infrared, midwave infrared, and longwave infrared ranges. The imager has a total of 15 spectral bands spanning these ranges.
- LA-UR-98-1053
The MTI was created as part of the legacy of the Landsat program, following the EO-1, Terra, SPOT, IKONOS, QuickBird, and EarlyBird satellites, among others. Proof of principle was a large part of the reason that the MTI program was initiated. This was new and developing technology which could be used to monitor for proliferant activities from space.
The MTI satellite will be in a circular, sun synchronous orbit, initially injected at 575 kilometers. Ascending equatorial crossings will occur at 1:00 PM spacecraft local time, descending crossings at 1:00 AM. This provides for the collection of both daytime and nighttime imagery. Figure 1 shows a typical ground track for one day. A site is considered to be available for imaging if it is up to +/- 20 degrees off nadir in the cross-track direction (approximately +/- 200 kilometers on the ground). The satellite ground track precesses each day, allowing a given sight to be available for imaging every seven days, on average. The satellite has no propulsion system so the orbit will decay as the mission progresses, and the orbit plane will drift about one hour over three years.
- SAN099-1723C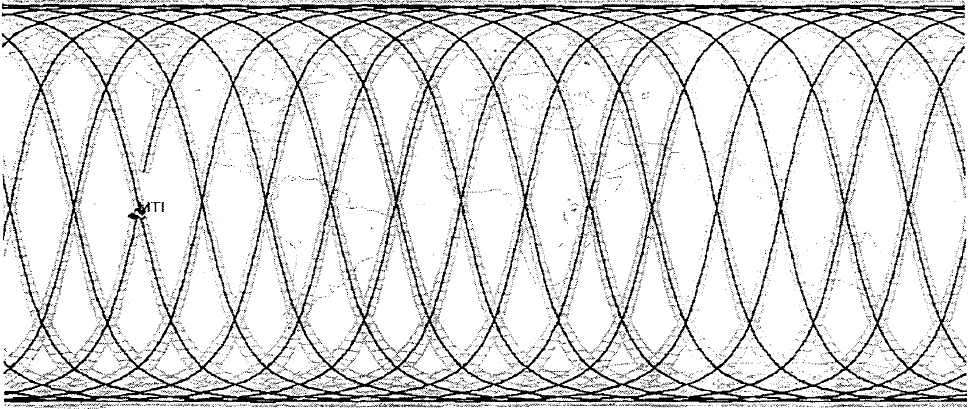
See also:
LA-UR-01-1253
LA-UR-99-978
Ball Aerospace Proposal
Sandia Lab News
This page has paths:
- Multispectral Thermal Imager Madeline Whitacre
Contents of this path:
This page has replies:
- Sam Harvey Sam Harvey