Figure 1
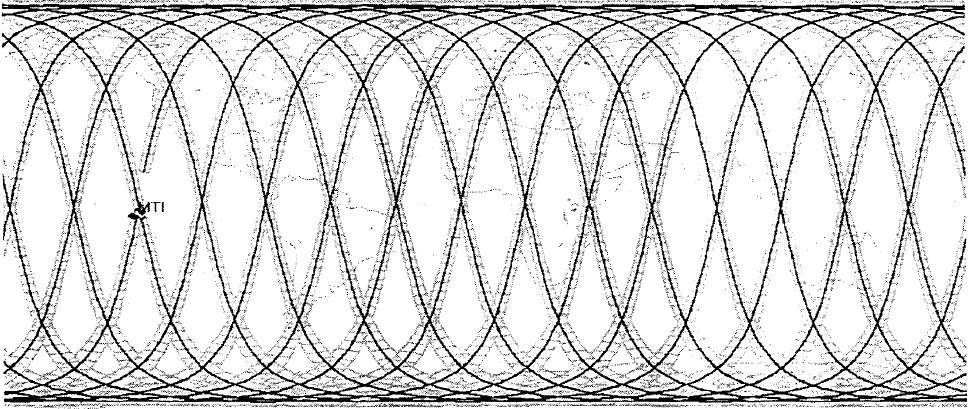
1 2017-07-11T06:33:58-07:00 Madeline Whitacre ff6e9d0020839762e90346899bb13cc3647ebcbd 19702 1 Typical one day ground track, +/- 200 kilometers, for MTI’s orbit. plain 2017-07-11T06:33:58-07:00 Madeline Whitacre ff6e9d0020839762e90346899bb13cc3647ebcbdThis page is referenced by:
-
1
media/Flow Chart EEM.PNG
2017-06-26T14:59:02-07:00
Project Overview
36
MTI Overview
plain
2017-07-31T06:38:03-07:00
The Multispectral Thermal Imager (MTI) is a joint project with Los Alamos National Laboratory, Sandia National Laboratories, and Savannah River Technology Center, and was sponsored by the United States Department of Energy Office of Nonproliferation Technology Development. The MTI satellite was launched on March 12, 2000.
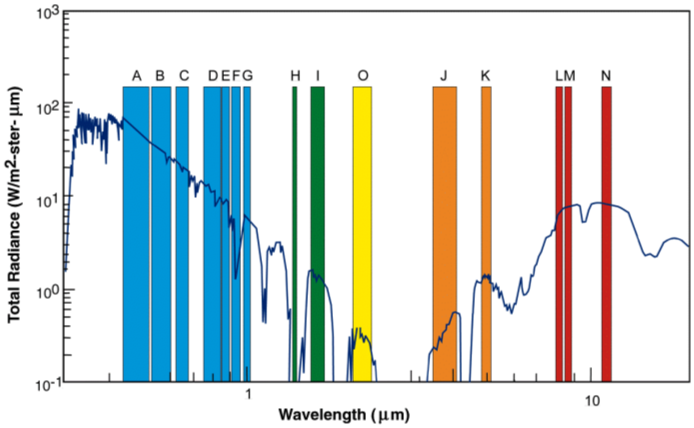
The purpose of this project was to support the nonproliferation of nuclear weapons and other weapons of mass destruction, to enable environmental characterization, and to examine the use of advanced multispectral and thermal imaging technologies from space. In order to achieve this, the satellite uses multiple spectral bands in the visible range, near infrared, shortwave infrared, midwave infrared, and longwave infrared ranges. The imager has a total of 15 spectral bands spanning these ranges.
- LA-UR-98-1053
The MTI was created as part of the legacy of the Landsat program, following the EO-1, Terra, SPOT, IKONOS, QuickBird, and EarlyBird satellites, among others. Proof of principle was a large part of the reason that the MTI program was initiated. This was new and developing technology which could be used to monitor for proliferant activities from space.The MTI satellite will be in a circular, sun synchronous orbit, initially injected at 575 kilometers. Ascending equatorial crossings will occur at 1:00 PM spacecraft local time, descending crossings at 1:00 AM. This provides for the collection of both daytime and nighttime imagery. Figure 1 shows a typical ground track for one day. A site is considered to be available for imaging if it is up to +/- 20 degrees off nadir in the cross-track direction (approximately +/- 200 kilometers on the ground). The satellite ground track precesses each day, allowing a given sight to be available for imaging every seven days, on average. The satellite has no propulsion system so the orbit will decay as the mission progresses, and the orbit plane will drift about one hour over three years.
- SAN099-1723C
See also:
LA-UR-01-1253
LA-UR-99-978
Ball Aerospace Proposal
Sandia Lab News -
1
2017-07-11T08:52:19-07:00
Image References
11
plain
2017-07-13T08:37:19-07:00
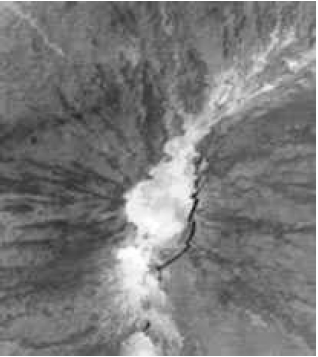
Balick, Lee, et. al. "ASTER image of the Mauna Loa summit caldera obtained at 11:21 local time on 14 July, 00." LANL Research Library. 2001. http://permalink.lanl.gov/object/tr?what=info:lanl-repo/lareport/LA-UR-01-1570
Bender, S. C., et. al. "Typical one day ground track +/- 200 kilometers, for MTI's orbit." OSTI. July 7, 1999. https://www.osti.gov/scitech/biblio/8953-ELzDWI/webviewable/
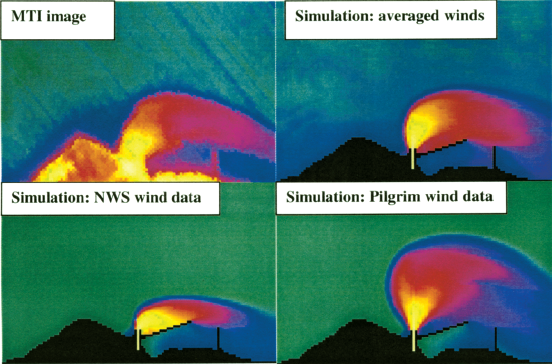
Garrett, Alfred J., et. al. "Comparison of 06/03/00 MTI thermal image of Pilgrim power plant plume to simulated plumes using Pilgrim wind data, National Weather Service wind data and averaged data from the two sources." SPIE Digital Library. July 29, 2001. http://proceedings.spiedigitallibrary.org/proceeding.aspx?articleid=892645
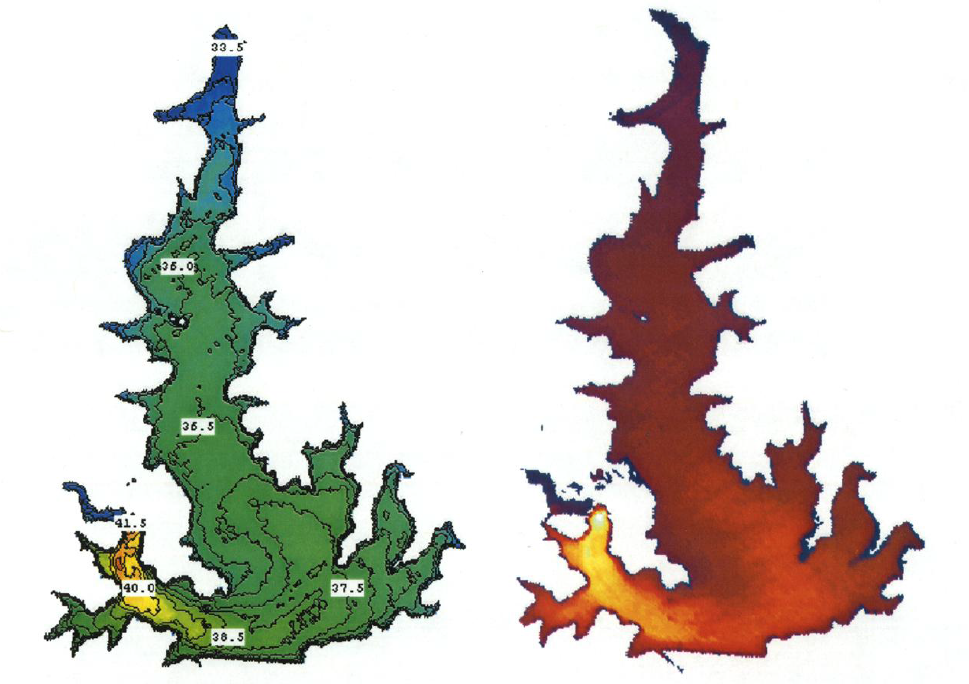
Garrett, Alfred J., et. al. "Calibrated, masked and warped thermal images of Squaw Creek reservoir." SPIE Digital Library. April 16, 2001. http://proceedings.spiedigitallibrary.org/proceeding.aspx?articleid=914113
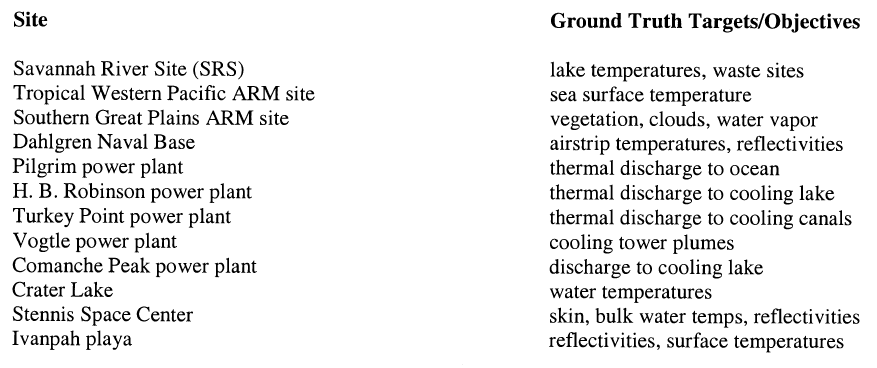
Garrett, Alfred J., et. al. "Ground Truth Targets/Objectives." SPIE Digital Library. April 16, 2001. http://proceedings.spiedigitallibrary.org/proceeding.aspx?articleid=914113
Garrett, Alfred J., et. al. "Simulated thermal image of Turkey Point cooling canals." SPIE Digital Library. July 29, 2001. http://proceedings.spiedigitallibrary.org/proceeding.aspx?articleid=892645
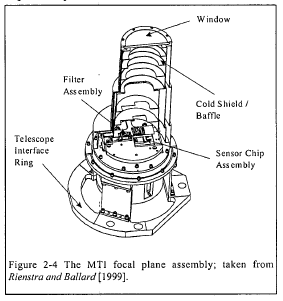
Lawson, S. L., ed. "The MTI focal plane assembly; taken from Rienstra and Ballard." LANL Research Library. 2004. http://permalink.lanl.gov/object/tr?what=info:lanl-repo/lareport/LA-UR-04-3378
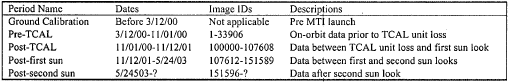
Lawson, S. L., ed. "The MTI image data sets grouped according to changes in the system performance." LANL Research Library. 2004. http://permalink.lanl.gov/object/tr?what=info:lanl-repo/lareport/LA-UR-04-3378
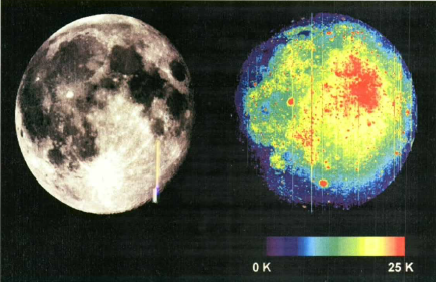
Lawson, S. L., et. al. "MTI 0.88 µm image and relative 8.6 µm brightness temperature map of the lunar surface during total eclipse." LANL Research Library. 2003. http://permalink.lanl.gov/object/tr?what=info:lanl-repo/lareport/LA-UR-03-0430
Nasa Administrator. "Bootprint on the lunar surface." NASA. July 30, 2015. https://www.nasa.gov/mission_pages/apollo /40th/images/apollo_image_11a.html
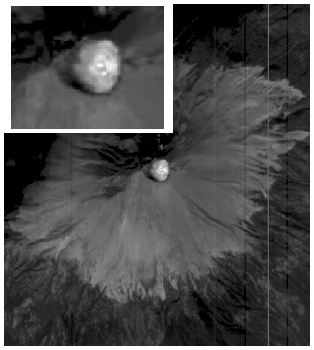
Szymanski, John J., et. al. "December 2000 thermal image taken in MTI band N of Popocatepetl." LANL Research Library. 2001. http://permalink.lanl.gov/object/tr?what=info:lanl-repo/lareport/LA-UR-01-0397
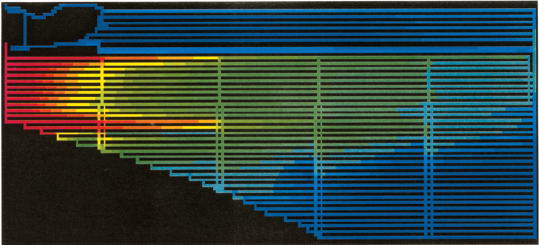
Szymanski, John J., et. al. "MTI spectral bands and superimposed solar spectrum and thermal emission spectrum." LANL Research Library. 2001. http://permalink.lanl.gov/object/tr?what=info:lanl-repo/lareport/LA-UR-01-0397
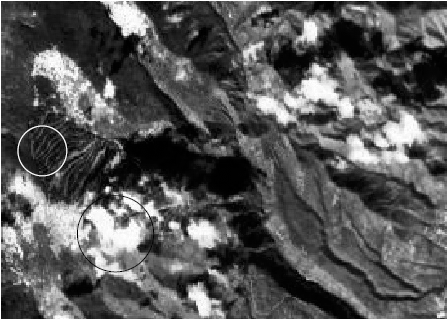
Szymanski, John J., et. al. "Snow on the upper portions of the ski slopes." LANL Research Library. 2001. http://permalink.lanl.gov/object/tr?what=info:lanl-repo/lareport/LA-UR-01-0397
Image References
Hirsch, Karen, et. al. "Flow chart of the MTI simple threshold algorithm." LANL Research Library. 2000. http://permalink.lanl.gov/object/tr?what=info:lanl-repo/lareport/LA-UR-00-2964
Hirsch, Karen, et. al. "The original data is compared with the three cloud masking algorithm results. (a) Shows the actual scene, a portion of flight 95-163 shown in a near infrared band. (b) The MTI cloud masking algorithm results. (c) The MODIS cloud mask results. (d) The GENIE cloud mask results." LANL Research Library. 2000. http://permalink.lanl.gov/object/tr?what=info:lanl-repo/lareport/LA-UR-00-2964
Davis, Anthony B. "Gray-scale version of a 'true color' channel combination of an MTI scene of Los Alamos (NM) in the presence of broken clouds." LANL Research Library. 2002. http://permalink.lanl.gov/object/tr?what=info:lanl-repo/lareport/LA-UR-02-1520
Borel, Chris, et. al. "Block Diagram of the specific implementation of the end-to-end modeling system for the MTI." OSTI. February 1, 1999. https://www.osti.gov/scitech/biblio/7403