Public Transportation Users in LA
This map represents the number of people over the age of 16 in Los Angeles County who use public transportation as the means to travel to their jobs. The data is based on the 2010 U.S. census.
In this map one can clearly see that the majority of people who use public transportation are located in the area where the U.S. highway 101 and the interstate 110 meet. Within that particular area the percentage of people who use public transportation ranges from 22%-57%. The area where the interstate 10 and Lincoln Boulevard meet seem to be the areas where there is a lower percentage of people who use public transportation. In that area only between 2%-9% of the people over the age of 16 use public transportation to get to work.
The data on the map coincides with my own observations. Often times as I ride the bus from the East side to the West side, I encounter an incredible of amount of people who ride the bus. Often times buses are extremely crowed. There is a higher demand for buses, then there are actual buses.
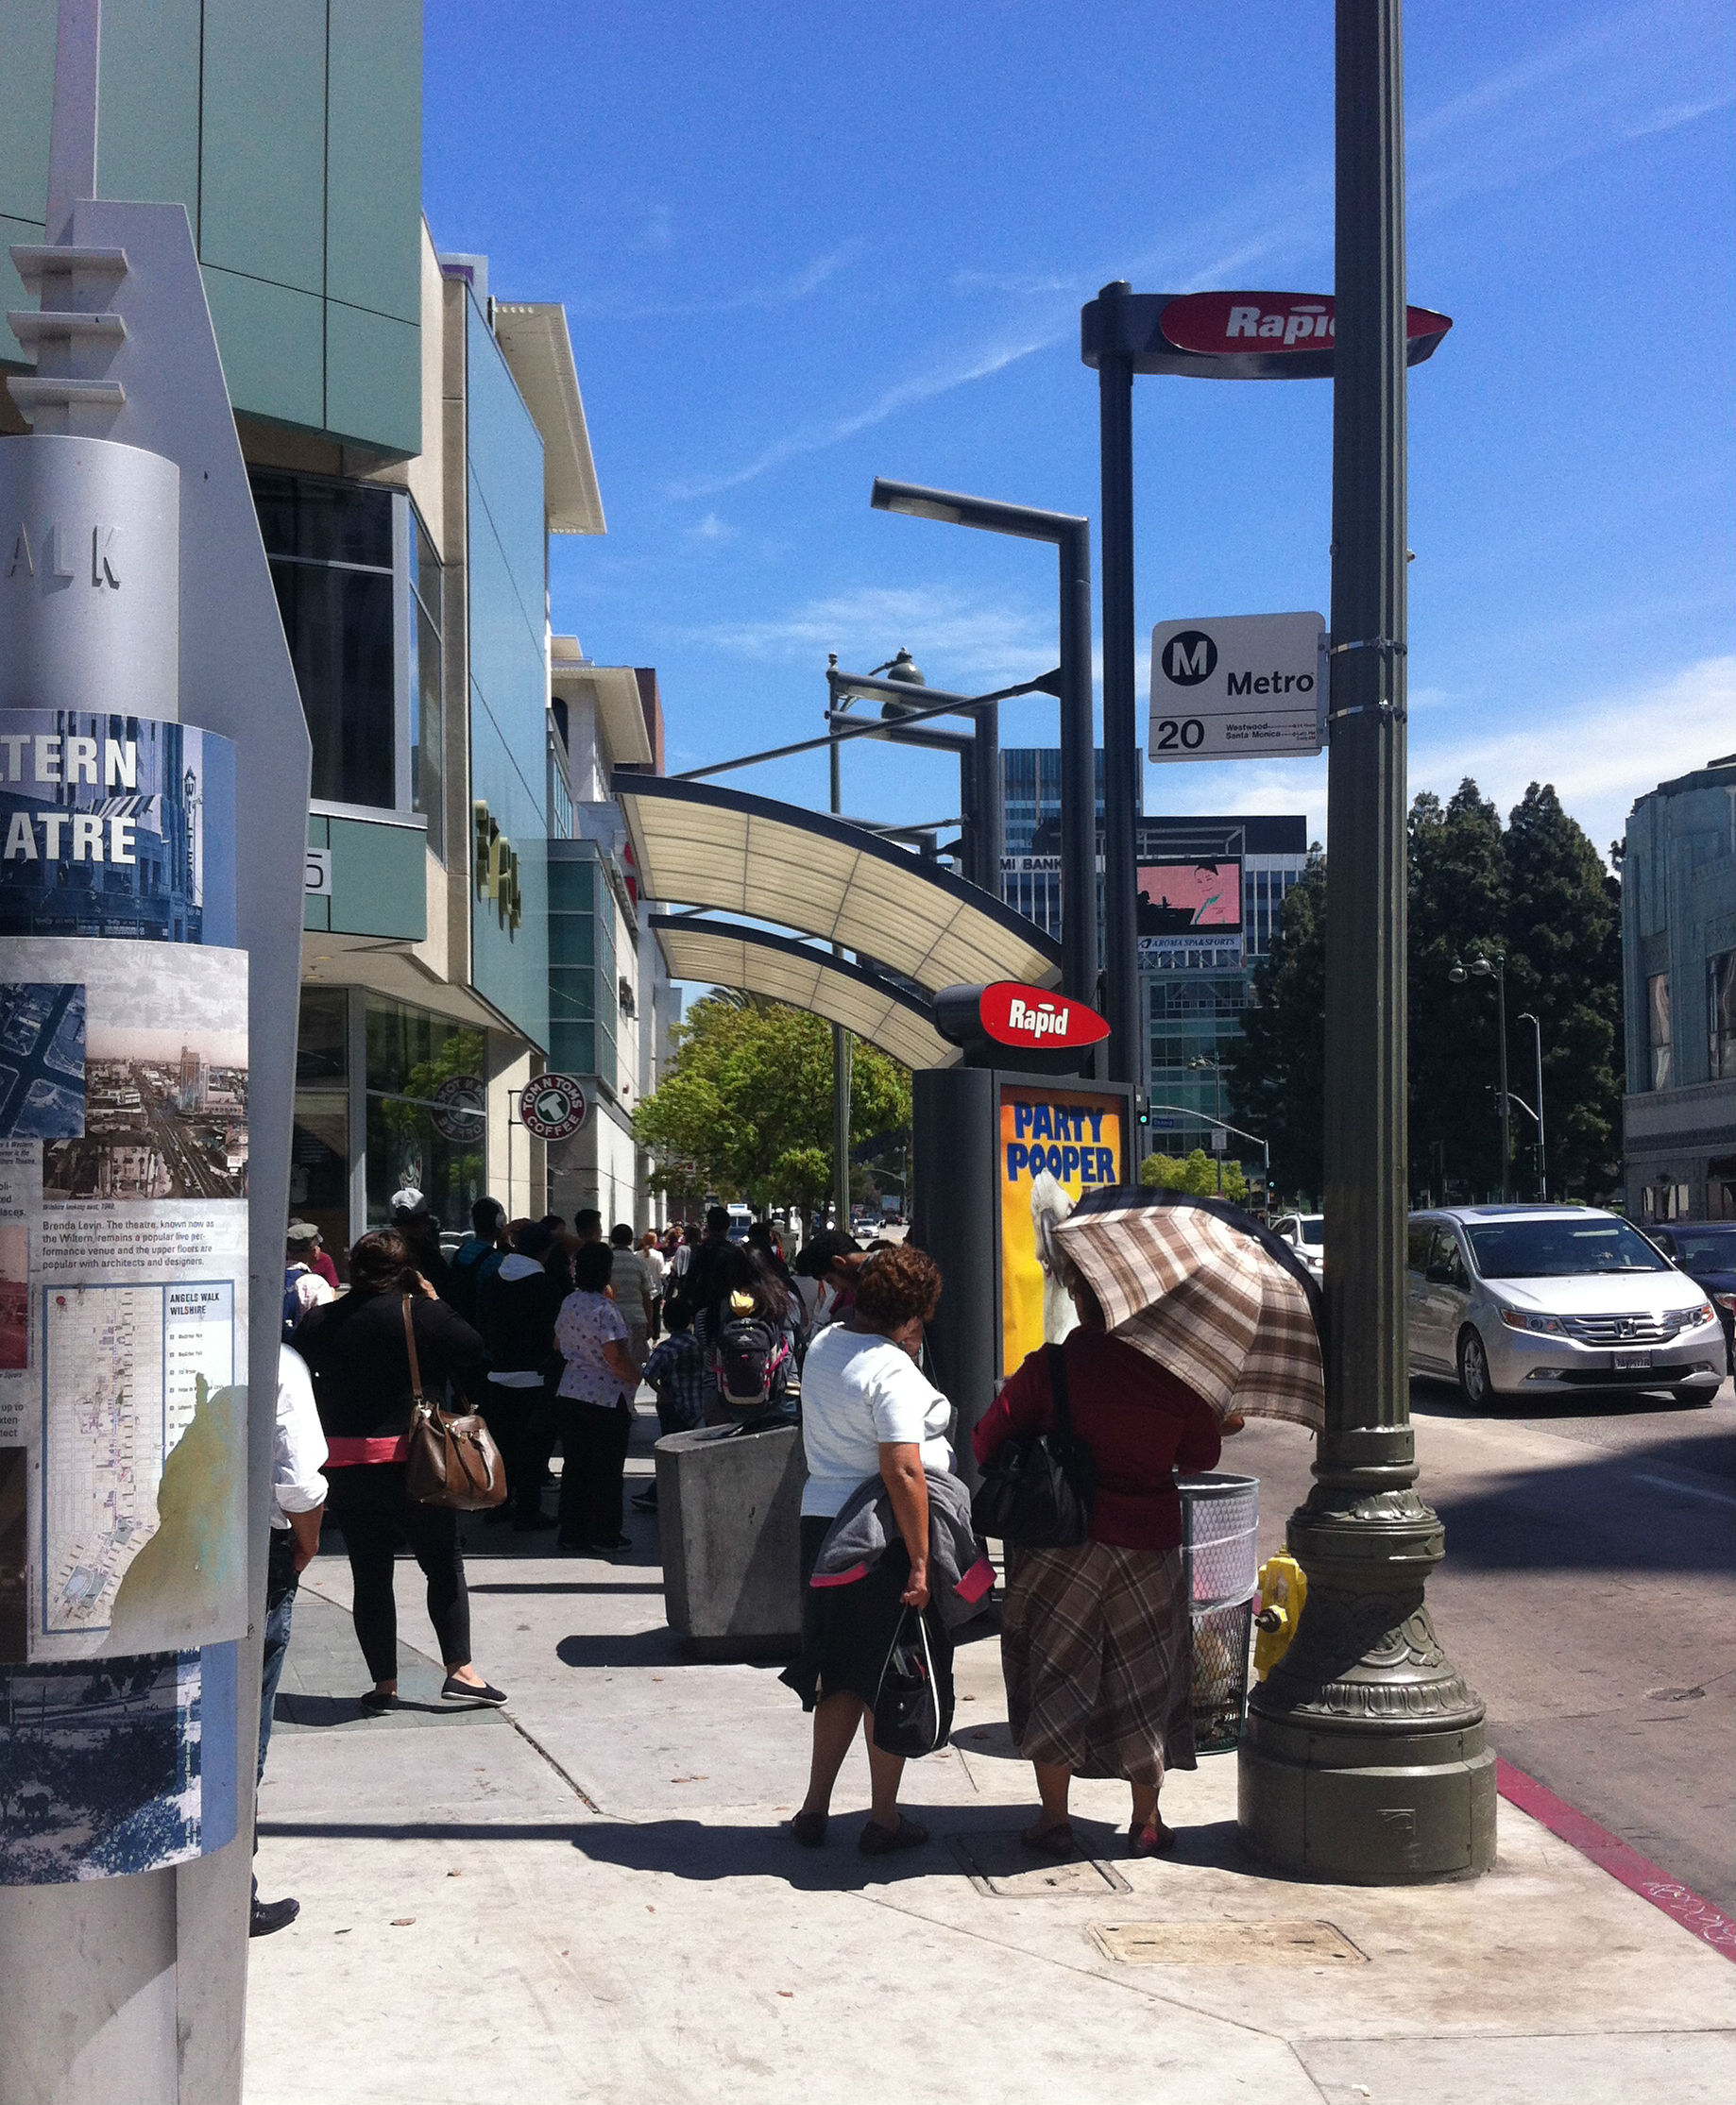
This picture shows how crowded the 720 Metro Rapid bus stop can become, this photo was taken at around 11am. By this time usually rush hour traffic has diminished, but not for the 720 users. Often times this bus stop is a lot more busy then it is in the picture.
According to Metro's 2014 biannual on board survey report 59% of bus riders are Latino, 7% Asian, 20% African American, and 9% White. Train users are 45% Latino, 11% Asian, 21% African American, and 18% White. 52% of bus riders are female, and 48% male. While 45% of train users are female, and 55% male. The majority of bus and train users are between the ages of 23 and 49.
On average it takes bus riders 21 minutes to walk to a bus stop and wait for the bus. For train users the average is 19 minutes. 82% of bus riders walked to a bus stop, compared to 62% of train users.
On average it takes bus riders 21 minutes to walk to a bus stop and wait for the bus. For train users the average is 19 minutes. 82% of bus riders walked to a bus stop, compared to 62% of train users.
In April of 2014 Metro estimated a total of 30,579,856 bus boardings, compared to 9,248,007 train boardings.
By: Thania Lucero
By: Thania Lucero
This page is a tag of:
| Previous page on path | Public Transportation, page 1 of 4 | Next page on path |
Discussion of "Public Transportation Users in LA"
Add your voice to this discussion.
Checking your signed in status ...