Criteria for Evaluation
1 2016-12-10T21:25:41-08:00 Michelle Sprouse 1de4a95f4eb5fc659ccf175b23034301196396f1 13844 5 plain 2016-12-11T05:58:51-08:00 Michelle Sprouse 1de4a95f4eb5fc659ccf175b23034301196396f1This page is referenced by:
-
1
2016-12-10T04:43:15-08:00
Criteria for Evaluation
20
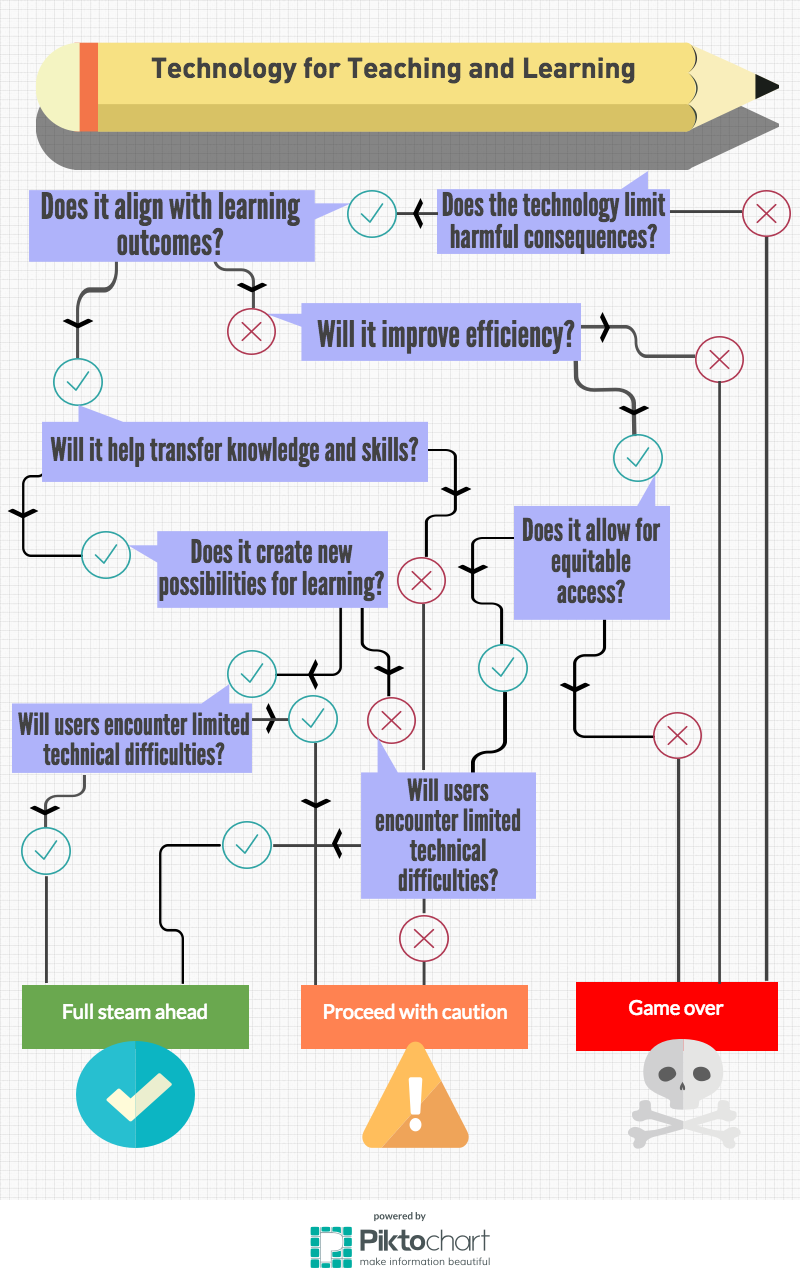
The infographic flowchart provides a series of questions to evaluate the use of learning technology.
plain
361704
2016-12-11T06:05:54-08:00
\ The infographic above represents my process for evaluating technology. While any educational technology evaluator might use this tool, my primary audience is educators who are making decisions which will affect students. To use the infographic, answer each question and follow the checkmark for yes and the x for no. As one moves through the infographic, the series of questions will direct an evaluator to one of three outcomes: full steam ahead, use caution, or game over.
I have recently added the first criterion referring to harmful consequences. As discussed in my narrative, I have found educational technologies that may harm students, including Automated Essay Scoring (AES) systems that measure only quantifiable aspects of writing and are used as gatekeeping devices. The veil of objectivity can facilitate using standardized tests for unfair high-stakes decisions. So, the primary question to consider is if using the technology will have harmful consequences.
The flowchart allows for weighting questions. Technologies that limit harmful consequences and align with learning outcomes will likely be recommended for use. Technologies designed only for improving efficiency have to pass several other questions before recommendation. Thus I am attempting to offer a more balanced view of the potential advantages and challenges for using learning technology.