Wage Ratios
As we look at the trajectory of wages, it is fruitful to consider not just the stagnation of the median, but the distinct gaps between low-wage and median-wage workers, and between median-wage and high-wage workers. And its important to consider the timing of these gaps. Union decline is undoubtedly important, for example, but it is most important to the gap between low-wage and median-wage workers–and most important, as a causal force, before 2000. By the same token, declining returns on education are probably most important to median-wage workers in recent years. And skyrocketing CEO salaries or financialization explain the gap between the median and the wealthy (or between the wealthy and the very wealthy) in recent years, but have little effect on low or median-wage workers.
Use browser's "back" button to return to chapter
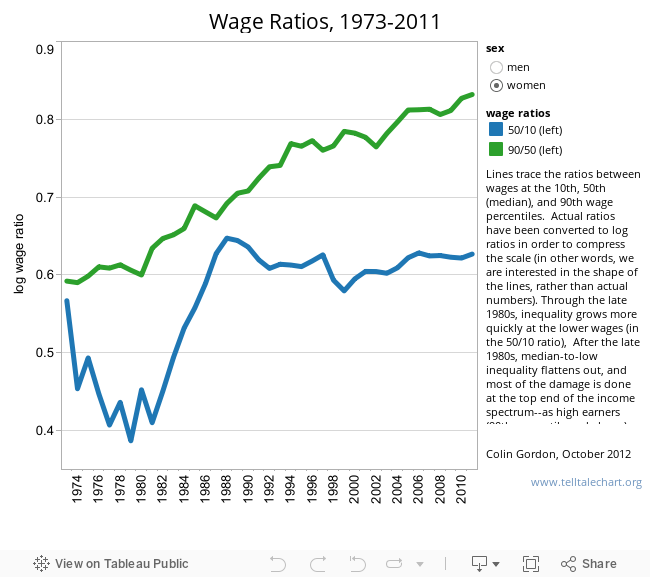
This graph traces the ratio between wages at the 10th, 5oth (median), 90th, and 95th percentiles–for men and women, from 1973-2011. Think of the ratio between poor and rich (the 10th and 90th percentiles) as a rough index of inequality. Through the 1990s, most of that gap was driven by poorer workers falling away from the median–as unions declined (especially for men) and the minimum wage stagnated (especially for women). Over the last 20 years, that gap has been driven largely by high-wage workers (the 90th percentile and up) pulling away from the median.
Use browser's "back" button to return to chapter

Discussion of "Wage Ratios"
Add your voice to this discussion.
Checking your signed in status ...