Keith Slash
1 2017-06-28T20:55:27-07:00 Rennie Heza e1990fe70b4748351393d4d28793c01835984608 19794 1 Duncan Keith earns a penalty in the 2014 playoffs plain 2017-06-28T20:55:27-07:00 Rennie Heza e1990fe70b4748351393d4d28793c01835984608This page is referenced by:
-
1
2017-07-09T20:43:29-07:00
Penalty Kill Percentage
20
plain
2017-10-07T12:11:09-07:00
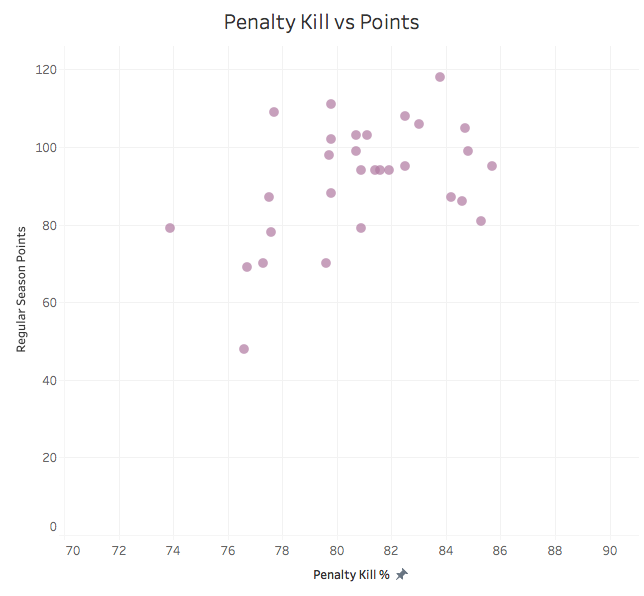
The fourth metric in the model is the percentage of "penalties killed" by the team. A team becomes "short handed" when a player takes a penalty. Taking a penalty refers to breaking any of hockey's major rules: no tripping, no late hits, no hitting the opposing goalie, etc. An example of a slashing penalty is shown to the right. When a penalty is taken, the team must player for two minutes with only four players as comparedto the opponents five players. In order to kill a penalty, the team must not allow a goal in those two minutes. Including this metric is intended to account for a team's ability to play smartly and efficiently, because playing with one less skater is draining and the offensive pressure of the opposing team is unrelenting. Interestingly, the number of penalties scored in a game seemed to have no relationship with the number of regular season points earned, but the penalty killing percentage did. This trend is clear below, though less strong than the trends shown above. The R-squared value is 21%. This is high enough to deem this relationship statistically significant because 21% of the variation in regular season point totals is related to penalty kill percentages.
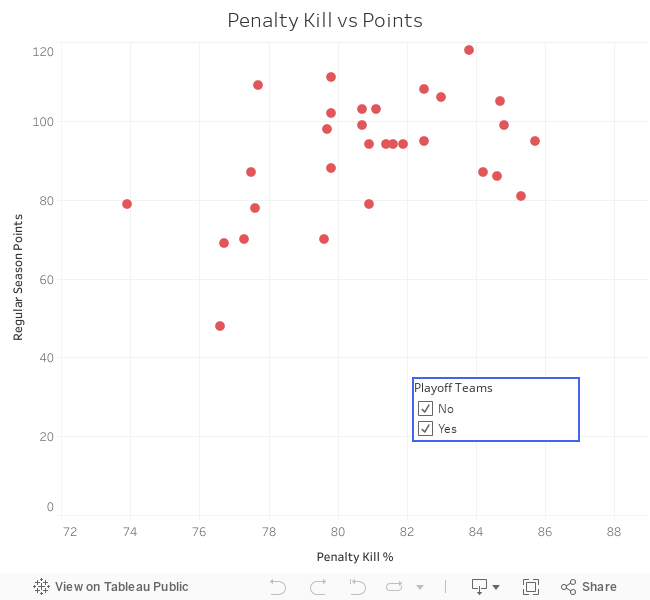
Mouse over each datapoint to see more about specific teams, and toggle between playoff teams and non playoff teams to see what sets them apart! <p>&nbsp; </p> -
1
2017-07-06T07:12:44-07:00
The "Secret Formula"
7
plain
2017-07-09T20:39:10-07:00
The model itself can be written in a single line:
Points = - 683.84226 + 0.02822 * Blocks + 2.0353 * FF% Close5v5 + 5.08899 * PDO Close 5v5 + 1.41838 * PK% + 0.90363 * PP%
However, to truly understand what this model is doing and how a team's regular season point total is predicted, one must understand the metrics that make up the model.
The fourth metric in the model is the percentage of "penalties killed" by the team. A team becomes "short handed" when a player takes a penalty. Taking a penalty refers to breaking any of hockey's major rules: no tripping, no late hits, no hitting the opposing goalie, etc. An example of a slashing penalty is shown to the right. When a penalty is taken, the team must player for two minutes with only four players as compared to the opponents five players. In order to kill a penalty, the team must not allow a goal in those two minutes. Including this metric is intended to account for a team's ability to play smartly and efficiently, because playing with one less skater is draining and the offensive pressure of the opposing team is unrelenting. Interestingly, the number of penalties scored in a game seemed to have no relationship with the number of regular season points earned, but the penalty killing percentage did. This trend is clear below, though less strong than the trends shown above. The R-squared value is 21%. This is high enough to deem this relationship statistically significant.
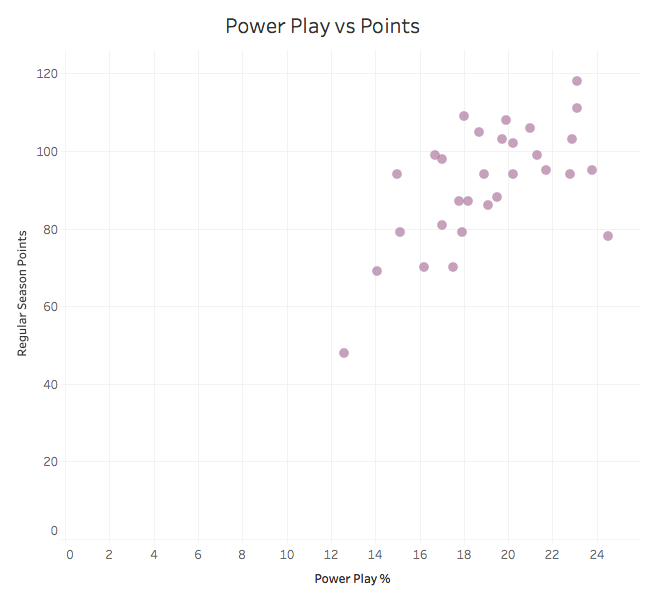
The fifth and final metric included in the model is the percentage of "power plays" scored on in the season. When the penalized team becomes short handed, the opposing team which gets to keep playing with 5 skaters is on what is called a power play. This metric refers to the percentage of power plays during which this teams scores. This metric is used to assess a team's ability to generate high quality scoring chances when playing with an extra player. High octane offensive teams generally have great power play percentages, as patience and chemistry are key when playing on a power play. The positive relationship between power play percentages and regular season points is below, with a R-squared value of 36%.
These metrics all contribute different team attributes to the model. Though very simplified, this model is very successful as predicting team success.
[Include stats of model accurate on 2015-2106 regular season data]