Book Review: Basic Methods for Conducting Archival Data Analyses in K-12 and Higher Ed (in Texas)
By Shalin Hai-Jew, Kansas State University
John R. Slate, Editor
Exemplars of Conducting Archival Data Analyses: A Collection of K-12 and Higher Education Studies
Nova Science Publishers
2020 1 – 464
The concept behind rediscovering and reusing archival data is that there is unexploited value in already-captured data. In terms of K12 data, a byproduct of government oversight and its regular work, these may be studied for achievement gaps, areas requiring improvement, and other motivations to pursue more effective practical strategies.
Exemplars of Conducting Archival Data Analyses: A Collection of K-12 and Higher Education Studies, edited by Dr. John R. Slate, models how to acquire archived educational data (on K12 education within Texas and the U.S.) and to apply solid statistical analyses to understand the trends and then to apply logic to understand the implications and to suggest methods for improvement. In a sense, each chapter is its own case, but in another, the collection is itself a case…of how to conduct archival data analyses (using classic descriptive and inferential statistical approaches). In an age of big data, machine learning, trace data, and social media, this approach reads a little old school but relevant.
Introduction
This work takes a studied and almost templated approach. Each chapter includes a summary of a sampling of the research literature that informs the work, sets up the data analysis as a form of research [non-experimental studies without theoretical frameworks that are essentially “causal comparative” research designs, based on archival data (often over a period of years) and with defined independent variable(s) and dependent variables(s)], presents the statistical analyses and findings, followed by an analysis. The data analysts acknowledge the limits to the data, such as the numbers of schools reporting, and other challenges, although these are not mitigated in the analyses. They apply general logic in applying their findings to the real. The work show different levels of granularity, from the micro to the meso: “the individual student level…the school campus level…community college level…(and)…the 4-year university level” in the state of Texas (Slate, 2020, p. ix), with the idea that this disciplined approach may be generalized to other contexts. In the Preface, the editor explains how the respective teams acquired the public data through public information requests to the Texas Education Agency. These include datasets with various focuses: educational achievement, discipline consequence, and others. In some cases, the teams paid “quite reasonable” fees to mitigate “programming costs” (Slate, 2020, p. ix). He writes:
To obtain the state datasets on school campuses, school districts, community colleges, and 4-year universities, either the Texas Academic Performance Report website for K-12 data or the Texas Higher Education Coordinating Board Interactive Accountability system website for Postsecondary data were accessed. These two sources provide educational data free of charge to anyone with internet access. (Slate, 2020, p. ix)
Such access to relevant (de-identified) information is one of the perks of being in an open and democratic society, to benefit the polity, to inform practice, and to provoke thought. The professionals who ensure that the numbers captured are as accurate as practically possible and adhere to standards enable some level of trust of their external validity (and their representation of and applicability to the world). The rigor ensures that those who come back to look at the data may identify some coherent and trustworthy data stories. (Figure 1)
Figure 1: Archived (Analog) Data (by Pexels on Pixabay with Pixabay license release)
This effort not only advances the potential use of archived data [to try to spark a movement to “analyze national and state databases” (p. ix)], but it works to bridge the extant research to applied practice, a long-identified gap. It may be that people do not read the research literature (given the Great Unread), do not translate the data into practice, do not agree with the ideological approaches, do not see an upside to engaging the data in practice, or some combination of these and other reasons. Collectively, the co-authors have plenty of expertise in the field of education in Texas, and their ideas are designed to promote increasing performance in the short-term, medium-term, and the long-term, to expand human potential as each class moves through the formal K12 education system.
Demographic Patterns in Access to Advanced Placement (AP) and International Baccalaureate (IB) Testing in American High Schools
Brian R. Flores, John R. Slate, George W. Moore, Frederick C. Lunenburg, and Wally Barnes’ “A Descriptive Analysis of Mathematics and Science Advanced Placement Course Taking and Performance: A Texas, Multiyear Investigation” (Ch. 1) focuses on a small (elite? ambitious?) group of learners, the few who avail themselves of the tests enabling advanced placement stateside and abroad.
In the opening, the co-authors set the context:
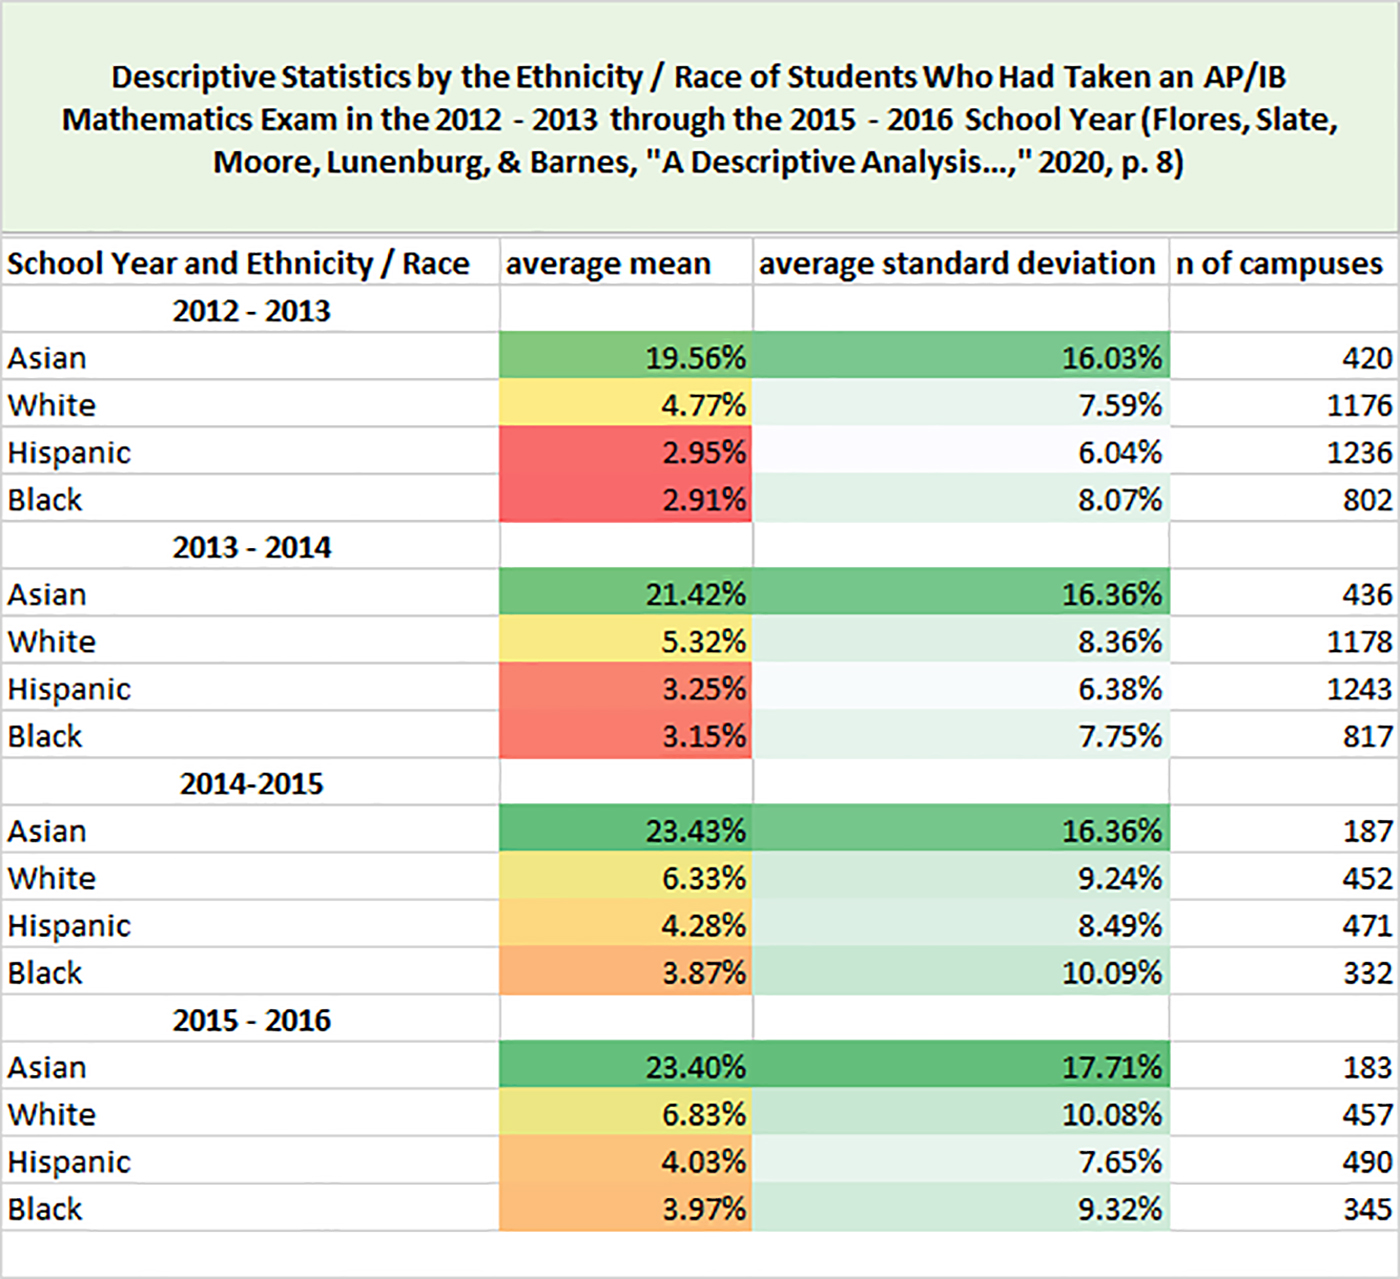
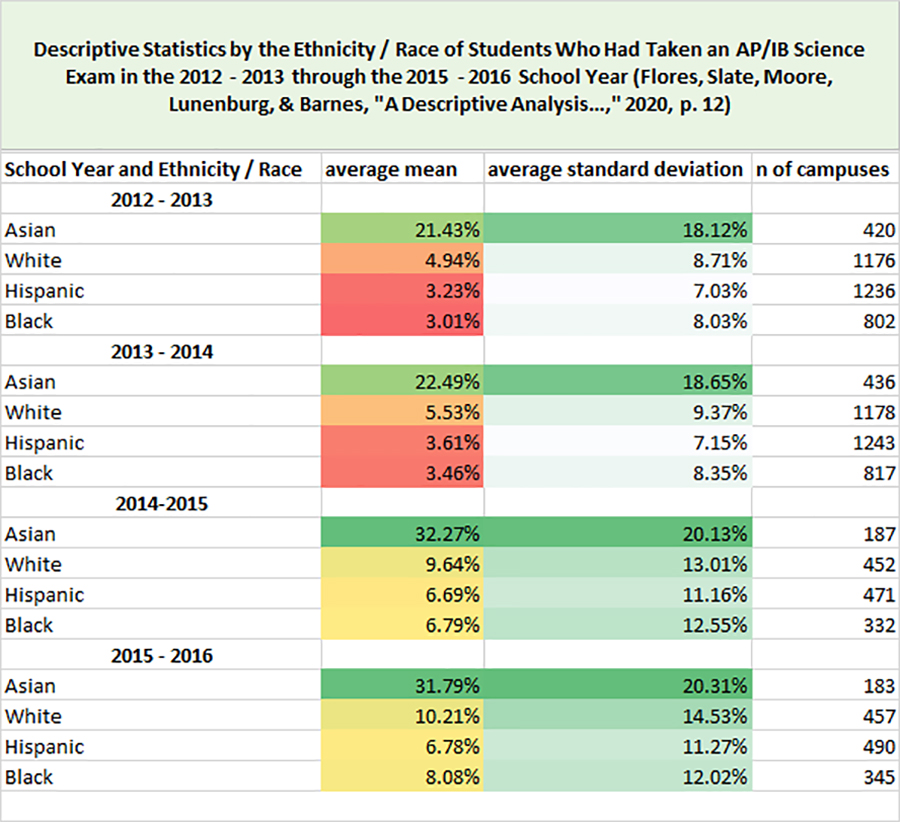
In this investigation, the AP/IB Mathematics and AP/IB Science exam course-taking and AP/IB exam performance of Asian, White, Hispanic, and Black students were addressed. Archival data were obtained from the Texas Academic Performance Reports and analyzed for the 2012 – 2013 through the 2015-2016 school years. Across all four school years, the percentages of students who completed an AP/IB Mathematics or an AP/IB Science exam were very low. Percentages of completion on an AP/IB Mathematics exam ranged from 19.56% to 23.43% for Asian students, from 4.77% to 6.83% for White students, from 2.95% to 4.28% for Hispanic students, and from 2.91% to 3.97% for Black students, respectively. Percentages of completion on an AP/IB Science exam ranged from 21.43% to 32.27% for Asian students, from 4.94% to 10.21% for White students, from 3.23% to 6.78% for Hispanic students, and from 3.01% to 8.08% for Black students, respectively. (Flores, Slate, Moore, Lunenburg, & Barnes, “A Descriptive Analysis…,” 2020, pp. 1 – 2)
The low numbers of participants of these tests is based in part on the fewer and fewer students taking advanced placement courses during the academic year, all signs of the diminishing STEM pipeline. This dynamic is observable in the lessening numbers of learners likely to stay the course with math learning:
In Grade 9, 58% of students took Algebra I, or a similar level course; however, as students progressed through high school, they were increasingly less likely to take a mathematics course. For example, only 46% of students in Grade 10 took Geometry, 39% of students in Grade 11 took Algebra II, and 16% of students in Grade 12 took other advanced mathematics courses (National Center for Education Statistics, 2018). In Grade 9, 76% of students took one of two science courses (i.e., Biology or Survey of Science); however, as students progressed through high school, their pattern of science course-taking decreased. In Grade 10, 51% of students took Biology, in Grade 11, 38% of students took Chemistry, and in Grade 12, 15% of students took Physics, 14% of students took Biology, and 13% of students took an advanced science course (National Center for Education Statistics, 2018). (Flores, Slate, Moore, Lunenburg, & Barnes, “A Descriptive Analysis…,” 2020, p. 2)
Getting on the more advanced track for learning has measurable positive impacts on college readiness. That students who take “advanced mathematics and science courses in high school have higher college assessment scores and are more college-ready than students who do not take advanced mathematics and science courses” (Flores, Slate, Moore, Lunenburg, & Barnes, “A Descriptive Analysis…,” 2020, p. 2). Being able to take higher level courses in higher education can save on time and tuition dollars, and the advanced learning open the way to higher level learning. In Texas, as of 2017, some 22,000 public high schools offer AP courses. In terms of the numbers of people who avail themselves of these opportunities, the co-authors write:
In Texas, mathematics participation in AP or IB exams by students in Grades 11 or 12 has only increased 0.3 percentage points from the 2013 – 2014 to the 2014 – 2015 school year. The percentage of Texas students who took at least one AP or IB mathematics exam in Grades 11 and 12 for the 2014 – 2015 school year was only 6.8%. Among the Grade 11 and 12 students who participated in at least one AP or IB mathematics exam, 27.1% were Asian, 8.6% were White, 4.7% were Hispanic, and 3.0% were Black (Texas Education Agency, 2017). Mathematics performance in AP or IB exams by students in Grades 11 or 12 decreased 1.9 percentage points from the 2013 – 2014 to the 2014 – 2015 school year (Texas Education Agency, 2017). (Flores, Slate, Moore, Lunenburg, & Barnes, “A Descriptive Analysis…,” 2020, p. 3)
Some of the findings for math (Figure 2) and science (Figure 3) may be seen in the redrawn excerpted tables.
Table 2: Descriptive Statistics by the Ethnicity / Race of Students Who Had Taken an AP / IB Mathematics Exam in the 2012 – 2013 through the 2015 – 2016 School Year (Flores, Slate, Moore, Lunenburg, & Barnes, “A Descriptive Analysis…,” 2020, p. 8)
Table 3: Descriptive Statistics by the Ethnicity / Race of Students Who Had Taken an AP / IB Science Exam in the 2012 – 2013 through the 2015 – 2016 School Year (Flores, Slate, Moore, Lunenburg, & Barnes, “A Descriptive Analysis…,” 2020, p. 12)
When looking at the proportions of learners who score sufficiently high to take AP / IB courses, there are many who do not take advantage of these courses and testing—either for lack of knowledge or encouragement or other factors. The gaps between the various students of differing racial-ethnic background suggest that there are advantages to be had in encouraging greater participation across the groups, to advantage the learners and society.
To promote both access and equity, high schools may identify actions to “provide better access and equity to students taking AP/IB mathematics and AP/IB science exams,” such as “support from the school Mathematics and Science teachers to offer additional tutorials and provide additional formative assessment, including diagnostic testing, to improve student attainment and success on AP/IB mathematics and AP/IB science exams” (Flores, Slate, Moore, Lunenburg, & Barnes, “A Descriptive Analysis…,” 2020, p. 16).
Familial Economic Status and Enrollment in Advanced Courses
Debra D. Creel and John R. Slate’s “Differences in Advanced Course Enrollment Percentages in Texas as a Function of Economic Status: A Multiyear, Statewide Analysis” (Ch. 2) examines the difference between learners with the benefit of relative financial stability to those without in terms of their enrollment in courses that are conducive to college studies. The economically disadvantaged are not in the minority: “59% of the total population of Texas students in Kindergarten through Grade 12, more than 3,100,000 students, were classified as economically disadvantaged” for the 2016 – 2017 school year” (Creel & Slate, 2020, p. 25). Approximately six of ten learners “qualified for the federal free lunch program or the federal reduced-price lunch program or other public assistance” (Creel & Slate, 2020, p. 22). Data from the Texas Academic Performance Report (2018) was analyzed in SPSS. Enrollment percentages for all students and for those whose families were in poverty were non-normal in distribution, so requiring the application of nonparametric statistical procedures.
An examination of the standardized skewness coefficients (i.e., the skewness value divided by its standard error) and the standardized kurtosis coefficients (i.e., the kurtosis value divided by its standard error) revealed large deviations from normality. All 16 standardized coefficients were far outside the bounds of normality of +/-3 (Onwuegbuzie & Daniel, 2002, as cited in Creel & Slate, 2020, p. 23).
A Wilcoxian dependent samples t-test “yield a statistically significant difference between the percentage of all students and the percentage of students who were economically disadvantaged who were enrolled in an Advanced Placement or International Baccalaureate course in English Language Arts in the 2014- 2015 school year, z = -23.26, p < .001. The effect size associated with this difference, Cohen’s d, was 0.16, below small (Cohen, 1988).” (Creel & Slate, 2020, p. 23)
Their analysis of student enrollment in Advanced Placement or International Baccalaureate courses [from 2014-2015 to the 2015-2016 school years] found statistically significant differences by student economic status: “Students who were economically disadvantaged also enrolled in Advanced Placement or International Baccalaureate Mathematics courses statistically significantly less frequently on average than all students in the 2014 – 2015 and 2015 – 2016 school years” (Creel & Slate, 2020, p. 19).
The researchers also suggest that those with “diverse” backgrounds also were less likely to enroll in AP/IB courses and pursue college preparatory course tracks. Their work begs the question of how well society integrates individuals of various backgrounds into the American polity, not only to ensure level playing fields but to advance society as a whole. The stakeholders of this information include “high school counselors, curriculum directors, and teachers of advanced courses” (Creel & Slate, 2020, p. 21), which suggests ways that counselors can better support learners to advance in the college track, curriculum directors can design learning experiences and sequences to be more inclusive and ambitious and challenging (and supportive), and teachers of advanced courses can support learners of various backgrounds. Such ideas are suggestive with the authors stopping short of direct advisement.
The results are caveated based on limits to the collected data:
Readers should review results of this study with caution, because the Texas Education Agency’s Texas Academic Performance Report (2018) data set for all students also includes the performance of students in poverty. Because the performance of students in poverty was statistically significantly lower than the performance of all students, the differences that were established in this investigation constitute an underestimate of the real differences that exist (Creel & Slate, 2020, p. 26)
Regardless, all stakeholders to the newer generations have limited windows of opportunity and resources to make a constructive difference in others’ lives.
College Readiness in Special Education Cohorts
Ann H. Lê and John R. Slate’s “Stagnant and Low College-Readiness Rates for Students in Special Education: Real Cause for Concern in Texas” (Ch. 3) also points to a long-known challenge, of how to meet the needs of learners in special education. Based on the data from the Texas Education Agency Texas Academic Performance Report for 2014 – 2015 and 2015 – 2016), researchers identified “very low percentages of these students who were determined to be college-ready, which ranged from a low of 6.91% to a high of 14.13% college-readiness” (Lê & Slate, 2020, p. 29), based on an analysis of reading and math skills, considered basic proficiencies (including others) for university studies. In the general academic literature, “overall college-readiness rates ranged from 31.11% to 41.81% (Lê & Slate, 2020, p. 30), so the challenge extends across learners in the U.S. Playing catch-up with courses results in a cost of time, tuition, and other costs, to try to close the college readiness gap.
Formally, in K12, learners in “special education” are those who are “any child aged 3 to 21 years old who meets specific Federal eligibility criteria (i.e., has both a disability and an educational need for provisions to their education or specially designed instruction) under one or more of the following federal disability codes: auditory impairment (AI), autism (AU), deaf-blindness (DB), emotional disturbance (ED), intellectual disability (ID) (formerly called mental retardation), multiple disabilities (MD), orthopedic impairment (OI), other health impairment (OHI), learning disability (LD), speech impairment (SI), traumatic brain injury (TBI), visual impairment (VI), and non-categorical early childhood (NCEC)” (Lê & Slate, 2020, p. 34). Given professional diagnosis and documentation, such learners receive appropriate accommodations and modifications to their educational programming. Even so, a small percentage of learners in special education programs are found college-ready at the end of the high school studies. Trend-wise, the researchers found college-readiness rates for those enrolled in special education “remained comparatively flat and unchanged for reading, mathematics, and in both subjects, across the two school years” (Lê & Slate, 2020, p. 37). A continuing challenge involves what may be done to increase learner access to learning, in small ways and large.
The Affordances of “Class” for Learning Performance
Brian R. Flores, John R. Slate, George W. Moore, Frederick C. Lunenburg, and Wally Barnes’ “Economic Status Differences in Advanced Placement Performance of Texas Students” (Ch. 4) identifies an association between family “class” status and learner academic performance. Prior research has made the link between learner poverty and poorer academic achievements, including high school dropout vs. graduation, the inability to pursue undergraduate education (and the acquisition of bachelor’s degrees), and other measures, as compared to those of affluent peers. This study differentiated between learners based on a binary—whether the learners were in poverty or not (based on qualification for free or reduced price meals).
This research was conducted on learners From the subset of those who “took AP/IB exams (i.e., students who took one or more advanced level course and examination from six academic areas: English, History and Social Sciences, Mathematics, Computer Sciences, Sciences, and World Languages) and of the students who scored at or above the criterion on AP/IB exams (i.e., students who have valid AP scores in the range of 1 to 5 or valid IB scores in the range of 1 to 7 for at least one examination taken for the 2012 – 2013, 2013 – 2014, 2014- 2015,and 2015-2016 school years” (Flores, Slate, Moore, Lunenburg, & Barnes, “Economic Status…,” 2020, p. 48). The summary findings: learners who were economically disadvantaged were found to have taken AP/IB exams at lower rates and at statistically significant levels as compared to those not similarly disadvantaged (Flores, Slate, Moore, Lunenburg, & Barnes, “Economic Status…,” 2020, p. 49), albeit with variances across the respective studied years. To promote access and equity, various resourcing, policies, and practices may be applied at the respective high schools, with support from the state and nation.
Ethnic / Racial Differences in Post-Secondary Enrollment after High School
“Ethnic/Racial Differences in Postsecondary Enrollment Rates of Texas Public High School Graduates: A Statewide, Multiyear Investigation” (Ch. 5), by Deshonta Holmes, John R. Slate, George W. Moore, Frederick C. Lunenburg, and Wally Barnes, suggests that there may be some factors that may affect whether majority vs. minority (quaint terms) learners have a level playing field in two-year and four-year public colleges and universities in Texas. The particular groups studied were for Black, Hispanic, and White students. One main finding: “White Texas public high school graduates enrolled in both 2-year and 4-year public institutions at statistically significantly higher rates than their Black and Hispanic counterparts. Moreover, Black and Hispanic students tended to enroll at 2-year public institutions at a higher rate then (sic) 4-year public institutions” (Holmes, Slate, Moore, Lunenburg, & Barnes, 2020, p. 57).
Historically, race/ethnicity has been a dimension that has shown disparities. In their review of the literature, the co-authors cite prior research: “Since 1995, 82% of White students were enrolled in one of 476 selective colleges whereas 68% of Black students and 72% of Hispanic students were enrolled in institutions with open admissions policies” (Carnavele, 2 016, as cited in Holmes, Slate, Moore, Lunenburg, & Barnes, 2020, p. 58). Strides have been made to create more opportunities for all peoples in the U.S. and abroad since then based on enlightened leadership, resourcing, policies and practices, learner recruitment and outreach, learner supports, and other efforts.
This work identified statistically significant differences between the respective groups in terms of enrollment patterns in postsecondary education, with Hispanic students lagging the other groups in terms of access to higher education. In addition, among all populations in the U.S., there are many who do not avail themselves of higher education even though they have the potential to thrive and learn effectively. The researchers here suggest that it would be important not only to support learners in attaining higher education across the various groups but to conduct qualitative studies to better understand postsecondary enrollment decisions of these high school students.
As to what the reasons may be for these disparities, social activists and researchers have suggested social biasing, cultural differences in considering education, social frictions, social competition, and other factors.
End-of-Course Examination Performance
Kenneth C. Fraga and John R. Slate’s “Differences in End of Course Examination Performance between Black and Hispanic Students: A Texas, Statewide Investigation” (Ch. 6) compares the final summative exams for Algebra I, English I, and Biology and resulted in the findings that “Hispanic students consistently performed better than Black students on eight of the nine performance indicators” (Fraga & Slate, 2020, p. 83); further, the data showed that both groups performed poorly on the English 1 End of Course exams (p. 83). The varying effect sizes of race/ethnicity were small. In the implications for policy, the researchers suggest a need to reevaluate the English 1 End of Course examination, such as by having a writing prompt focused on technology that may be biasing since those in lower SES families may have less access to technologies (Fraga & Slate, 2020, p. 91) and so lead to lower performance in ways that are non-representative of English I skills. (Such advisement shows sophistication in the analysis of the data and looking beyond superficial causes.)
Inequities in Disciplinary Actions
Another work explores the application of exclusionary discipline (in-school suspensions, out-of-school suspensions) on the middle school (Grades 6 – 8) male youth in Texas to see if there was equitable application of such sanctions on Black, Hispanic, and White youth.
John W. White, John R. Slate, George W. Moore, and Frederick C. Lunenburg’s “Inequities in the Number of Days Assigned to an Exclusionary Discipline Consequence as a Function of the Ethnicity/Race of Texas Middle School Boys: A Multiyear, Statewide Investigation” (Ch. 7) found “statistically significant differences in all four school years and at all three grade levels, with one exception” in the school data. They summarize some of their findings:
Black boys were assigned to an in-school suspension statistically significantly more days than were Hispanic boys and White boys. Hispanic boys were assigned statistically significantly more days than White boys. Similar results were repeated for out-of-school suspension, with the exception of Grade 7 Black and Hispanic boys who were assigned a similar number of days to this consequence in the 2012-2013 school year. (White, Slate, Moore, & Lunenburg, 2020, pp. 95 - 96)
Within the chapter are more specifics and nuances to their empirical data-based findings. Such research provides an additional sense of oversight on how middle schools work with their learners in all the complexities of growing up in the modern age, to add a layer of accountability. This work brings to mind the complex social, psychological, and other implications of such punitive actions and suggests that there may be other types of mitigations that may be applied to address such issues.
Disciplinary Alternative Education Program Placements
Another form of discipline that may be applied to middle school students relates to alternative education program placements. These are longer-term than various suspensions; the approach here is to send learners to different learner tracks than the mainstream learners. Edward L. Lopez and John R. Slate’s “Inequities in Disciplinary Alternative Education Program Placements by the Economic Status of Texas Middle School Students: A Multiyear, Statewide Investigation” (Ch. 8) uses three categories to define economic status: “Not Poor, Moderately Poor, or Extremely Poor.” In this study, the data for White, Hispanic, and Black students in Grades 6 – 8 from the school years from 2012 – 2013 to 2015 – 2016 were studied.
Using inferential statistical analysis, the team found the following: “A stair-step effect was present for each year and at each grade level. Grade 6, 7, and 8 White, Hispanic, and Black students who were Extremely Poor received statistically significantly higher rates of Disciplinary Alternative Education Program placements than their peers who were Moderately Poor and their peers who were Not Poor” (Lopez & Slate, “Inequities in Disciplinary…,” 2020, p. 119). Some cited studies refer to 10x higher application of discipline consequence for students in poverty vs. those not (p 120).
For this study, the government’s standards for eligibility for free or reduced lunches was used. Free lunches are available to those students with a family income of “130% or less of the federal poverty line, and as being eligible for the reduced-lunch program based on family incomes of 131% to 185% of the federal poverty line” (Burney & Beilke, 2008, as cited in Lopez & Slate, “Inequities in Disciplinary…,” 2020, p. 124) and the first group is considered Extremely Poor and the latter group as Moderately Poor. The researchers studied the frequency data using a Pearson chi-square procedure. They identified some patterns. For example, in the 2012-2013 academic year:
Grade 6 White students who were Extremely Poor were assigned to a Disciplinary Alternative Education Program placement almost five times more often than White students who were Not Poor. Grade 6 White students who were Moderately Poor were assigned to a Disciplinary Alternative Education Program more than two times more often than White students who were Not Poor. Grade 6 White students who were Extremely Poor were more than twice as likely assigned a Disciplinary Alternative Education Program placement than Grade 6 White students who were Moderately Poor (Lopez & Slate, “Inequities in Disciplinary…,” 2020, pp. 125 - 126).
They continue with the various learner groups (White, Hispanic, and Black; Not Poor, Moderately Poor, and Extremely Poor; and Disciplinary Alternative Education Program placement) through the respective academic years and the grades (6th, 7th, and 8th).
While most of the study involved the subgroups over the respective years, there was some integrated data analysis. The researchers write:
In all four school years, in all three grade levels, and for each ethnic/racial group, students, regardless of their ethnicity/race, who were Extremely Poor were assigned higher rates of Disciplinary Alternative Education Program placements than their peers who were either Moderately Poor or Not Poor (Lopez & Slate, “Inequities in Disciplinary…,” 2020, p. 141).
The data show who (broadly) is being sanctioned but not why, so without the color of unique details and cases (especially given learner privacy protection rights). This work aligns with prior research that found inequities in “the assignment of discipline consequences” (Lopez & Slate, “Inequities in Disciplinary…,” 2020, p. 146). This work deals inherently with intersectionality issues of learner identities and multiple potential biases.
The co-authors make a clear-cut case for disparities in the uses of DAEPs, but there is little in the way of in-depth policy and practice suggestions. This light-handed approach is typical of the chapters thus far, and it may be an editorial strategy to leave the various potential policy responses open, general, and undefined, in order to enable localized problem-solving. Another challenge is that while there are associations between the various variables and outcomes, it is unclear what the potential causes and effects and other mechanisms may be.
Another chapter that directly follows examines the issue of exclusionary discipline as a factor of days assigned. Tim Harkrider and John R. Slate’s “Inequities in Days Assigned to Exclusionary Discipline Consequences by Economic Status: Even More Cause for Concern” (Ch. 9) found inequities between those non-poor and poor among male students in Grades 6 – 8 in the 2015 – 2016 school year in middle schools in Texas. The coauthors write: “Of note was that Grades 6, 7, and 8 boys who were economically disadvantaged were assigned to an in-school suspension over two times more than their peers who were not economically disadvantaged” (Harkrider & Slate, 2020, p. 149). For economically disadvantaged students, Grade 7 boys assigned to in-school suspension received 5.26 days while the non-disadvantaged received 3.96 days. (Harkrider & Slate, 2020, p. 157). It is hard to conceptualize how school administrators would directly apply the learning from such research except to be mindful of the need to be equitable and fair with all learners, given the emergent imbalances from decisions apparently made on a case-by-case basis.
Another dimension of this issue of punitive measures taken in middle school may be seen in Shara B. Schlitzberger, George W. Moore, John R. Slate, and Frederick C. Lunenburg’s “Inequities in the Reasons Middle School Boys were Assigned to an Out-of-School Suspension by their Ethnicity/Race and Economic Status: A Texas Multiyear Analysis” (Ch. 10). In this study, the researchers identified “violations of the local code of conduct” as the most frequent reason boys were assigned to an out-of-school suspension for two school years: 2003 – 2004 and 2013 – 2014 (academic years ten years apart) (Schlitzberger, Moore, Slate, & Lunenburg, 2020, p. 161). Beyond ethnicity/race and economic status, the researchers suggest that it may be important to understand “if inequities are also present in student discipline referral reasons” (Schlitzberger, Moore, Slate, & Lunenburg, 2020, p. 164). They found the following:
In this research investigation, Texas statewide data on all Grade 6, 7, and 8 boys who were assigned to an out-of-school suspension in the 2003 – 2004 school year were analyzed. A total of 118,163 Grade 6, 7, and 8 boys had been assigned an out-of-school suspension. Violations of the local code of conduct were the most common reasons as this category constituted 77.1% of the reasons that boys were assigned to an out-of-school suspension. Fighting/Mutual combat was the second most frequent reason boys received an out-of-school suspension. Serious/persistent misconduct was the third most frequent reason boys were assigned to an out-of-school suspension. The fourth most common reason…was permanent removal by the teacher. Controlled substance/drugs were the fifth most frequent misbehavior reason… (Schlitzberger, Moore, Slate, & Lunenburg, 2020, pp. 168 - 169)
Other follow-on issues include the following: “assault non-district employee, criminal mischief, tobacco use, terroristic threat, conduct punishable as a felony, assault district employee, alcohol violation, school-related gang violence, (and) truancy 3 to at least 10 unexcused absences” (Schlitzberger, Moore, Slate, & Lunenburg, 2020, p. 169).
By ethnicity/race groupings, different rationales came to the fore. The coauthoring team offer some examples: “Serious/persistent misconduct was the third most frequent reason for White, Hispanic and Black students, whereas permanent removal from the classroom by a teacher was the third most frequent reason for Asian students. Permanent removal from the classroom by the teacher was the fourth most frequent reason for out-of-school suspension for White, and Black students, whereas controlled substance/drugs were the fourth most frequent reason for Hispanic students and serious/persistent misconduct for Asian students” (Schlitzberger, Moore, Slate, & Lunenburg, 2020, p. 170). While this work showed simple descriptive statistics, the findings tend to be more intuitively understandable and intriguing. The researchers found intriguing patterns for the most frequent reasons boys in Grades 6 – 8 were suspended out-of-school based on their economic status as well (p. 173). Such findings may be suggestive of different focal areas and methods for supporting learners.
What about the placement of middle school girls (from Grades 6 – 8) of different ethnic and racial backgrounds (Black, Hispanic, White, and Asian) and their placement in Disciplinary Alternative Education Programs? Edward L. Lopez and John R. Slate’s “Clear Disparities in the Assignment of Disciplinary Alternative Education Program Placements for Texas Middle School Girls: A Statewide, Multiyear Study” (Ch. 11). Prior research suggests that inequalities by race/ethnicity in the application of Disciplinary Alternate Education Program (DAEP) placements for female learners varies across grade levels, with intensifications of inequalities at particular levels. This study looked at data from Texas public middle schools for the academic years 2012 – 2013 through 2015 – 2016. Some findings:
Grade 6 Black girls were assigned to a Disciplinary Alternative Education Program placement 11 times more often than Grade 6 Asian girls and five and a half times more often than White girls. Grade 6 Hispanic girls were assigned to a Disciplinary Alternative Education Program five and a half more times than Grade 6 Asian girls and more than two and a half times more often than White girls. Grade 6 Black girls w ere twice as likely assigned a Disciplinary Alternative Education Program placement than Grade 6 Hispanic girls. Grade 6 White girls were assigned to a Disciplinary Alternative Education Program placement twice as often as Grade 6 Asian girls. (Lopez & Slate, “Clear Disparities…” 2020, p. 188)
(And yes, the repeated terms and wooden phrasing and wordiness were part of the original text.) The researchers continue with the analyses of the learners in the 7th and 8th grades, with observations of racial/ethnic disparities in the application of DAEP placements.
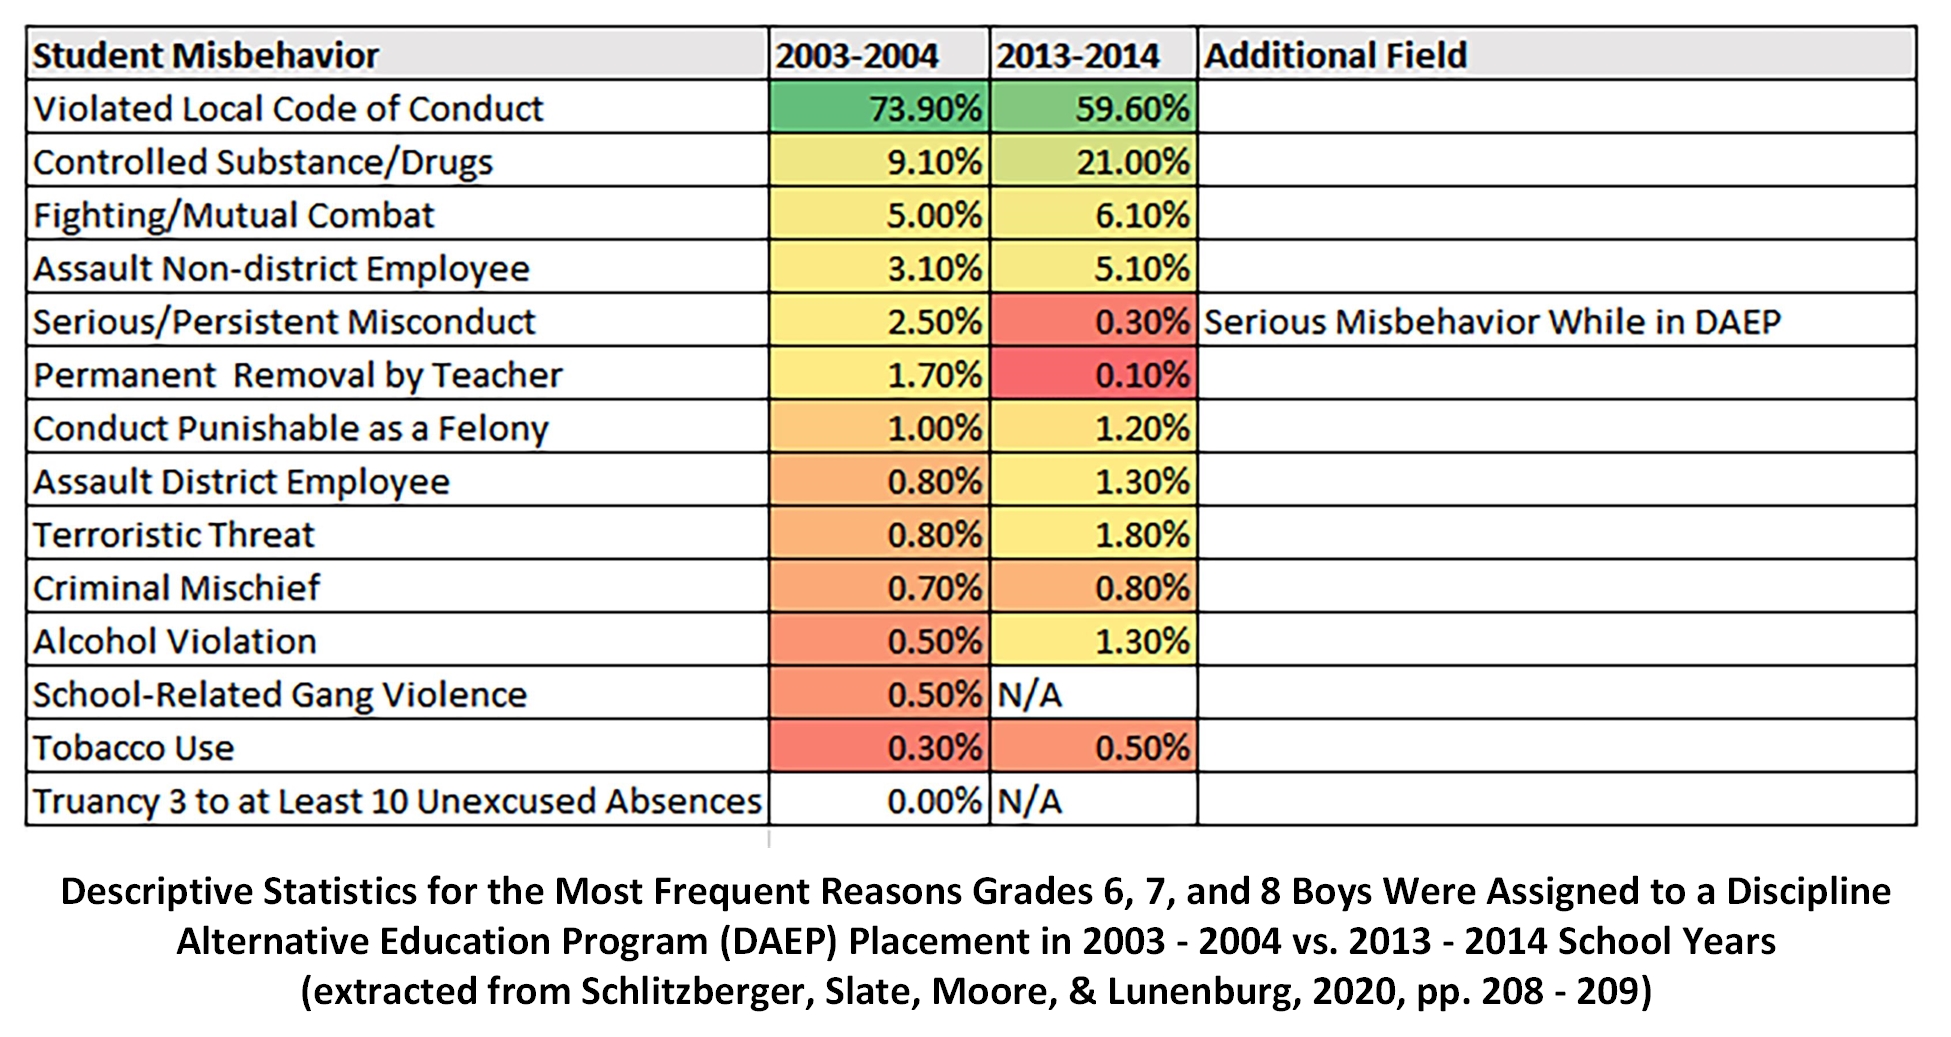
Shara B. Schlitzberger, John R. Slate, George W. Moore, and Frederick C. Lunenburg’s “Inequities in the Reasons Middle School Boys were Assigned to a Discipline Alternative Education Program Placement by their Ethnicity/Race and Economic Status: A Texas Multiyear Analysis” (Ch. 12) explores the differences in rationales for why middle school male students were assigned to DAEP placement, according to data from 2003 – 2004 and 2013 – 2014 school years, with some variations between the first dataset and the latter (time 1 and time 2). (Figure 4)
Figure 4: Descriptive Statistics for the Most Frequent Reasons Grades 6, 7, and 8 Boys Were Assigned to a Discipline Alternative Education Program (DAEP) Placement in 2003 - 2004 vs. 2013 - 2014 School Years (extracted from Schlitzberger, Slate, Moore, & Lunenburg, 2020, pp. 208 - 209)
Then, there are breakdowns of main reasons for DAEP placement by ethnicity/race and economic status, and other thin-slicing of the data and variances over the two academic years a decade apart. An essential premise is that while there may be some naturally occurring random variation in terms of alternative education program placement, beyond a particular point, there are more than chance factors at play in the assignments. And these assignments may indicate something of societal and other issues.
Effects of Family Economic Status on Students in Special Education in Various Learning Subjects
Matthew M. Pariseau and John R. Slate’s “Differences in Reading Performance Based on the Economic Status of Students in Special Education” (Ch. 13) asks a question of whether the economic status (in poverty or not) of learners in special education learning show discrepant reading performance. Based on inferential statistics, and reading performance indicators from the State of Texas Assessments of Academic Readiness (STAAR), the researchers found “the presence of statistically significant differences in all 3 STAAR reading measures by the economic status of students in special education,” with significant lower reading passing rates, based on the 2015 – 2016 school year data (Pariseau & Slate, 2020, p. 221). This work highlights some of the intersectionality around wealth and poverty effects on learners with special needs and their acquisition of learning.
A similar question is asked about Grade 4 students in special education in terms of math acquisition in Alexis N. Taylor and John R. Slate’s “Differences in Mathematics Performance by the Economic Status of Texas Grade 4 Students in Special Education: Should We Be Concerned?”(Ch. 14). Here, the researchers examining 2015 – 2016 school data in Texas found that “the higher the degree of poverty, the lower the passing rates were” on the STARR Mathematics exam for both boys and girls in special education (Taylor & Slate, 2020, p. 233).
Variant Acquired Social Studies Skills by Learners based on Economic Status
Mary K. Dietrich, John R. Slate, George W. Moore, and Frederick C. Lunenburg studied the “Differences in Social Studies Skills by the Economic Status of Texas High School Students: A Statewide, Multiyear Study” (Ch. 15). The main takeaways were the following: “Students who were not economically disadvantaged had higher average social studies scores in all five objectives than did their peers who were Moderately Poor and their peers who were Extremely Poor. Moreover, students who were Moderately Poor outperformed students who were Extremely Poor in all five social studies objectives” across the eight years of the data [2004 – 2005 through the 2011 – 2012 school years] (Dietrich, Slate, Moore, & Lunenburg, 2020, p. 245). The “stair-step” effect also showed some accumulation of effects over the years, suggesting the long-term implications of poverty on learning. The five objectives include history, geography, economics and social influences, political influences, and social studies skills. The poorer performance on social studies skills suggests challenges in terms of understanding and navigating a complex world beyond academia.
Learner Persistence … to Graduation based on Institutional Status (Original School or Transfer)
Richard M. Ballinger, John R. Slate, George W. Moore, Frederick C. Lunenburg, and Wally Barnes’ “Differences in 1-Year Persistence Rates by the Institutional Status of Texas 4-Year University Students: A Multiyear, Statewide Analysis” (Ch. 16) asks whether staying at an original four-year university where learners originally enrolled vs. transferring to another has an effect on one-year persistence rates. Here, researchers studied the one-year persistence rates of undergraduate students at four-year public universities in Texas (from 1999 – 2000 through 2013 – 2014 academic years). They found that the one-year persistence rates “were statistically significantly higher for Texas undergraduate students when they stayed (i.e., ranged from 56% to 64%) at the same 4-year university than when they transferred (i.e., ranged from 12% to 16%) to a different 4-year university” (Ballinger, Slate, Moore, Lunenburg, & Barnes, “Differences in 1-Year Persistence,” 2020, p. 269). The team also found other more nuanced associations in the data.
Prior research suggests that transfers are not uncommon and that many students decide to transfer to other institutions of higher education for various reasons, both endogenous and exogenous. For example, families may have to move for careers or family or economic reasons or combinations of reasons. An important understanding is that there may be a learning persistence cost in the move, potentially due to a variety of reasons—due to adjustments and other challenges. Transfers between universities are sometimes not without cost to the target goal of persistence and retention.
Graduation Rates by Race among Community College Learners in Texas
Sheldon Moss, John R. Slate, George W. Moore, and Frederick C. Lunenburg’s “Differences in Graduation Rates between Texas Black and White Community College Students: A Statewide, Multiyear Analysis” (Ch. 17) uses graduation rates as a measure of learner persistence, a point of achievement. Using state data from the 2007 – 2008 through the 2015 – 2016 academic years, the researchers applied inferential statistics to explore patterns. They found “statistically significant differences, with large effect sizes, in graduation rates between Black and White students…with the average graduation rates of White students…almost 15% higher than the average graduation rates of Black students” (Moss, Slate, Moore, & Lunenburg, 2020, p. 291).
Community colleges are lower-cost than four-year institutions of higher education as a rule, and they offer fewer barriers of entry. They also tend to attract more non-traditional learners. Whereas four-year institutions often also focus on research, community college have central mandates that focus more on teaching and learning. The co-authors review some of the research on community colleges:
Although community college access has increased, graduation rates remain substantially low, particularly for students needing developmental courses to improve their proficiency in reading, writing, and mathematics (Scrivener et al., 2015). Community colleges continue to struggle with low completion rates because nearly half of all students enrolled drop out before completing the first year (Braxton, Hirschy, & McClendon, 2004). Of all the students enrolled in community college credit courses, only a small fraction will receive a degree (Linderman & Kolenovic, 2013). According to the College Board (2012b), nearly 50% of community college students across the nation will not graduate within 6 years. Schneider and Yin (2012) reporter that the graduation rates of 36% of community colleges in the United States were less than 15% (Schneider & Yin, 2012), as cited in Moss, Slate, Moore, & Lunenburg, 2020, p. 292).
From-life challenges affect learners in community colleges in their ability to complete their studies, in part. In the nine-year time span of the archival data by the Texas Higher Education Coordinating Board Interactive Accountability System, the graduation rates of Black students ranged from 29% to 34%, and that of White students from 43% to 46%, with between 69 - 71 Texas community colleges providing data over the years (Moss, Slate, Moore, & Lunenburg, 2020, p. 302).
One-Year Persistence Rates by Institutional Status of Hispanic Students
Do Hispanic students have higher one-year persistence rates if they stay at the same Texas four-year university or if they transferred to a different Texas four-year school? That is the question asked by Richard M. Ballinger, John R. Slate, George W. Moore, Frederick C. Lunenburg, and Wally Barnes’ “Differences in 1-Year Persistence Rates by the Institutional Status of Hispanic Students in Texas 4-Year Universities: A Statewide, Multiyear Investigation” (Ch. 18), in their analysis of data from four-year public universities from 1999 – 2000 through the 2013 – 2014 academic years. They found a statistically significant difference in the one-year persistence rates in all 15 of the studied years, with persistence “statistically significantly higher for Hispanic students when they stayed (i.e., ranged from 55% to 62%)” than if they transferred (12% to 17%) (Ballinger, Slate, Moore, Lunenburg, & Barnes, “Differences in 1-Year…,” 2020, pp. 309-310). [This work comes with an especially rich review of the literature.] In light of these findings, the researchers suggest that Hispanic students should be dissuaded against transfer to another institution of higher education during their studies, where practical.
One-Year Persistence Rates Differences of Black Students over Time
Kim R. Ingram, John R. Slate, George W. Moore, Frederick C. Lunenburg, and Wally Barnes’ “Total 1-Year Persistence Rate Differences of Black Students Over Time in Texas Community Colleges: A Statewide Investigation” (Ch. 19) identified consistent year-retention of around 53%, without too much variance (2020, p. 329). In this work, respective Texas community colleges are ranked with the highest retentions and the lowest of African American students year over year.
How Important is Principal Experience at Low- and High- Performing Elementary Schools?
Leadership is important in how organizations advance and function. So, too, in elementary schools and the leadership of principals in Chastity Simon and John R. Slate’s “Differences in Principal Experience at Low-Performing and High-Performing Elementary Schools: A National Analysis” (Ch. 20). In this work, researchers examine data to see if there are associations between student reading performance (outcome) in low-performing and high-performing elementary schools based on principal experience (where inexperienced principals are those with “less than 3 years of experience” and experienced ones are those with “7 or more years of experience”). [The numbers of years seem somewhat arbitrary, and it is unclear how those with the liminal 3 to 7 years of experience are regarded.] This chapter uses data from the Early Childhood Longitudinal Study-Kindergarten Class of 1998 – 1999 surveys.
Their main findings:
Low-performing schools with experienced principals (i.e., 7 or more years of experience) had statistically significantly higher percentages of their students who were proficient in reading than low-performing schools with inexperienced principals (i.e., less than 3 years of experience). In contrast, high-performing schools with experienced principals had statistically significantly lower percentages of their students who were proficient in reading than high-performing schools with inexperienced principals. (Simon & Slate, 2020, p. 347)
In a sense, high performing schools are often the ones best funded with a strong tax base of housing, and these can attract more experienced principal and teacher and other staff talent. The converse may be true for those with fewer resources. Principals are conceptualized as affecting the campus culture, attracting staff and retaining them, modeling prosocial and learning focused behavior, and other effects. Indeed, prior studies indicate the importance of principal tenure for student academic achievement (Simon & Slate, 2020, p. 348). On average, one in five principals leaves their positions annually. This high turnover occurs in part because “principals use schools that have a high number of students who are economically disadvantaged as gateways to transition into more desirable campuses” (Simon & Slate, 2020, p. 349). For many, they do not stay long enough for their work to take hold and build over time.
Principal experience is especially critical in “low-performing schools,” so “superintendents and other school officials who are involved in the selection, hiring, and assignment of principals” need to consider principal experience in the staffing of low-performing schools (Simon & Slate, 2020, p. 354). They should be efforts to lower principal turnover.
About Educational Benefit Usage by Different Learner Groups
Cassandra D. Boyd, John R. Slate, George W. Moore, Frederick C. Lunenburg, and Wally Barnes’ “Differences in the Perceptions and Uses of Educational Benefits between Hispanic Male and Female Veterans: A National Investigation” (Ch. 21) asks the question of how well services are accessed by different learner populations. This national investigation of data from the 2010 National Survey of Veterans finds “…Hispanic female veterans reported that (VA) educational benefits were statistically significant and more important in terms of degree attainment and career opportunities to them than was reported by Hispanic male veterans. More Hispanic female veterans indicated that they attended a teacher certification program compared to Hispanic male veterans” (Boyd, Slate, Moore, Lunenburg, & Barnes, “Differences in the Perceptions…,” 2020, p. 357). This work offers nuanced explorations of the multi-survey data. Based on the findings of this work, the researchers suggest “an internal audit or conducting student self-surveys…(to) identify the degree to which scholarships, loans, and campus employment options might be of high interest and readily available for Hispanic male veterans to change their perception regarding non-VA educational assistance. Such campus policies could aid in meeting the unique needs of Hispanic male student veterans who often report being first-generation and from lower social economic families, yet view educational benefits as not as important compared to Hispanic female veterans” (Boyd, Slate, Moore, Lunenburg, & Barnes, “Differences in the Perceptions…,” 2020, pp. 368 – 369).
Another study of national data related to the veteran population compares the experiences of Black and Hispanic male and female veterans in relation to educational benefits. The data is also from the 2010 NSV surveys by the U.S. Department of Veterans Affairs. In Cassandra D. Boyd, John R. Slate, George W. Moore, Frederick C. Lunenburg, and Wally Barnes’ “Differences between Black and Hispanic Male Veterans and Between Black and Hispanic Female Veterans in their Perceptions and Uses of Educational Benefits: A National Analysis” (Ch. 22), they explore how much veterans use educational benefits, which are part of their compensation package for their service. Discrepancies in access mean that many are not fully using their benefits (and also not their full personal and professional potential).
The researchers did find discrepancies. They summarize:
Through inferential statistical analyses, it was revealed that no Hispanic male veterans indicated that they attended a teacher certification program compared to responses by five Black male veterans. Of particular note, Black female veterans and Hispanic female veterans also shared similar percentages on all survey items (i.e., importance of educational benefits; taken college classes leading to a degree; attended business, technical or vocational school training; received a certificate or diploma; participated in an apprenticeship or job training; taken correspondences courses; taken flight training; received tutorial assistance, refresher courses, or deficiency training, and attended a teacher certification program. For example, low percentages of Black female veterans reported that they had attended a teacher certification program 2.6%, compared to 5.9% of Hispanic female veterans. (Boyd, Slate, Moore, Lunenburg, & Barnes, “Differences between Black and Hispanic…,” 2020, pp. 373-374)
Some of the implications include the provision of “additional college, career, or financial literacy counseling to overcome systemic and institutionalized discrimination” (p. 387). The co-authors suggest more efforts to portray teaching as a viable career option for male veterans, Black and Hispanic, since few explore those career paths.
Institutional Support Services by Community College for First-Time College Students
Ericka Landry, John R. Slate, George W. Moore, Frederick C. Lunenburg, and Wally Barnes’ “Differences in Institutional Support Services by Community College for First Time College Student Status: A National Analysis” (Ch. 23) examines the differences in the usage of institutional support services provided by community colleges by First-Time in College (FTIC) students vs. non-FTIC ones. The salutary finding was that FTIC students were more likely than non-FTIC students to use such services, including “academic advising and planning, peer and other tutoring, use of skill labs, use of computer labs, and use of student organizations” (Landry, Slate, Moore, Lunenburg, & Barnes, 2020, p. 393).
An exploration of gender differences in this target population found the following for male FTIC students:
With respect to the frequency of use of the academic advising and planning at the community college, the Pearson chi square procedure did not reveal a statistically significant difference at the conventional level of statistical significance, Χ2(3) = 128.06, p = .06, for male students by their FTIC status. Approximately 14% of male FTIC students indicated using academic advising/planning services Often, whereas 12% of male non-FTIC students reported using academic advising/planning services. More than 31% of male FTIC students responded they Rarely/Never used academic advising/planning services compared to male non-FTIC students, 36.9%. (Landry, Slate, Moore, Lunenburg, & Barnes, 2020, p. 403)
This research also explores the uses of peer or tutoring services, skills labs, computer labs, and other support services. For female FTIC students, the researchers found a statistically significant difference between this populations usage of academic advising services vs. female non-FTIC students (47% vs. 43%); further, 27.5% of female FTIC students reported Rarely/Never using academic advising and planning services vs. the female non-FTIC counterparts (at 33.9%) (Landry, Slate, Moore, Lunenburg, & Barnes, 2020, p. 405). Female FTIC students also described more interest in using academic advising and planning services, peer and other tutoring, skills labs, computer labs, and other supports than non-FTIC students (Landry, Slate, Moore, Lunenburg, & Barnes, 2020, pp. 406 - 407). These self-professed behaviors are suggestive of constructive positive sentiment towards such services and also knowledge of the available services on university campuses to benefit learners and their learning.
Programmatic changes may not only enhance the college learner experience for veteran FTIC learners of various genders but also increase their retention and persistence.
Teacher Performance
If retention of learners depends in part on teachers as friendly role models, and the mass of research suggests that this is so, then having such accomplished individuals is an important piece to the puzzle. Alan K. Moye and John R. Slate’s “Differences in the Percentages of Black Teachers by Academic Distinction Performances in Texas High Schools” (Ch. 24) examines “the degree to which the percentages of Black teachers at Texas high schools differed by Academic distinctions (i.e., Top 25% Student Progress Distinction, Top 25% Closing Performance Gaps Distinction, and Postsecondary Readiness),” and other accountability ratings. The researchers identified a statistically significant difference only for “Postsecondary Readiness Distinction,” specifically: “The percentages of Black teachers who were employed at high schools that did not meet this Postsecondary Readiness Distinction were statistically significantly signer, almost twice as high, than at high schools that met this distinction” (Moye & Slate, 2020, p. 415). There is value to having teachers who are demographically similar to the study body population. At the same time, it is important that learners reach their full potential in their high school education and that their schools achieve accountability metrics. What the findings mean here were not thoroughly explored (and may be beyond the purview of such a text).
Variance in Graduation Rates between International and White Students
Rami I. Alsakran, John R. Slate, George W. Moore, and Frederick C. Lunenburg’s “Differences in Graduation Rates between International and White Students: A Texas, Multiyear Examination” (Ch. 25) covers 12 academic years (2003 – 2004 through 2014 – 2015) and finds that in every year, a pattern has emerged:
International students had statistically significantly lower graduation rates than White students. The graduation rates of International students increased over the 12 academic years, whereas the graduation rates of White students remained relatively the same. Of note was that the graduation rates of the International studies (sic) were much more variable than the graduation rates of White students at Texas community colleges (Alsakran, Slate, Moore, & Lunenburg, 2020, p. 429).
Given this trend, what is of interest is how the team interprets this data, what they attribute the differences to, and what they suggest may be done to raise the success of the international students. Over time, too, the graduation rates were much more variable for international students than “White students” (Alsakran, Slate, Moore, & Lunenburg, 2020, p. 445). (Reviewer note: which is an unusual comparison instead of “native-born” students of all races. The conflating of “American” as a nationality with “White” as a race or ethnicity may also be highly controversial. In analysis of data, shorthand used in the asking of questions can be problematic if not fully thought through.) Are there challenges of acculturation on the part of the learners? Is this something about the care of international students? Are these challenges about pedagogical methods? How much is within the control of the schools?
About Supporting Learners in Texas
If social mobility requires access to higher education, and higher education requires a pipeline of learning development, how middle school and high school students are supported in their learning and development into young adults will be critical for both their well-being and achievement to full potential and for social advancement. How schools support access to pre-college level studies, how they ensure fair access, and how they avoid negative punitive approaches in the educational context will be critical for learner well-being.
Exemplars of Conducting Archival Data Analyses: A Collection of K-12 and Higher Education Studies focuses in on the meso- and macro-level data of postsecondary education in Texas. While Texas is known for many high achieving learners and industries, it also has some clear disparities in terms of learner experiences. The disparities found in Texas education data suggest many areas for improvement: in learner advisement, in technological access, in food programs, in resourcing education, in teacher training, and others.
Figure 5: The State of Texas
The stance of the contributors to this work is a prosocial one, to create a more egalitarian and democratic society, to see who is being privileged by systems and trying to extend opportunities to all, to lower the senses of the haves and the have-nots. The goals of leveling the playing fields in various ways are a major strength of this work. Advancement is not zero-sum, and it is not either-or, which people may forget. This collection is eminently readable and convincing, even though some parts of it seem a little too template-tized.
About Using Archived Data
The world is awash in data funded by various government entities in the U.S. and around parts of the world. The actual data collection, validation, and other processing require investments of human expertise, time, technologies, funding, and various resources. Data collection is part and parcel of regular work, and often, once the data is collected and initial usage has been made of it, the data go into deep storage. The approach here of accessing public datasets for a “new life” in other analytics is a positive one because it ends the “first and only usage” of otherwise-inert data. Combining various datasets strategically by blending datasets may also lead to powerful insights and perhaps even changes in how teaching and learning occur and what policies are applied.
Even with all due care in handling data, there is a lot that is not seen. For example, where the direct original researchers may have access to “color” and nuanced on-ground insights, going with the collected data is more limited. There is also unavoidably not just the reporting of statistics and numbers but the interpretive lens through which larger patterns are seen. Then, too, it is important to have in-culture understandings to enable applicable insights and ideas. The researchers in this work balance the need for going with empirical data and not over-claiming from what is available.
The work of extracting meaning from archived data is not easy, even as the researchers here make it seem so. After all, those who acquire the data may or may not include sufficient documentation of their research. Often, there are gaps in data, which introduces ambiguity. Those who make assertions from data also risk litigation based on their work and interpretive lenses. Exemplars of Conducting Archival Data Analyses: A Collection of K-12 and Higher Education Studies introduces some basic (even templated?) statistical approaches to data analysis. For some, it may leave them wanting more sophisticated techniques, perhaps some cross-referencing to other validated datasets, perhaps some machine learning to find data patterns, perhaps some alternate explanations.
Regardless, this collection lays the groundwork for others to request public data and to collaboratively extract statistical patterns and find additional meaning, to improve the world, based on empirical understandings. Apparently, the work is done without a priori hypotheses that are spelled out, but more with post hoc hypothesizing once the data has been explored through well-tested statistical means. Per the title, these “exemplars” may be more typical examples than “excellent models”.
Slate is a full professor in the Department of Educational Leadership at Sam Houston State University (Texas), where he teaches doctoral-level basic and advanced statistics courses. He has published over 500 articles in peer-reviewed journals and presented many times in international and national professional conferences. He has published ten prior books. There were no other professional biographical notes about the other co-authors. That said, they are part of a hardy group of analysts that are able to draw value and analytic depth from archived data.
About the Author
Shalin Hai-Jew works as an instructional designer at Kansas State University. Her email is shalin@ksu.edu.
Thanks to Nova Science Publishers for a review copy of this book.
| Previous page on path | Cover, page 15 of 18 | Next page on path |
Discussion of "Book Review: Basic Methods for Conducting Archival Data Analyses in K-12 and Higher Ed (in Texas)"
Add your voice to this discussion.
Checking your signed in status ...