Some Back-end Data from the K-State Mediasite Instance (for 2017)
By Shalin Hai-Jew, Kansas State University
To extend its online, F2F, and blended teaching and learning on campus, Kansas State University selected the Mediasite video platform (1) to support desktop screen capture, (2) to stream its videos, and (3) to manage its video holdings. Since Fall Semester 2015, Mediasite has been used in various ways. These applications include the following:
- faculty recording of lectures, demonstrations, labs, and trainings at their desks and in smart classrooms;
- student recording of videos for assignments;
- the sharing of videos on the Canvas LMS and on the Web and Internet; the embedding of videos in online surveys, e-books, and other venues;
- the creation of video channels for particular areas of study (and shared by multiple faculty and staff); and others.
Recently, with the approval of Scott Finkeldei (Director of the Office of Mediated Education), Brandon Utech, the Instructional Media Administrator over Mediasite, shared the backend data from January 2017 – February 2018 to see what could be learned.
Initial brainstormed questions. Some initial research questions asked—before viewing the data—were the following:
- How are people at K-State using the Mediasite platform?
- What are their habits in using this platform?
- Are there better ways to use the platform than the current use?
- What videos are those created using the Mediasite Desktop Recorder vs. those created using other video capture tools? How do they differ, and why?
- How accessible or inaccessible are the videos? (How many have accurate closed captioning? Or even closed captioning at all?)
- (What data is available?)
- What is the average length of a video? What is the min-max range of video lengths?
- What are the most common titles? The least common titles? Most and least common topics?
- What parts of campus are using Mediasite the most (By department? By college?)
This article highlights some of the basic available insights. This back-end data offers one informational channel, but users of Mediasite also have data analytics dashboards tailored to faculty needs about video uses related to their own videos and courses.
About Mediasite. Mediasite is a web-based utility that provides a range of media creation and media delivery services. Users may use the Mediasite desktop recorder to create video contents using laptops or even mobile devices. They can edit in a limited and non-destructive way on the platform. They can upload their own videos created with other video creation tools in compressed .mp4 format. They can upload .srt files to enable closed captioning of their videos on the platform. In terms of multimedia richness, the platform enables a two-channel capture of visual information (from a webcam and from the screen simultaneously).
The original creator of Mediasite is SonicFoundry, which was founded in 1991, and the company was later acquired by Sony Creative Software in 2003. The headquarters are in Madison, Wisconsin.
A light review of the literature. In the academic literature, “mediasite” is mentioned in linked video contents. It is also referred to in some cases of media-rich teaching, with evaluations of capabilities. One of the earlier published works describes Mediasite then as “a web communication and content management system” that may provide “visual reinforcement of what are otherwise textbook lectures” (Vasu & Ozturk, Nov. 2008, p. 528). One group observes Mediasite’s “audio and video quality, transmission reliability, and the ability to seamlessly integrate (for example) recorded material and slides” (Blundell & Lu, 2013, p. 7). Several years after the prior study, another team applauded how well Mediasite plays with other technologies (Wijtmans, Scholten, Boon, Kozak, Kurat, & van Muijlwijk-Koezen, 2016).
The waxing and waning of video usage—with spikes early in the term and then dropping off over time—has been observed by others. First webcasts garner more student attention than later ones. Learners tend to focus on “key segments rather than the entire lecture” (Suda, Bell, & Franks, Dec. 15, 2011). This behavior is understandable for learners who may have viewed a lecture live and then went to select sections to refresh their learning or to better understand new learning. Or it could be that learners are viewing videos for the first time and are going to the parts that are more informative or engaging and scrubbing through the boring parts. In viewing usage metrics on Mediasite, one author observes further:
Different plateaus within the different webcasts exist, with decreasing trends in between. Such plateaus are best visible during the long webcasts, and the jumps between two consecutive plateaus within a given webcast seem to correspond to when the students are asked to answer given questions in the online quizzes. (Demazière, Stöhr, & Adawi, Nov. 2015, p. 123)
In one research study, the researcher provided supplementary learning materials on both Mediasite and on the Blackboard LMS to see if there would be a grade difference for those accessing the materials in one source or the other, and he found a difference in higher grades in the course from accessing the Blackboard LMS materials (Alexander, 2013). What works for learners is important. Measuring learner preferences for how they access the materials that enable their learning is another area of interest (Suda, Sterling, Guirguis, & Mathur, 2014).
The backend event log data alone is not so informative, but it is important to use multiple sources, such as surveys and interviews along with log data, to understand student use of recorded lectures (Gorissen, van Bruggen, & Jochems, 2013). Their research questions included the following:
- “How do students use recorded lectures?
- How do students use recorded lectures according to their self-report?
- What actual usage of the recorded lectures can we derive from the data on the system and does that match with what students report?
- What usage patterns can we identify in both the reported and actual usage of recorded lectures by students?
- How can we facilitate the usage of recorded lectures by students?” (Gorissen, van Bruggen, & Jochems, 2013, pp. 23-24)
One study used a survey to understand how often learners accessed lecture recordings, based on five categories: very frequently, frequently, occasionally, rarely or never. That information was studied along with learner usage statistics on the Mediasite platform (Pilarski, Johnstone, Pettepher, & Osheroff, 2008).
While online video platforms enable asynchronous instructional delivery methods, some research has suggested that synchronous content delivery may be more effective in some cases. One team writes:
Students performed better on examinations that pertained to content that were delivered live. The average examination grade for live and synchronous course material was 72.2% and 62.2%, respectively. In the main campus, 81.5% of students preferred live lectures. In the satellite campus, 66.7% of students preferred synchronous education. Overall, students agreed that synchronous cases helped them prepare for graded assessments. (Sheth, Cowling, & Congdon, 2013, p. 381)
The Mediasite platform was also used in a study, which challenged the “no significant difference” insight about online vs. F2F learning. The authors found the following:
The purpose of this study was to compare the effectiveness of an asynchronous online platform and its traditional F2F classroom based counterpart in promoting deep learning or higher levels of learning according to Bloom’s taxonomy. Equivalency between the two modes of instruction was assessed using course grades as the outcome measure. The ANOVA results suggested that on-line education is comparable to classroom education at lower levels of abstraction (recollection) but as work progresses to higher orders of abstraction (application) significant performance differences arise that place on-line learners at a disadvantage. (Ross & Bell, July 2007, p. 1)
More specifically, in terms of basic knowledge acquisition, learners did well online. As the learning became more challenging and more was expected of learners, the authors found a difference:
However outcome differences arose when students were asked to apply, analyze, and synthesize information. While we show that higher level performance is positively correlated to use of course materials, completion of homework assignments, and prior academic performance, the learning environment continues to play a large and significant role in student performance. (Ross & Bell, July 2007, p. 9)
Some other research related to Mediasite has to do with visual pattern recognition in videos for salient and informative moments, among other aspects (Antani, Kasturi, & Jain, 2002).
A review of the literature did not turn up as much as I might expect for a tool that has been around for decades and which has a solid reputation. This light review of the literature sets the stage for the data visualizations. The following data visualizations were created from data tables downloaded from the K-State Mediasite platform. The data arrived as data tables with bi-monthly data: a table for data from the first of the month through the 15th, then a second one from the 16th to the end of the month. Some summary data was captured and available on the top sheet, and the features included data on Presentation, Folder, Catalog, Showcase, Presenter, User, and IP Address. (No data dictionary was found online, so some assumptions were made about the data based on the data label and the data captured.)
WHO is Served? Total Users
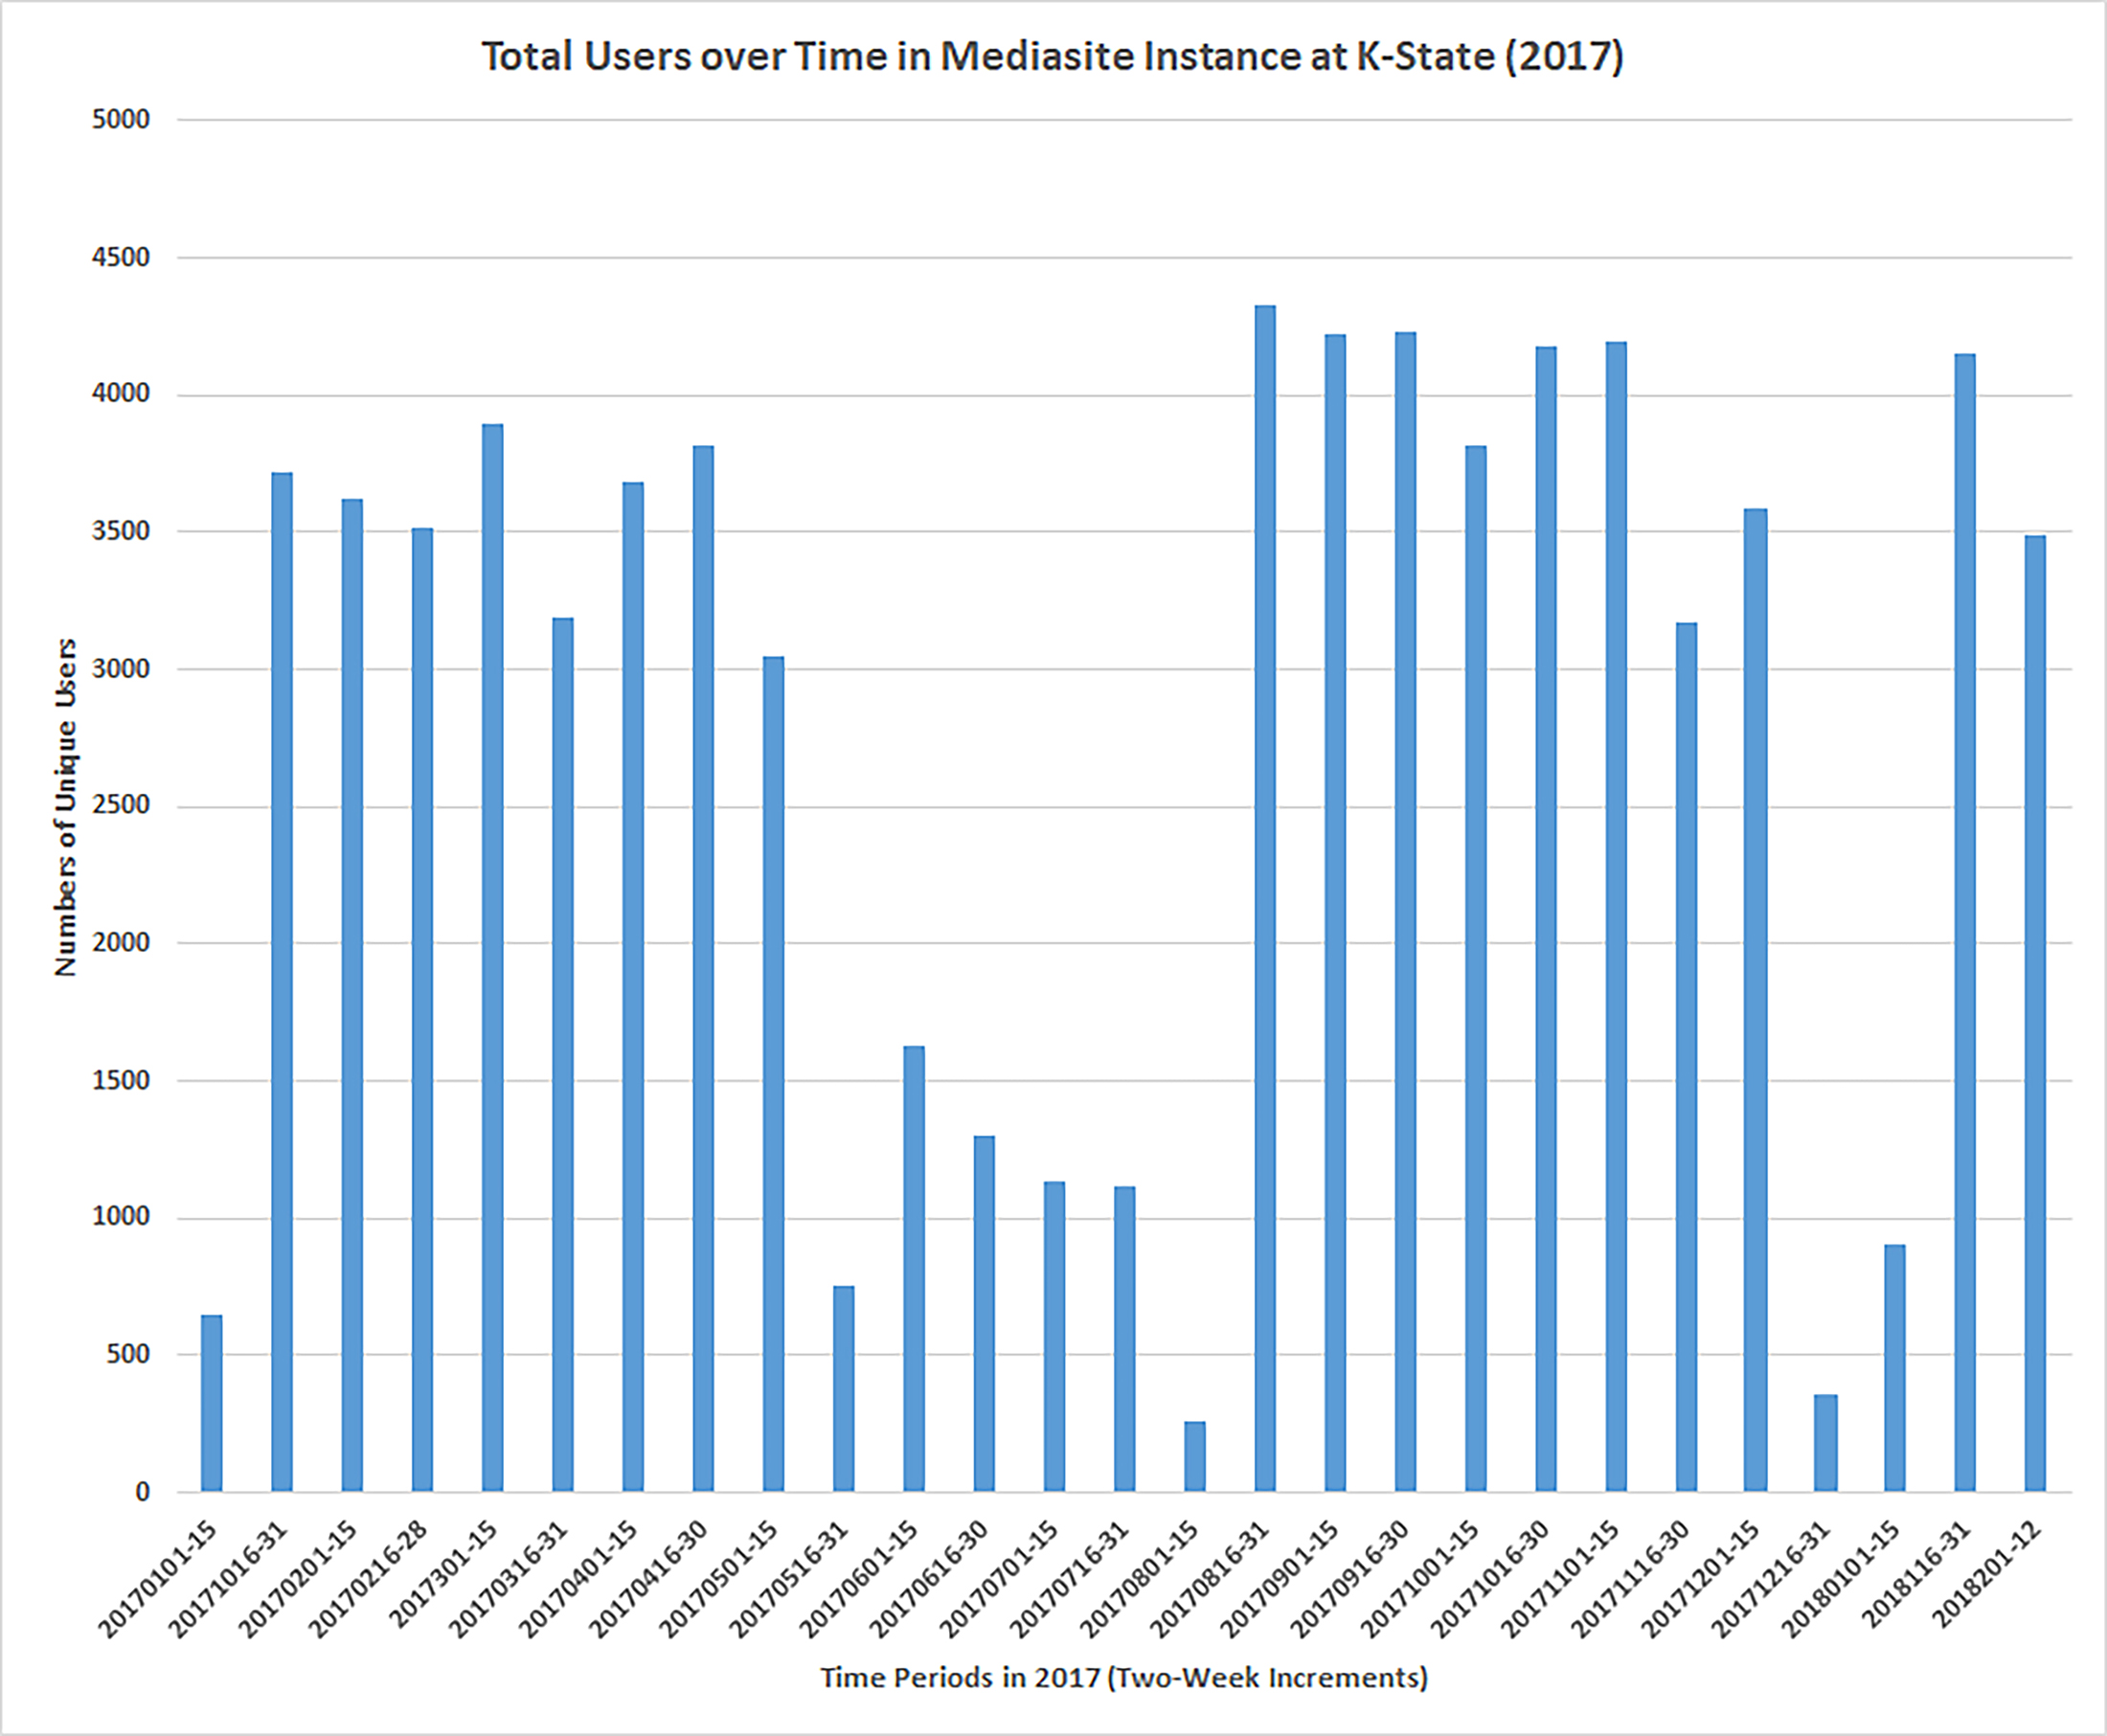
First, the “total users” number shows users accessing the media contents on the K-State instance of Mediasite over time during 2017. The total users are assumed to mostly be from the student body, but depending on where the links are shared, it is possible that there were users from around the world. One user may access a number of videos. “Total users” is understood as all the users who accessed contents, including returning users (who may / may not have been counted multiple times). If these are single counts of single learners, then only a small percentage of the total student population access Mediasite video (and certainly, not all faculty make videos that they host on Mediasite). If individuals have been counted multiple times, then the access rate by learners (as a percentage of the student body) would even be lower because then the total counts may be multiple listings for individual users.
Figure 1: Total Users over Time in Mediasite Instance at K-State (2017)
In Figure 1, the “Total Users over Time in Mediasite Instance at K-State (2017),” shows a time-based pattern that seems to align with the academic calendar, Fall Semester, Spring Semester, Summer Term, and intersessions. There is clearly a dip during summer session when enrollments are not as high as during the regular academic year. (Also, some faculty host their videos on social media platforms for video and image sharing, including YouTube, Vimeo, and Flickr, all of which have special educational channels as well.) The Total Users above are also mostly On-Demand Users. That latter term means that when people want to watch a video—at any time of day or night—they can do so “on demand.”
Live Users over Time
The other way to access video is as a “Live User,” who can watch a web stream of the event in near real-time. Figure 2 shows “Live Users over Time in Mediasite Instance at K-State (2017).” It is clear by the y-axis that there are very few who have used the live streaming feature, and it may be that this is a privilege that only a few have (or that this is in test phase). There seem to be insufficient data points to read too much into this web streaming currently.
Figure 2: Live Users over Time in Mediasite Instance at K-State (2017)
WHAT is on Mediasite?
Of the videos on Mediasite, the duration range goes from 0:00:00 to 4:04:38 (four hours, four minutes, and 38 seconds), and the average length is 31 minutes and 44 seconds. In terms of unique video titles, there were 15,737 unique titles.
Folders work as organizers of the videos. There were 1,285 unique folders in this instance at the time of the research, with an average of 12 videos per folder. The min-max range went from one video in a folder to 109. The area that seemed to have the largest numbers of unique folders were those in the College of Engineering. In terms of contents, the folders ranged from “AMETH Studies” to “Walk in My Shoes.”
It is possible to gain some insights from the listed video titles. A straight reading of these show that some are informational ("Control of Microorganisms," "Lahar - Fuego Volcano.") while others are less so ("AA_CH_64" or "FDSCI 695 Ch 17 Part C" or "Unit 2 - 7"). Some have titles that sound original (as in locally made), and others sound like third-party-created-contents used for a course.
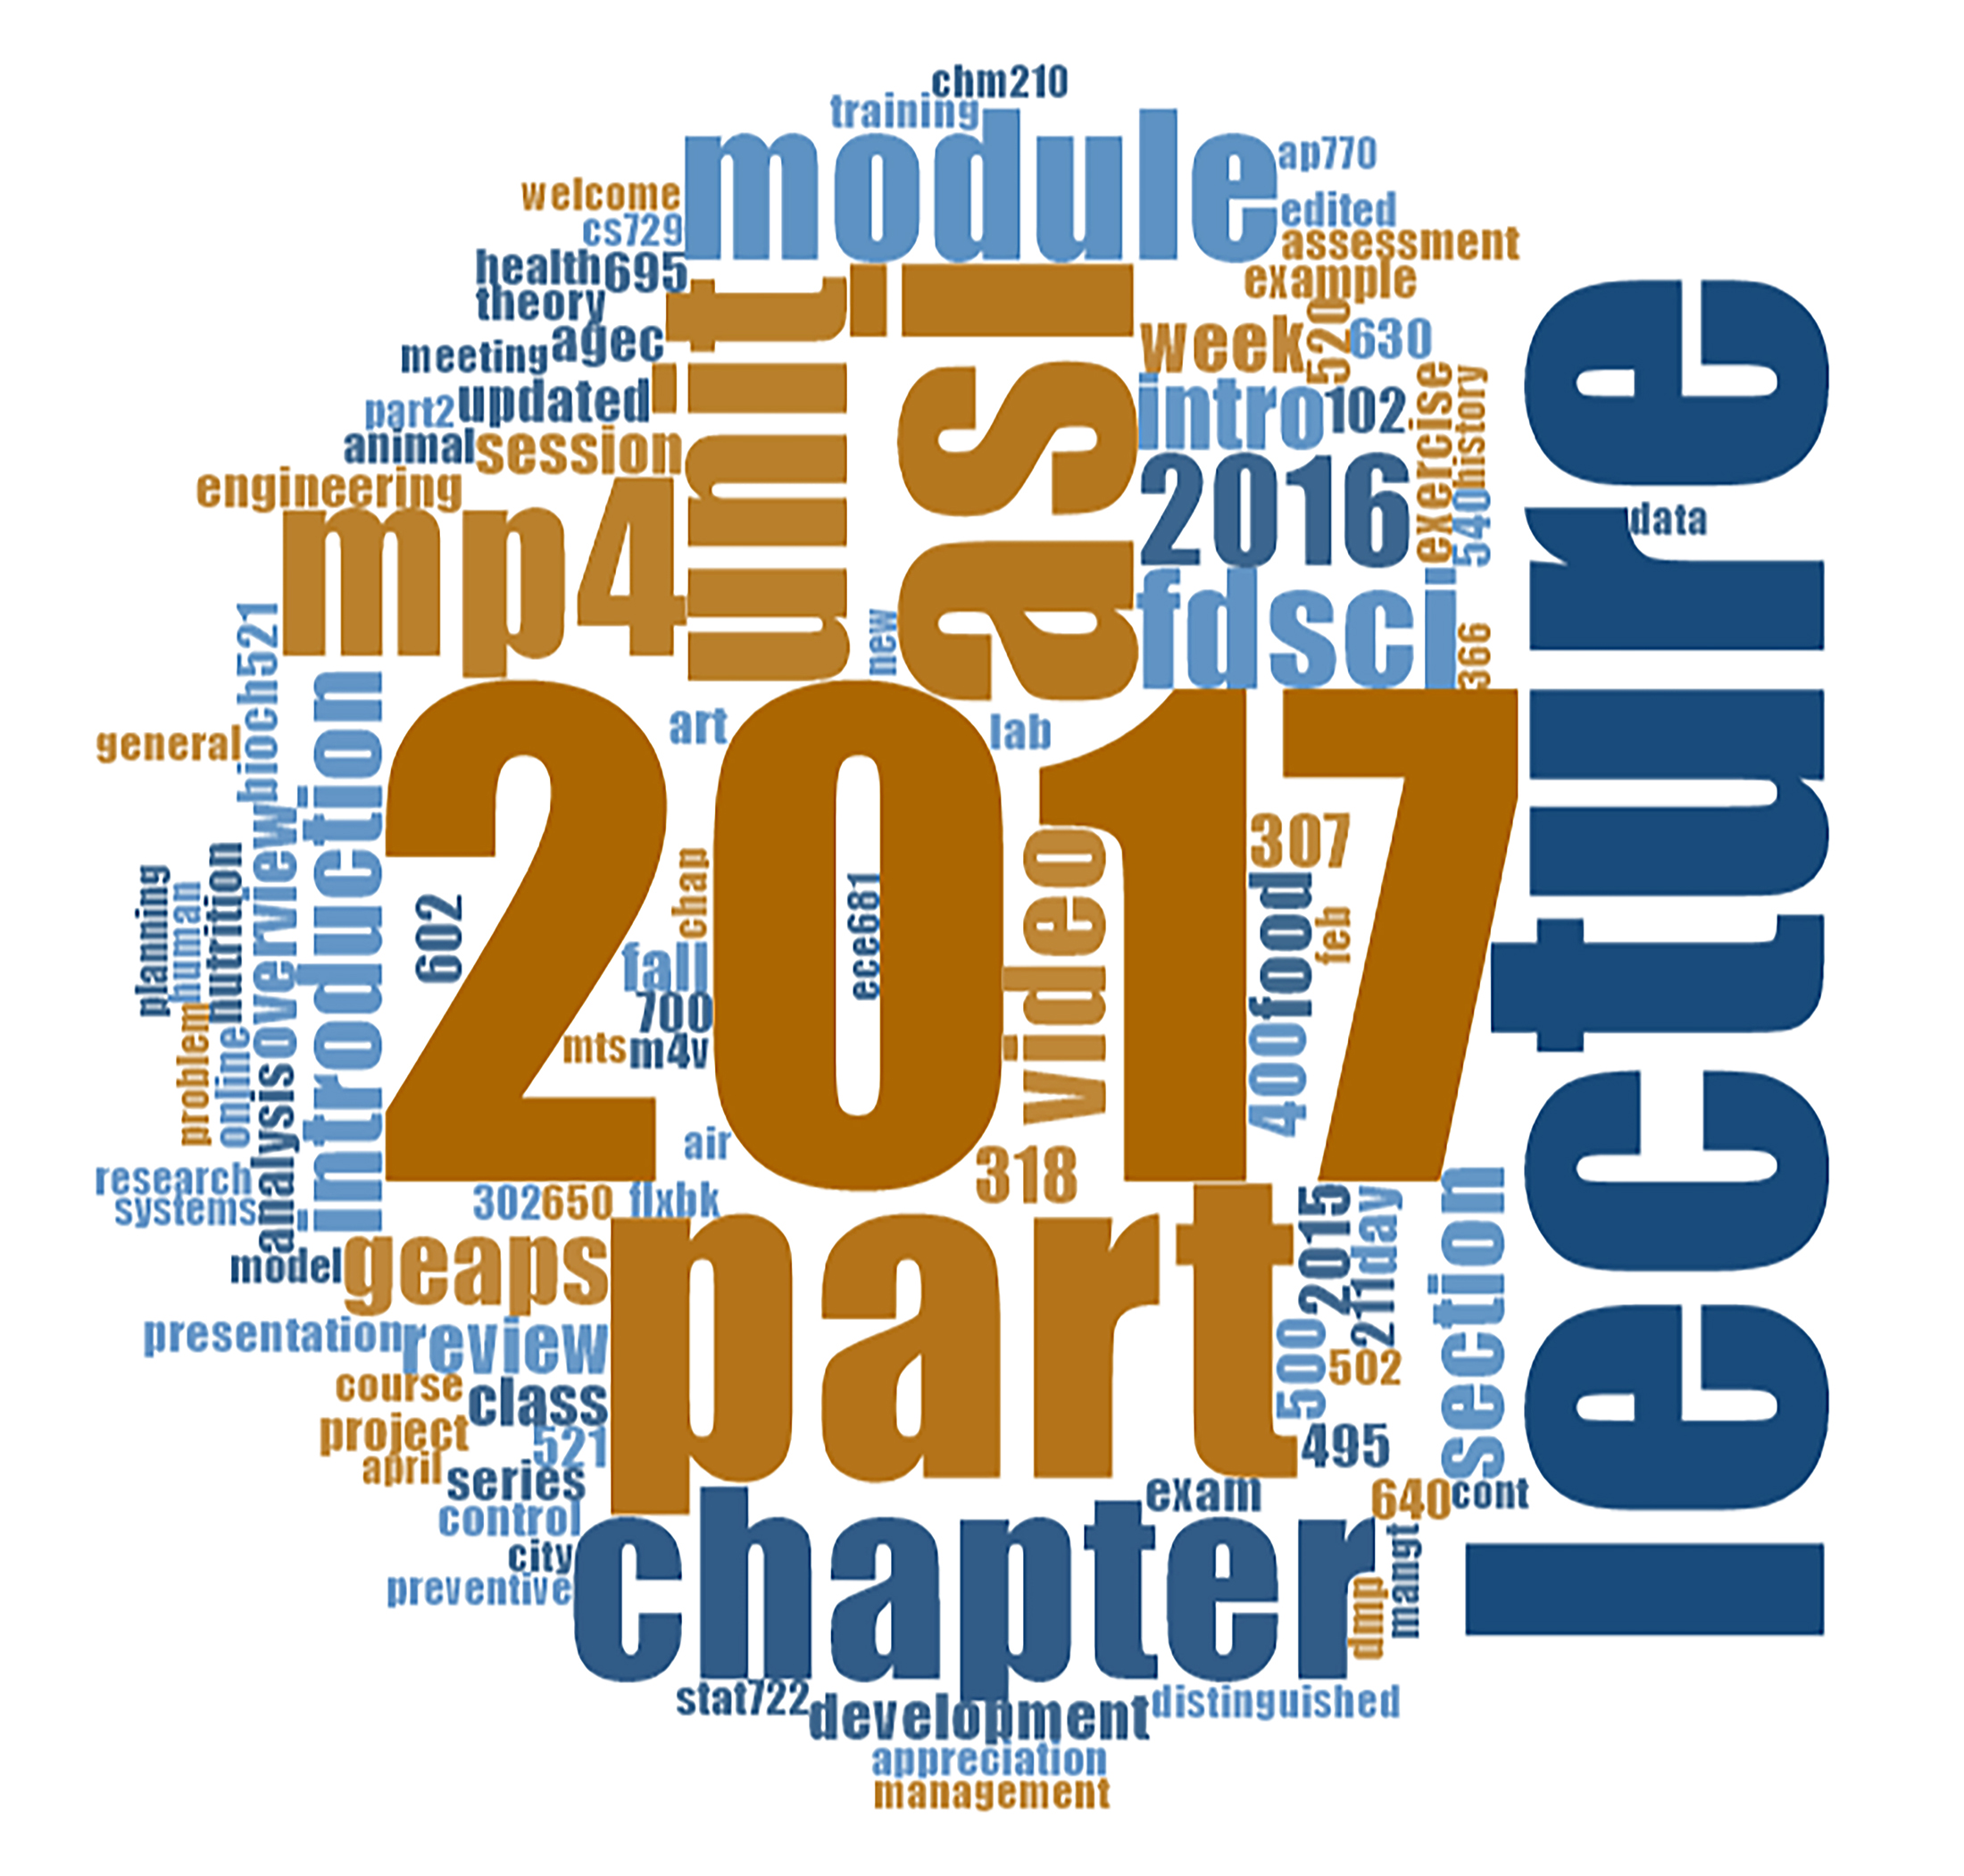
From a listing of the viewed videos, with the titles named (a video watched multiple times is listed multiple times), it is possible to extract a word cloud based on word frequency (Figure 3).
Figure 3: Word Cloud from the Video Titles in Mediasite Collection at K-State (2017)
An edited version of the prior word cloud was run albeit with dozens of words placed on the stopwords list. These include years, generic terms (lecture, chapter, part, module, .mp4, project, and so on). Numbers were mostly excluded as well. Course numbers were omitted. The idea was to limit the focus to programs and subjects (Figure 4).
Figure 4: Edited Word Cloud from the Video Titles in Mediasite Collection at K-State (2017)
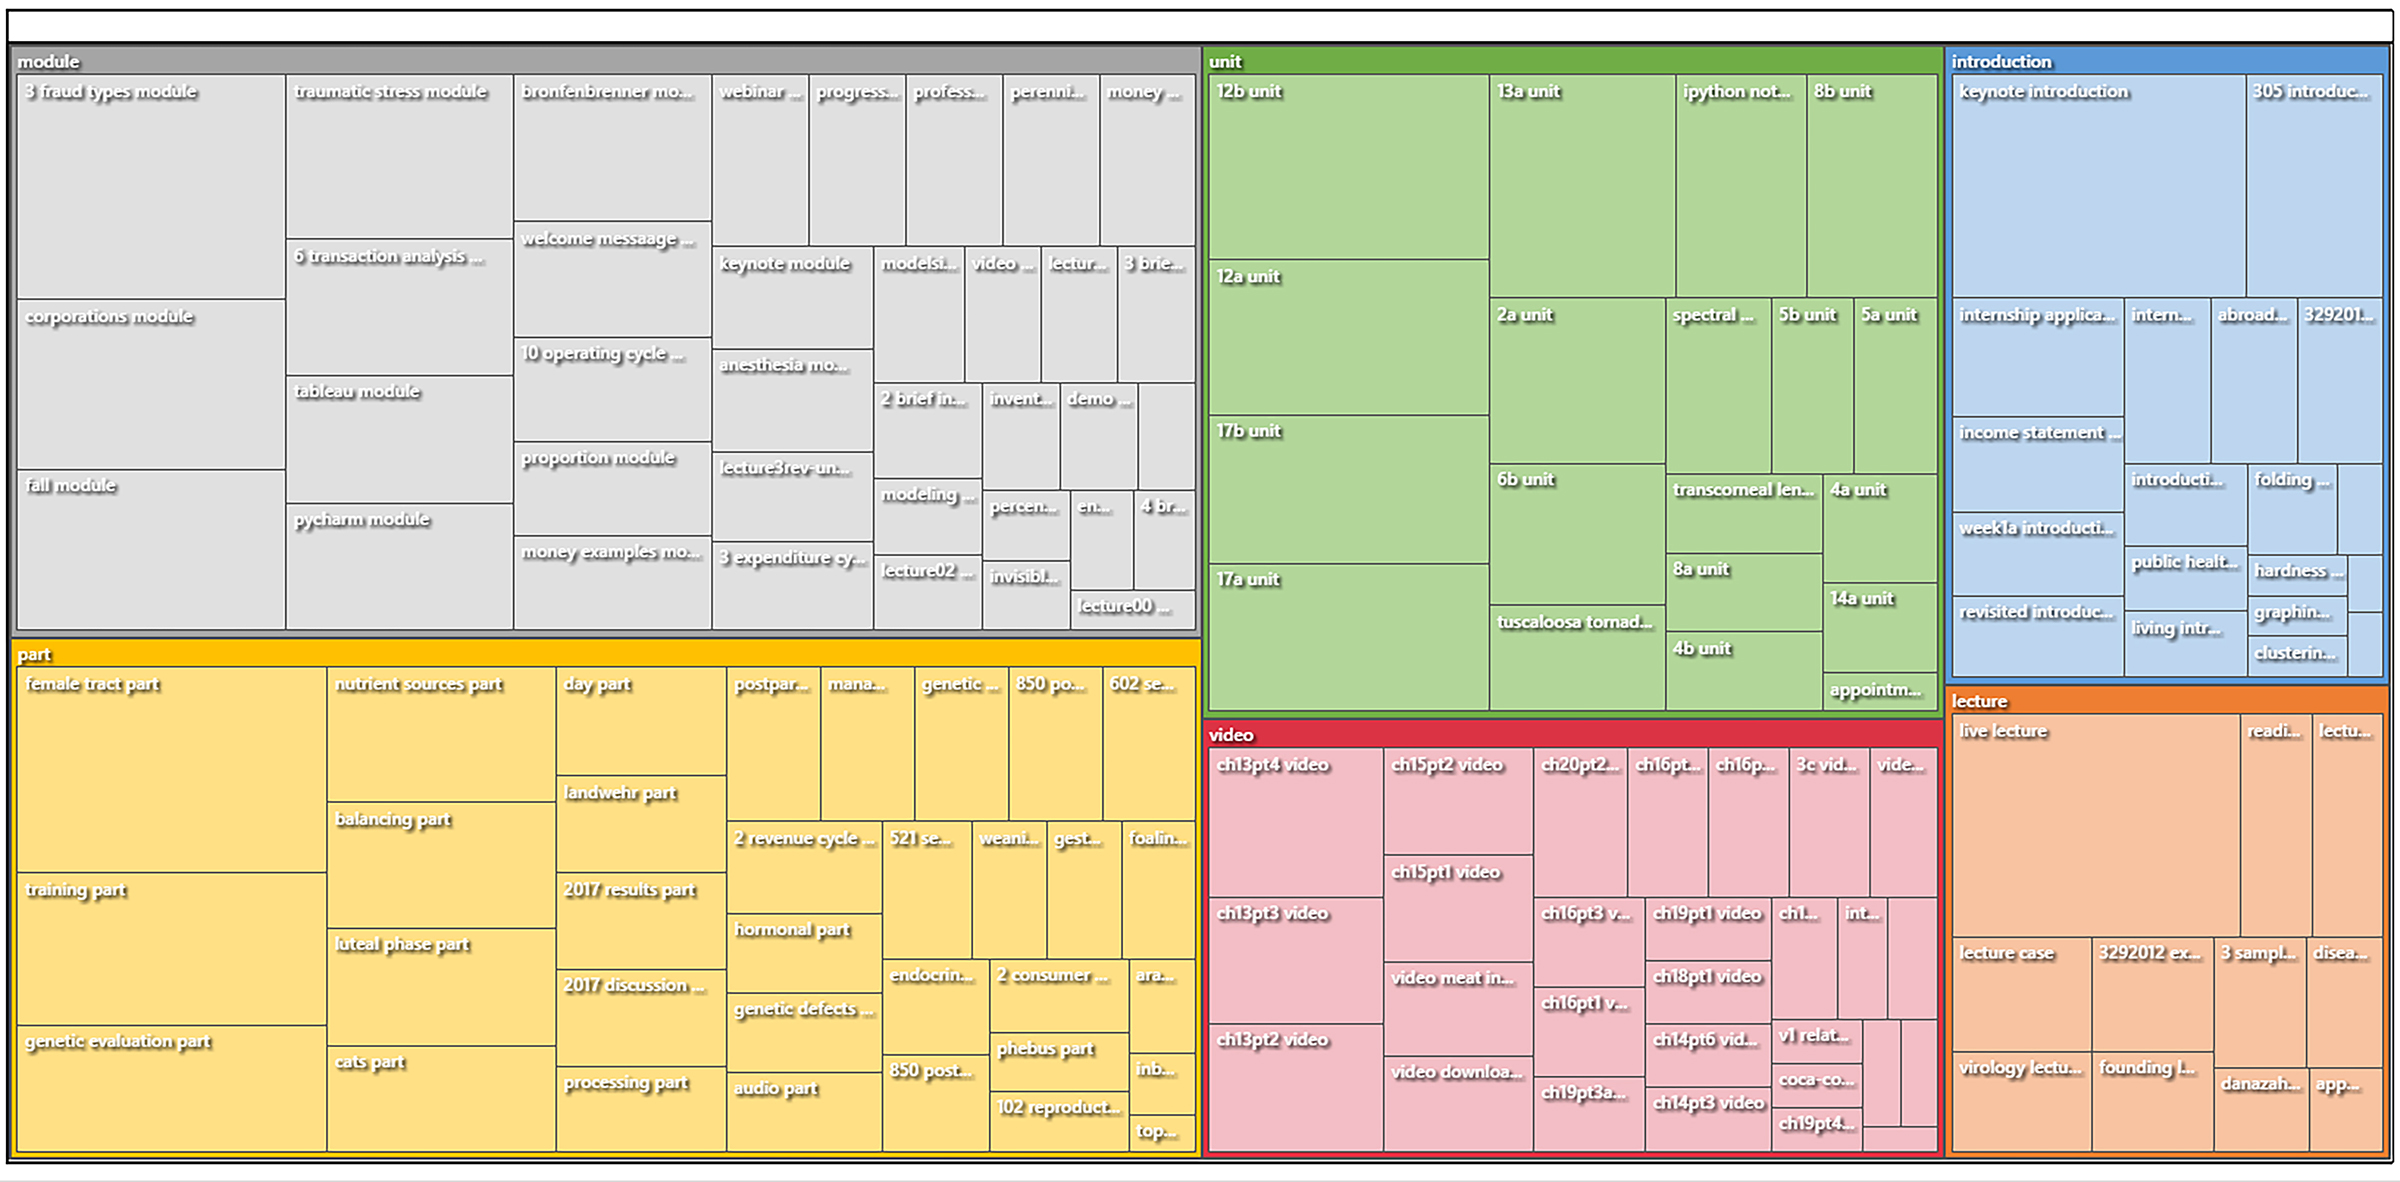
An autoextraction of topics identified top-level topics as the following: module, part, unit, video, introduction, lecture, and many other sub-topics below each (Figure 5).
Figure 5: Auto-Extracted Topics from the Video Titles in Mediasite Collection at K-State (2017)
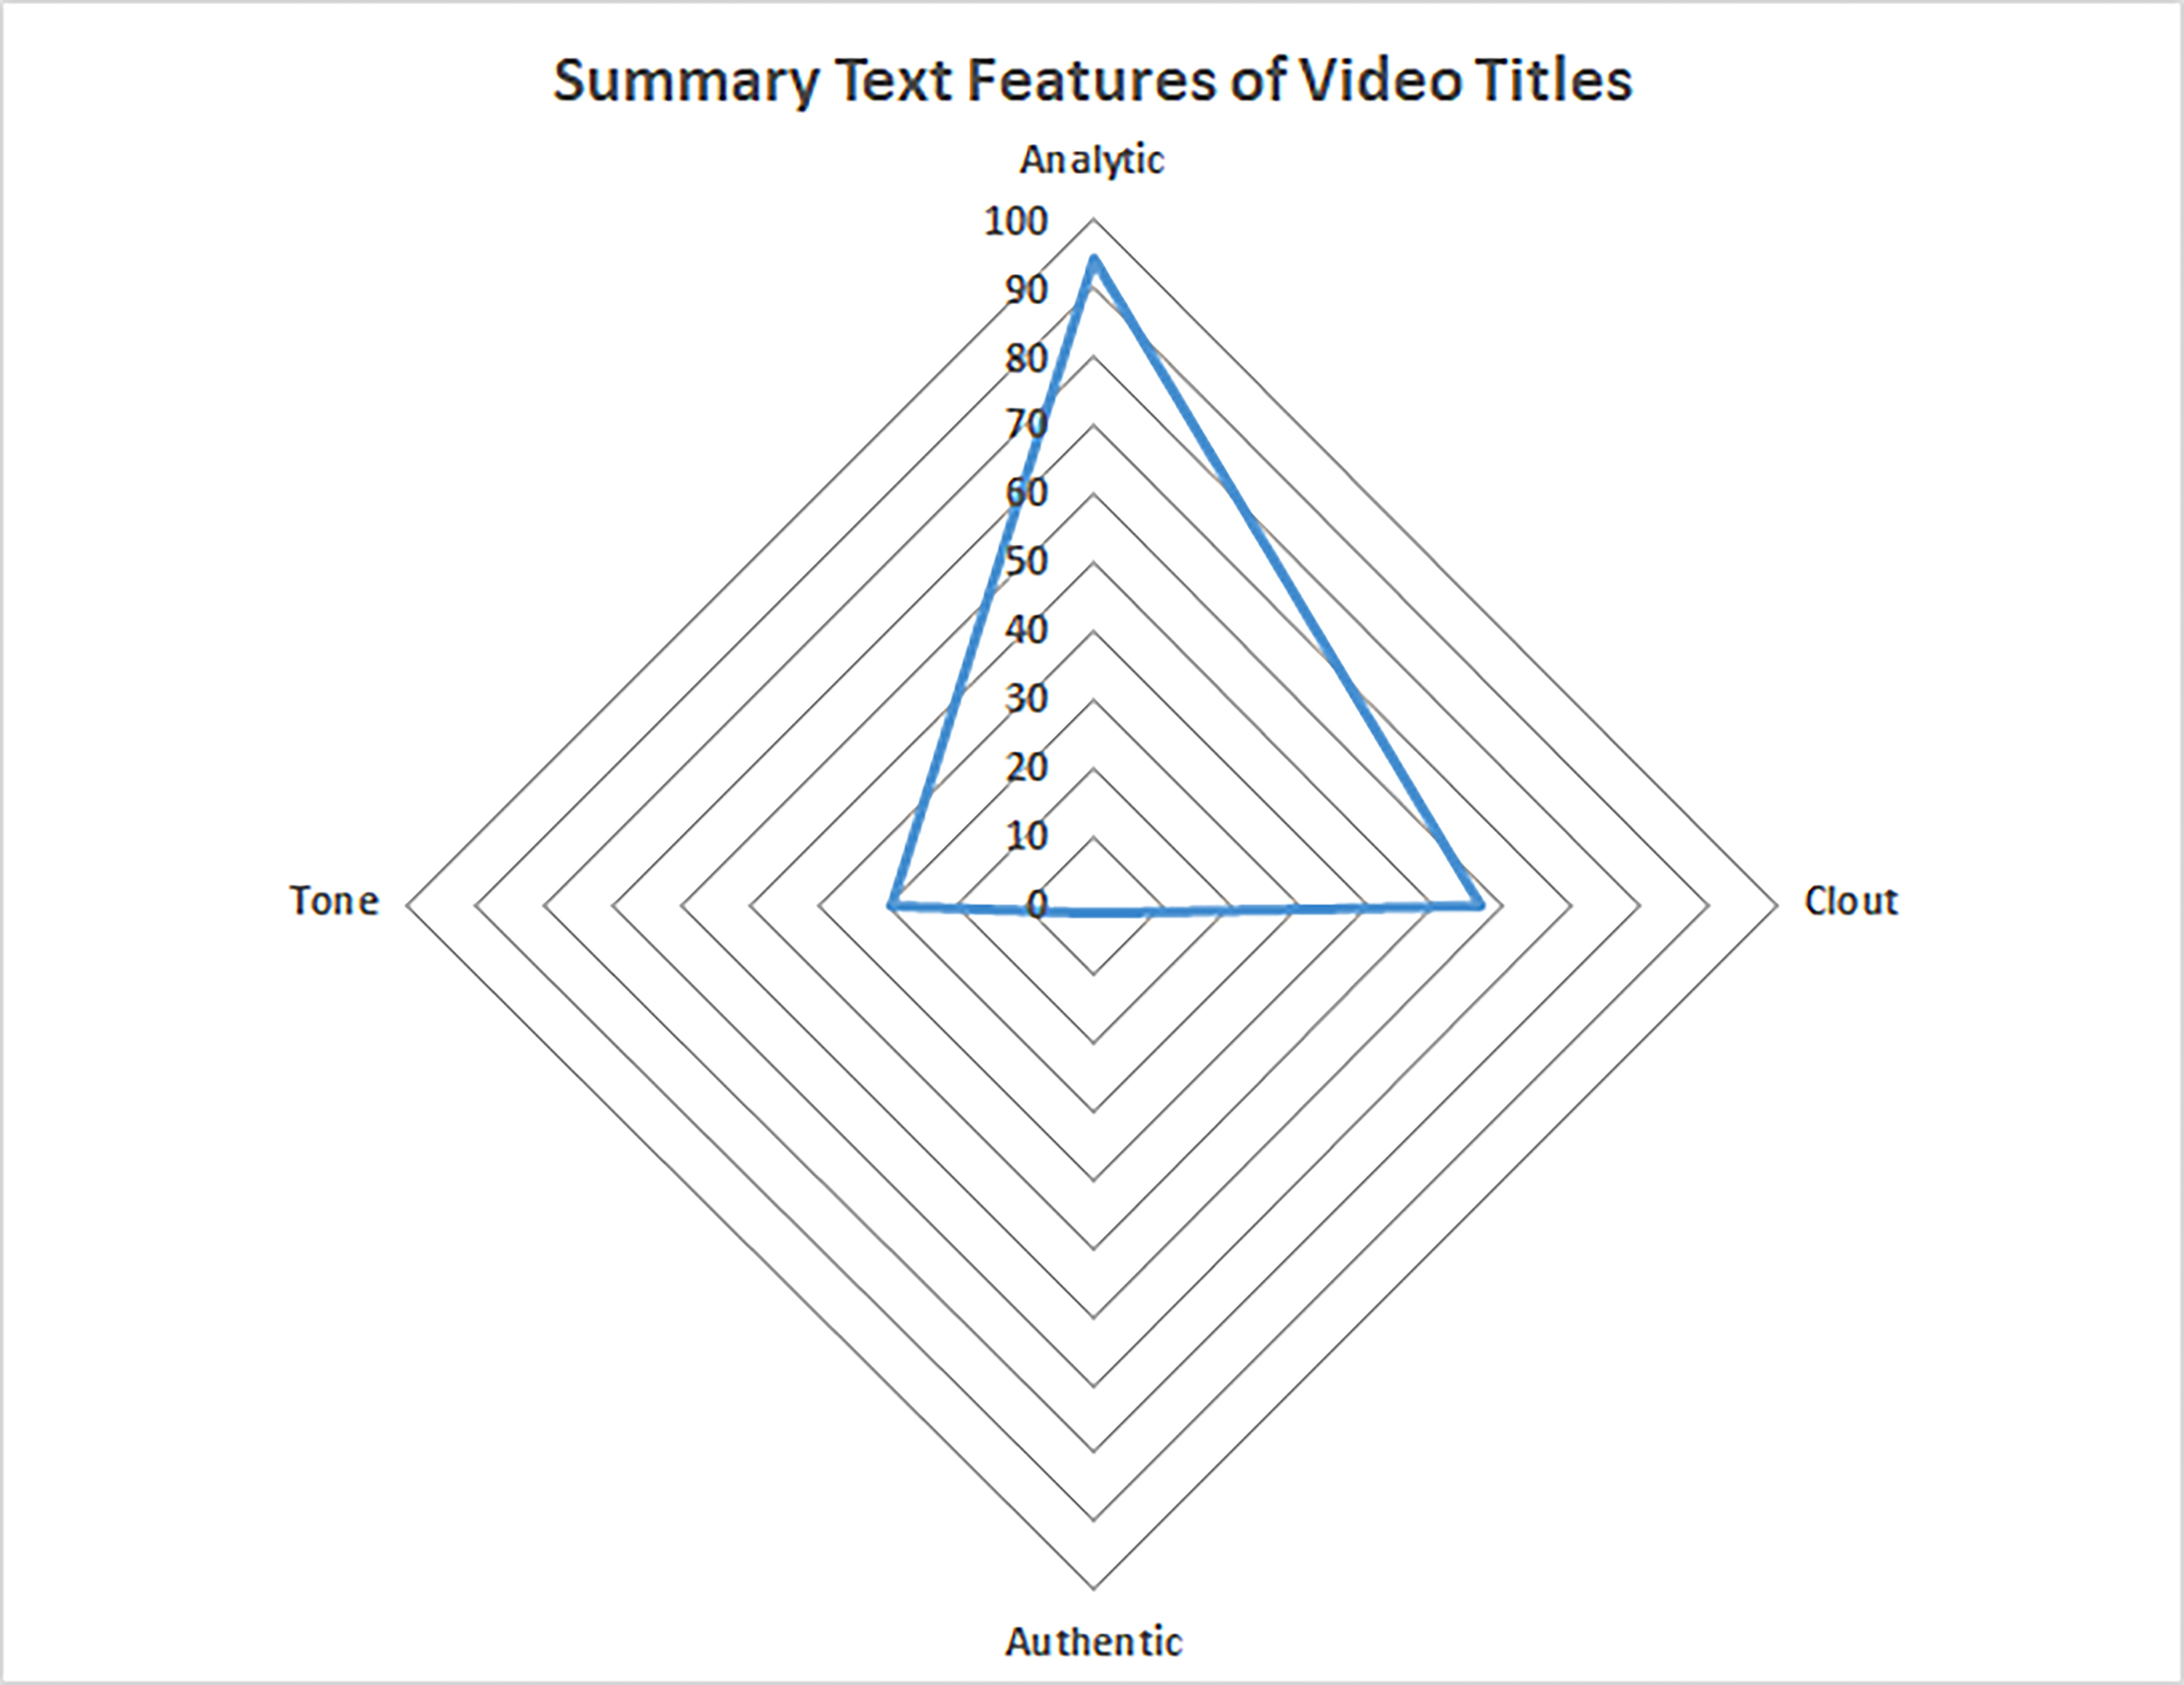
In a computational text analysis of the titles, they were found to be highly analytic (in the 94th percentile), medium on clout (57th percentile), low on authenticity or warmth (1st percentile), and trending negative on tone (sentiment) (30th percentile) (Figure 6).
Figure 6: Summary Text Features of Video Titles (Spider Chart)
It is possible, of course, to create word trees from focus words-of-interest to see the lead-up words and lead-away words to that target word or phrase. Word trees were run on “training,” “lab,” and “welcome,” to give a taste of the title contexts (Figures 7, 8, and 9).
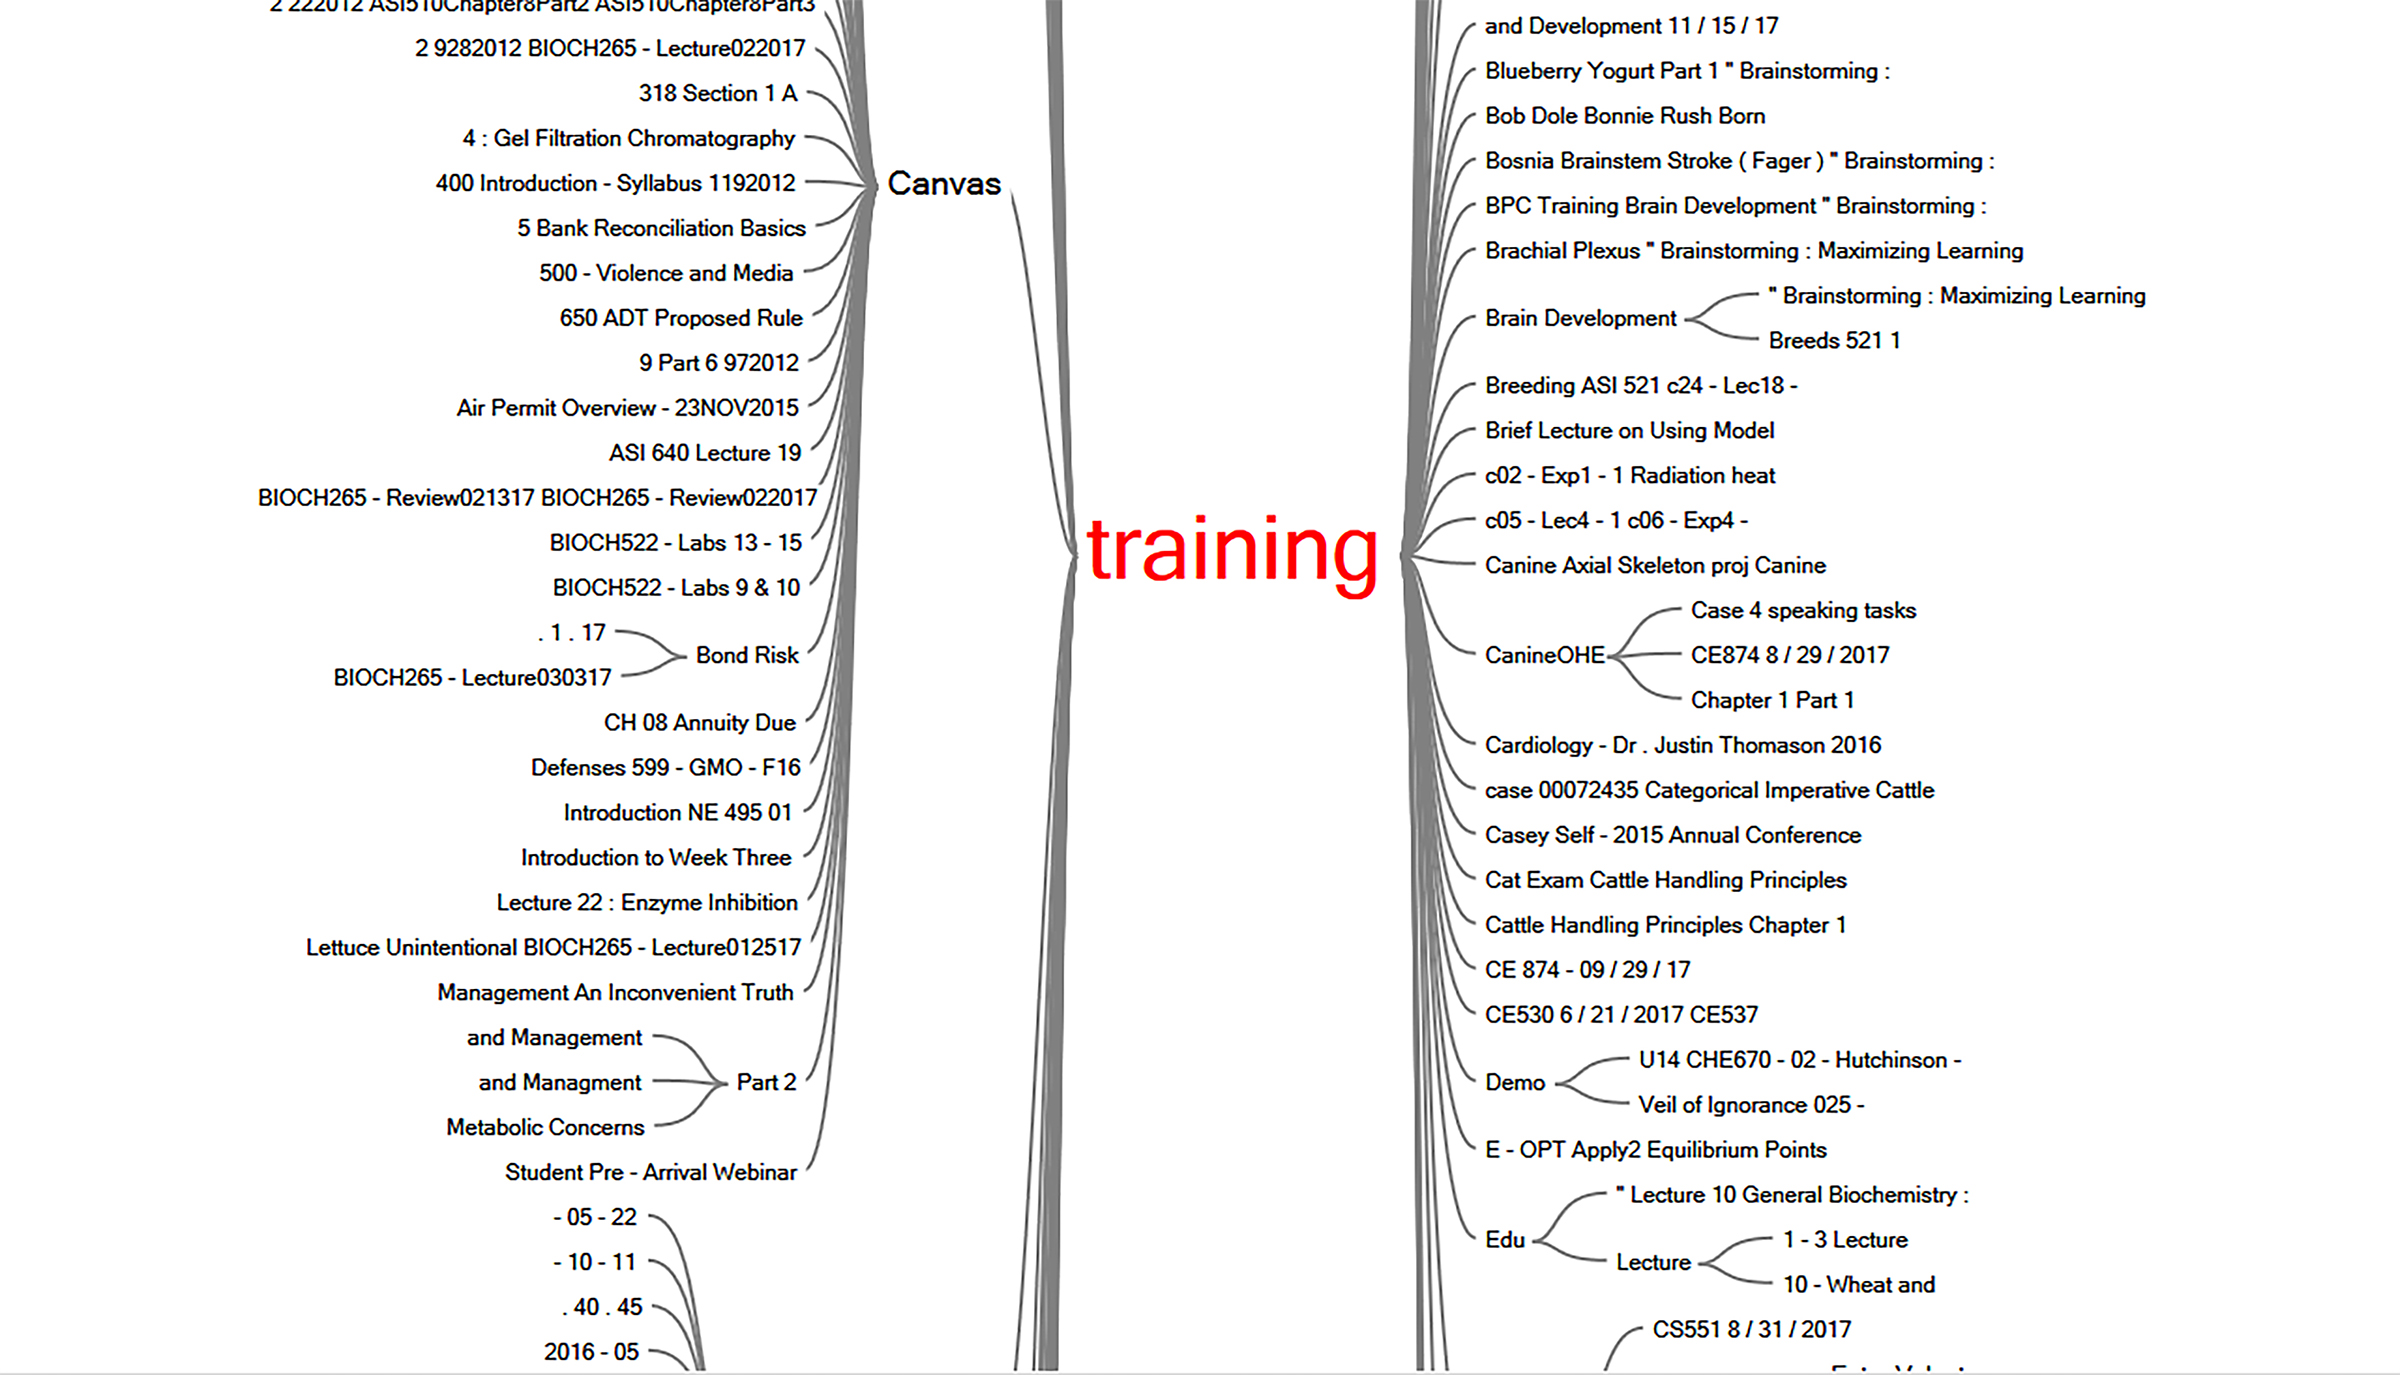
Figure 7: “Training” Word Tree from the Video Titles in Mediasite Collection at K-State (2017)
Figure 8: “Lab” Word Tree from the Video Titles in Mediasite Collection at K-State (2017)
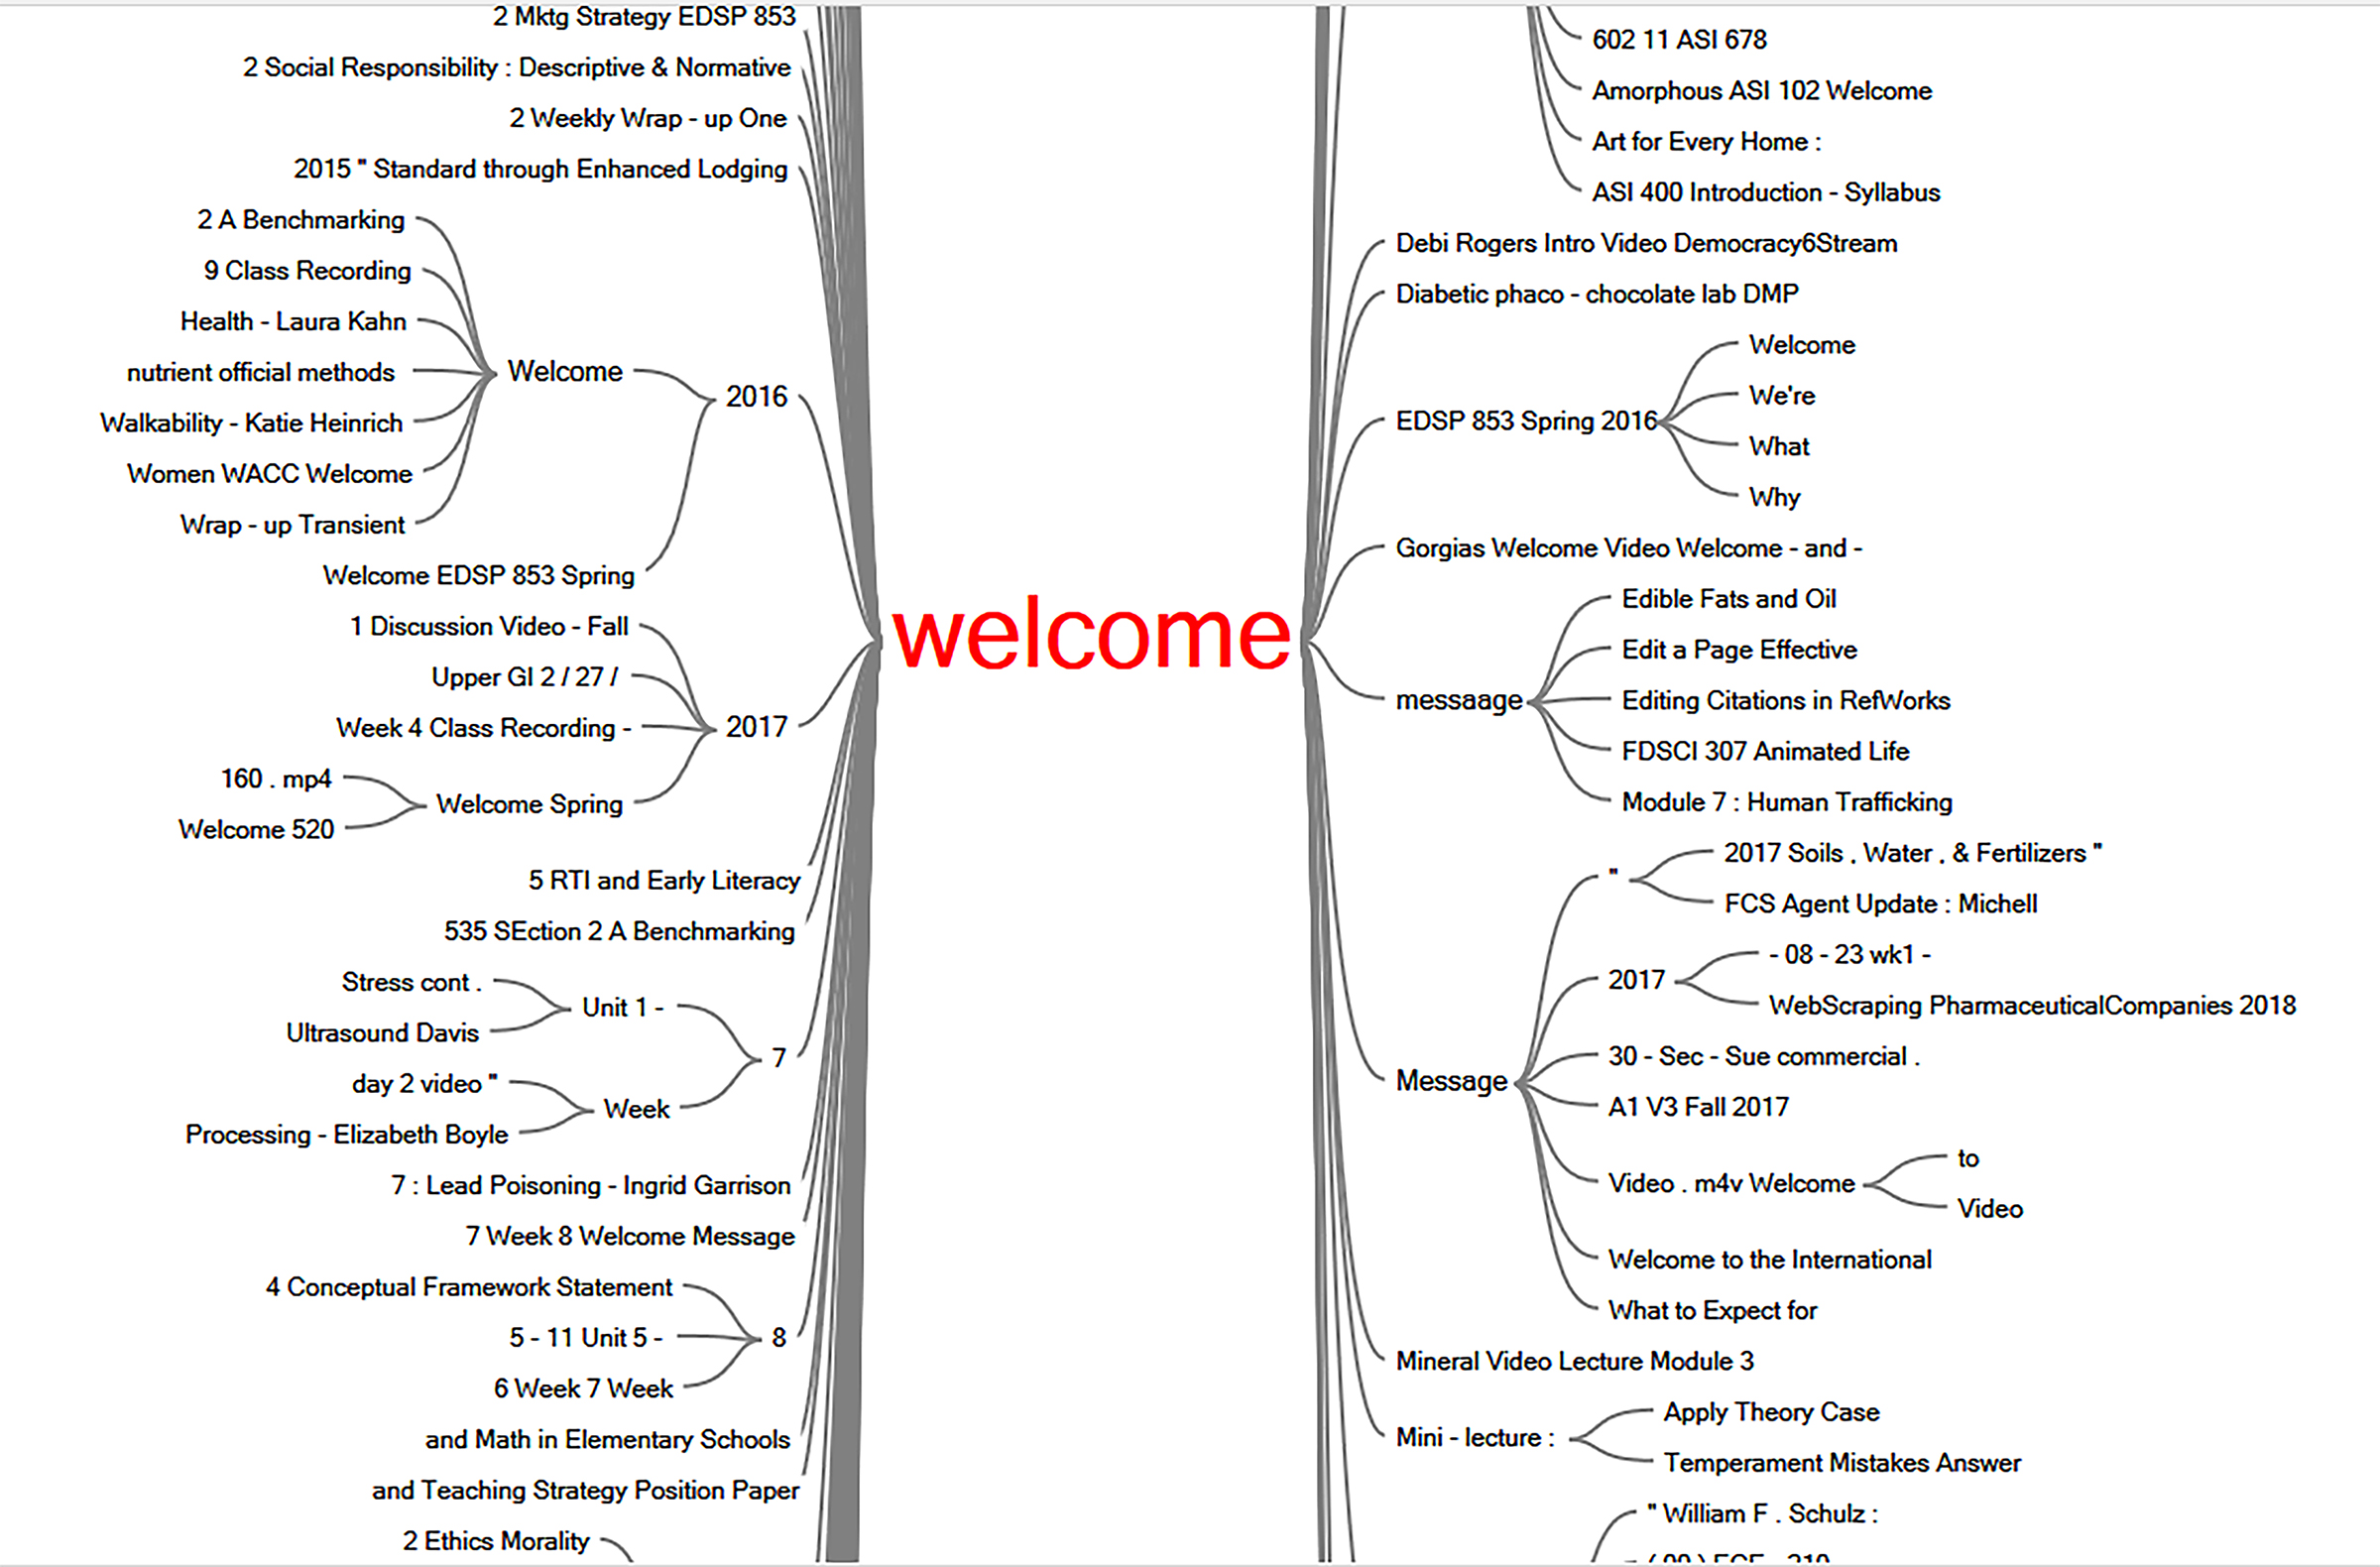
Figure 9: “Welcome” Word Tree from from the Video Titles in Mediasite Collection at K-State (2017)
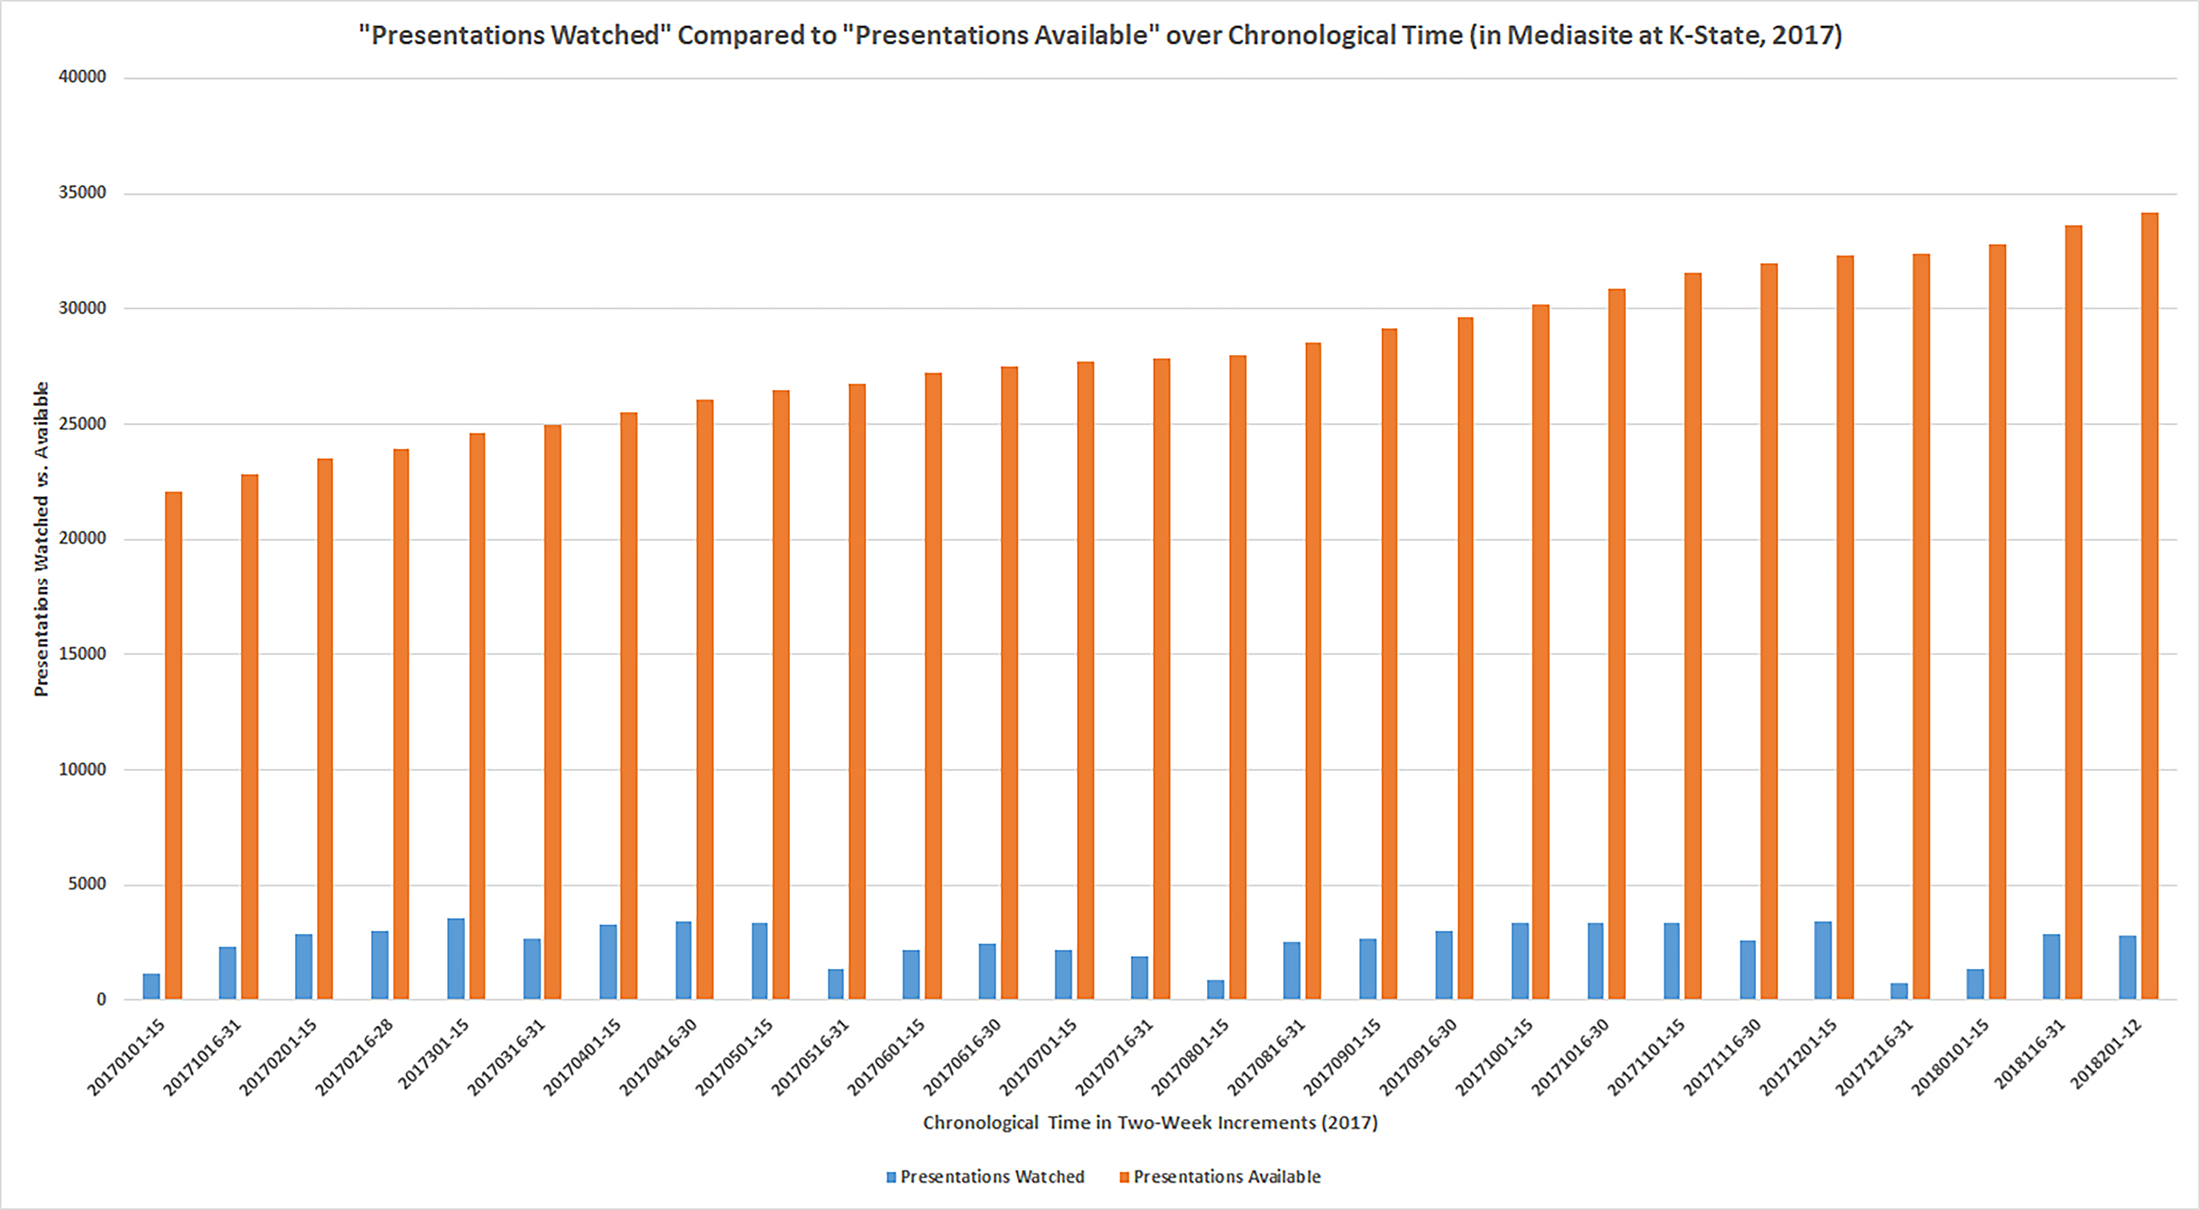
Presentations Watched Compared to Presentations Available
At any one time, only 9% of the available presentations (videos) are watched, or an average of 2,557.41 videos watched at any one time period with an average of 28,238.3 videos in the holdings on Mediasite (Figure 10). This suggests that some 90% of holdings not being used in a time period. This may be expected to some degree since people create contents that they may use for a short time period and not again. Many use Mediasite as a storage platform for everything even though they are encouraged to clean off unused videos to save on server space.
Figure 10: Presentations Watched Compared to Presentations Available over Chronological Time (in Mediasite at K-State, 2017)
WHEN is Mediasite Used and for How Long?
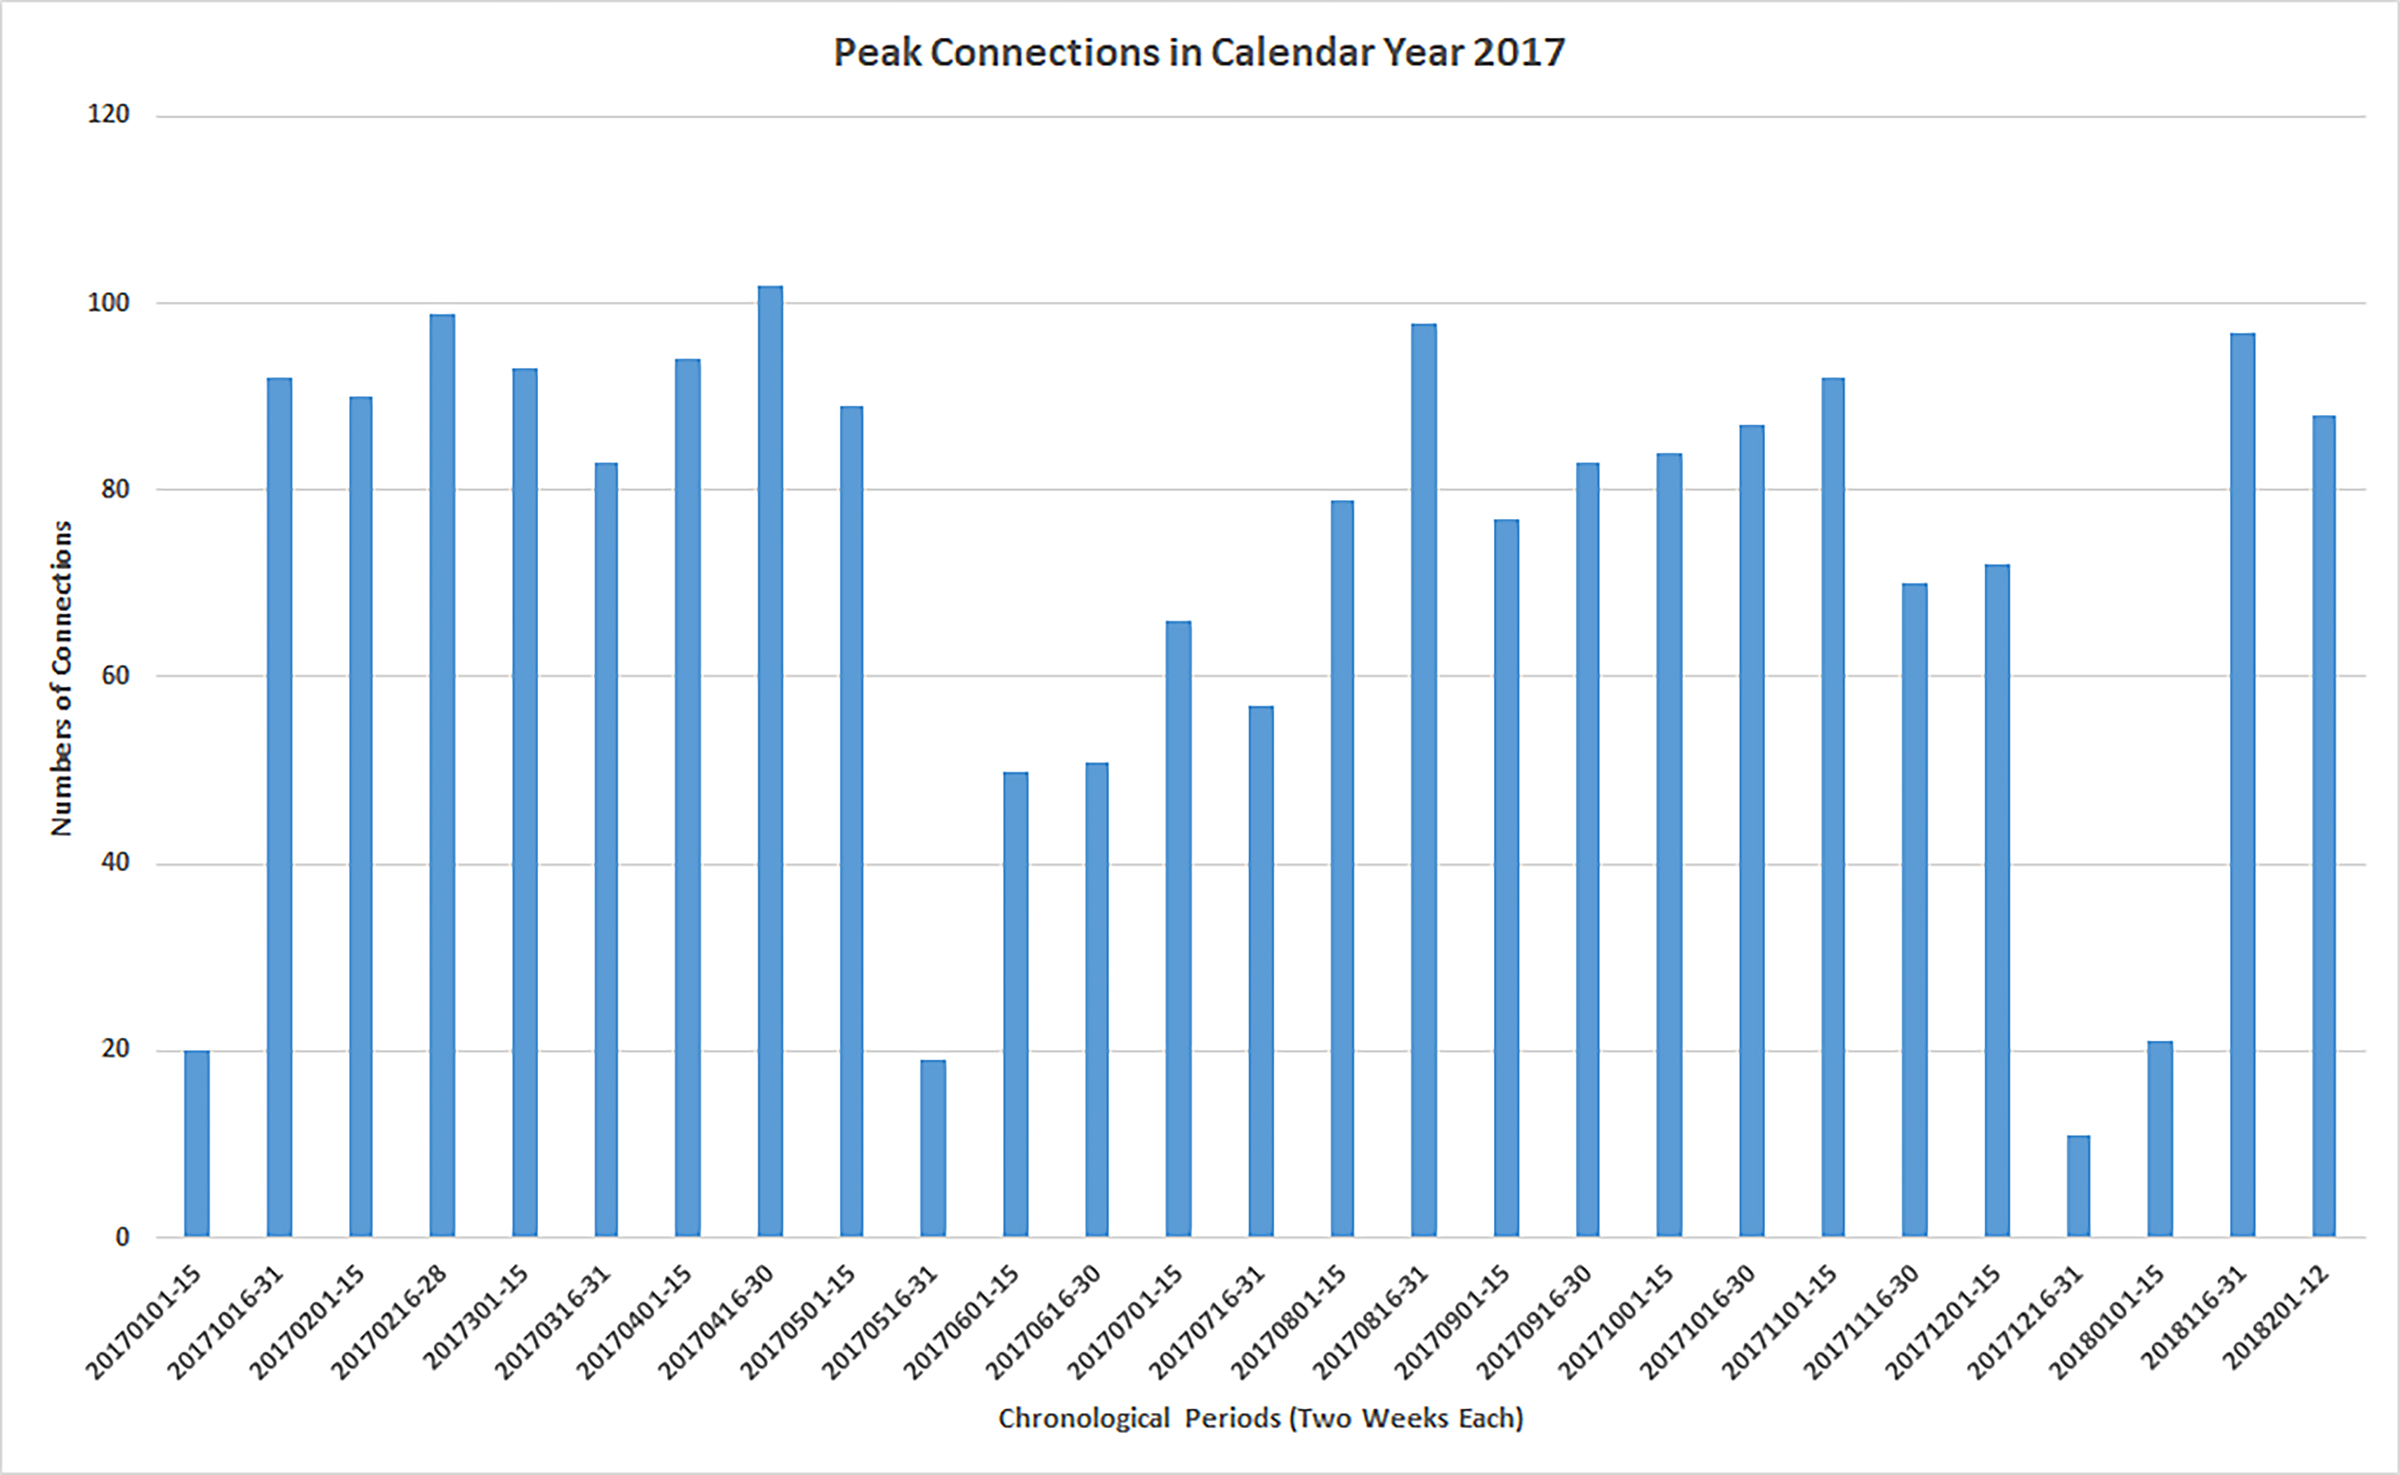
Using the time angle is fruitful in engaging with these data tables. For example, peak connection times during the 2017 calendar year shows an alignment with the formal semester schedules.
Peak Connections
“Peak connections” may be the highest simultaneous numbers of people connected to the particular instance of Mediasite at any one time. In general, "users" (content creators?) connect to the Mediasite platform when they need to upload and edit contents, check on user data, input metadata, and other needs. The busiest periods of peak connections are the following (in descending order):
April 16 – 30, 2017 (near the end of the regular academic year)
February 16 – 28, 2017 (near the beginning of the spring semester)
August 16 – 31, 2017 (start of the fall term and start of the academic year)
January 16 – 31, 2018 (start of the spring term in the next calendar year)
More may be seen in Figure 11.
Figure 11: Peak Connections in Calendar Year 2017
Total Time Watched
The “total time watched” feature captures the cumulative number of hours (including minutes and seconds) of video watched every two weeks on the Mediasite platform. The visual in Figure 12 only has the hours, and those are rounded up).
Figure 12: Total Time Watched (h:mm:ss) over Time in Mediasite Instance at K-State (2017)
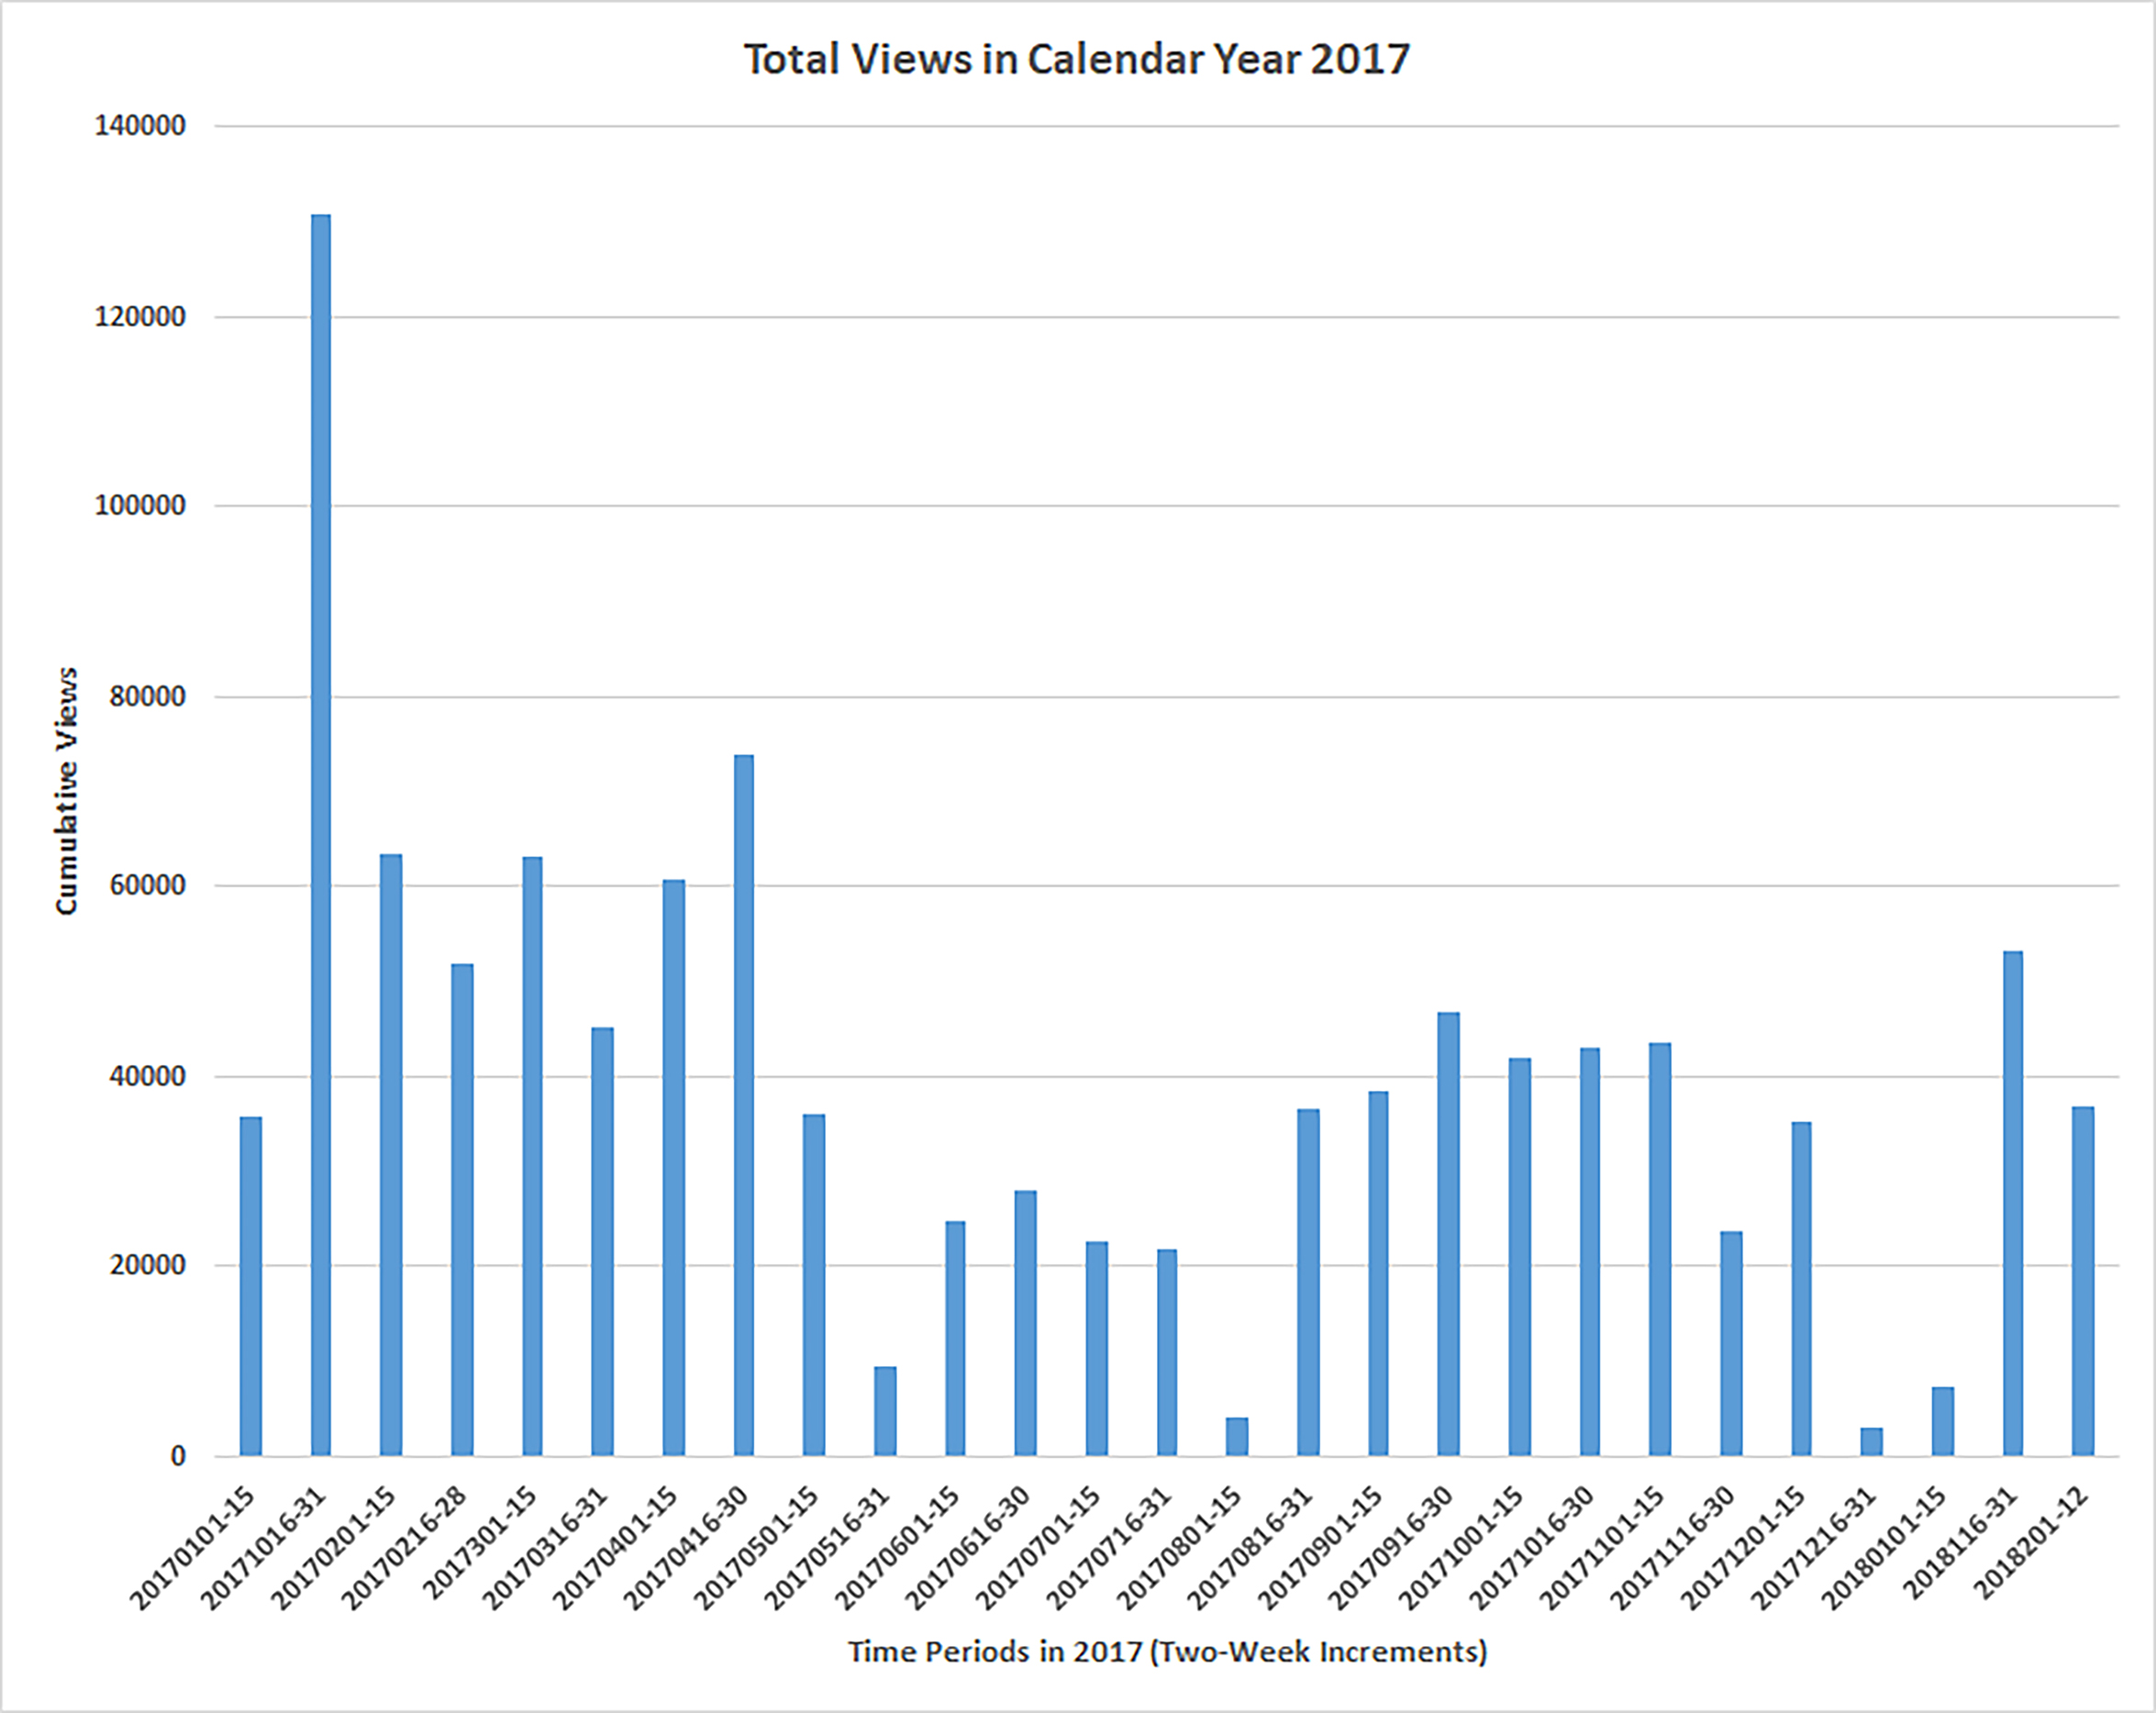
Total Cumulative Views
“Views” are defined as intentional and purposive accesses to the videos (Allocca, 2018). On a sophisticated platform like Google’s YouTube, determining intentionality is a challenge:
If someone misleads you with a title or thumbnail, did you intend to watch that video? What if you visit a web page and they have an embedded video autoplaying? Would you describe someone who replays a video five time in a row over a few minutes as five different views? What if videos are autoplaying while you’re in another room making dinner? Certainly we would agree that the playbacks generated by automated systems shouldn’t count, right? (Allocca, 2018, p. 7)
Mediasite probably does not have the complex analytics challenges of a platform like YouTube with its many billions of views a day.
The “total views” shows every time a video is started and restarted. Some of the periods show a second pause between the start and the stop, and each bit is a “view.” This shows a very bursty beginning for the new year and the start of the spring semester. Thereafter though, those heights are not achieved again (Figure 13).
Figure 13: Total Views in Calendar Year 2017
HOW? Techno Used to Access the Videos
Another dimension of the data involves the technologies used to access the Mediasite platform. These are relevant to know because they affect how consumable the videos may be.
Cumulative Views by Browser Types
The most common web browsers used were the following (in descending order): Chrome, Safari, Firefox, Internet Explorer 11.0, Microsoft Edge, Chrome Mobile, Safari, Mobile, and others. These are listed in a Pareto chart (Figure 14). For the Internet Explorer Mobile listings, there were up to three different rows for these but no version numbers differentiating them, so these were summed and listed once. Where version numbers were available, such as for Internet Explorer, those were listed.
Figure 14: Cumulative Views by Web Browser in Mediasite at K-State (2017)
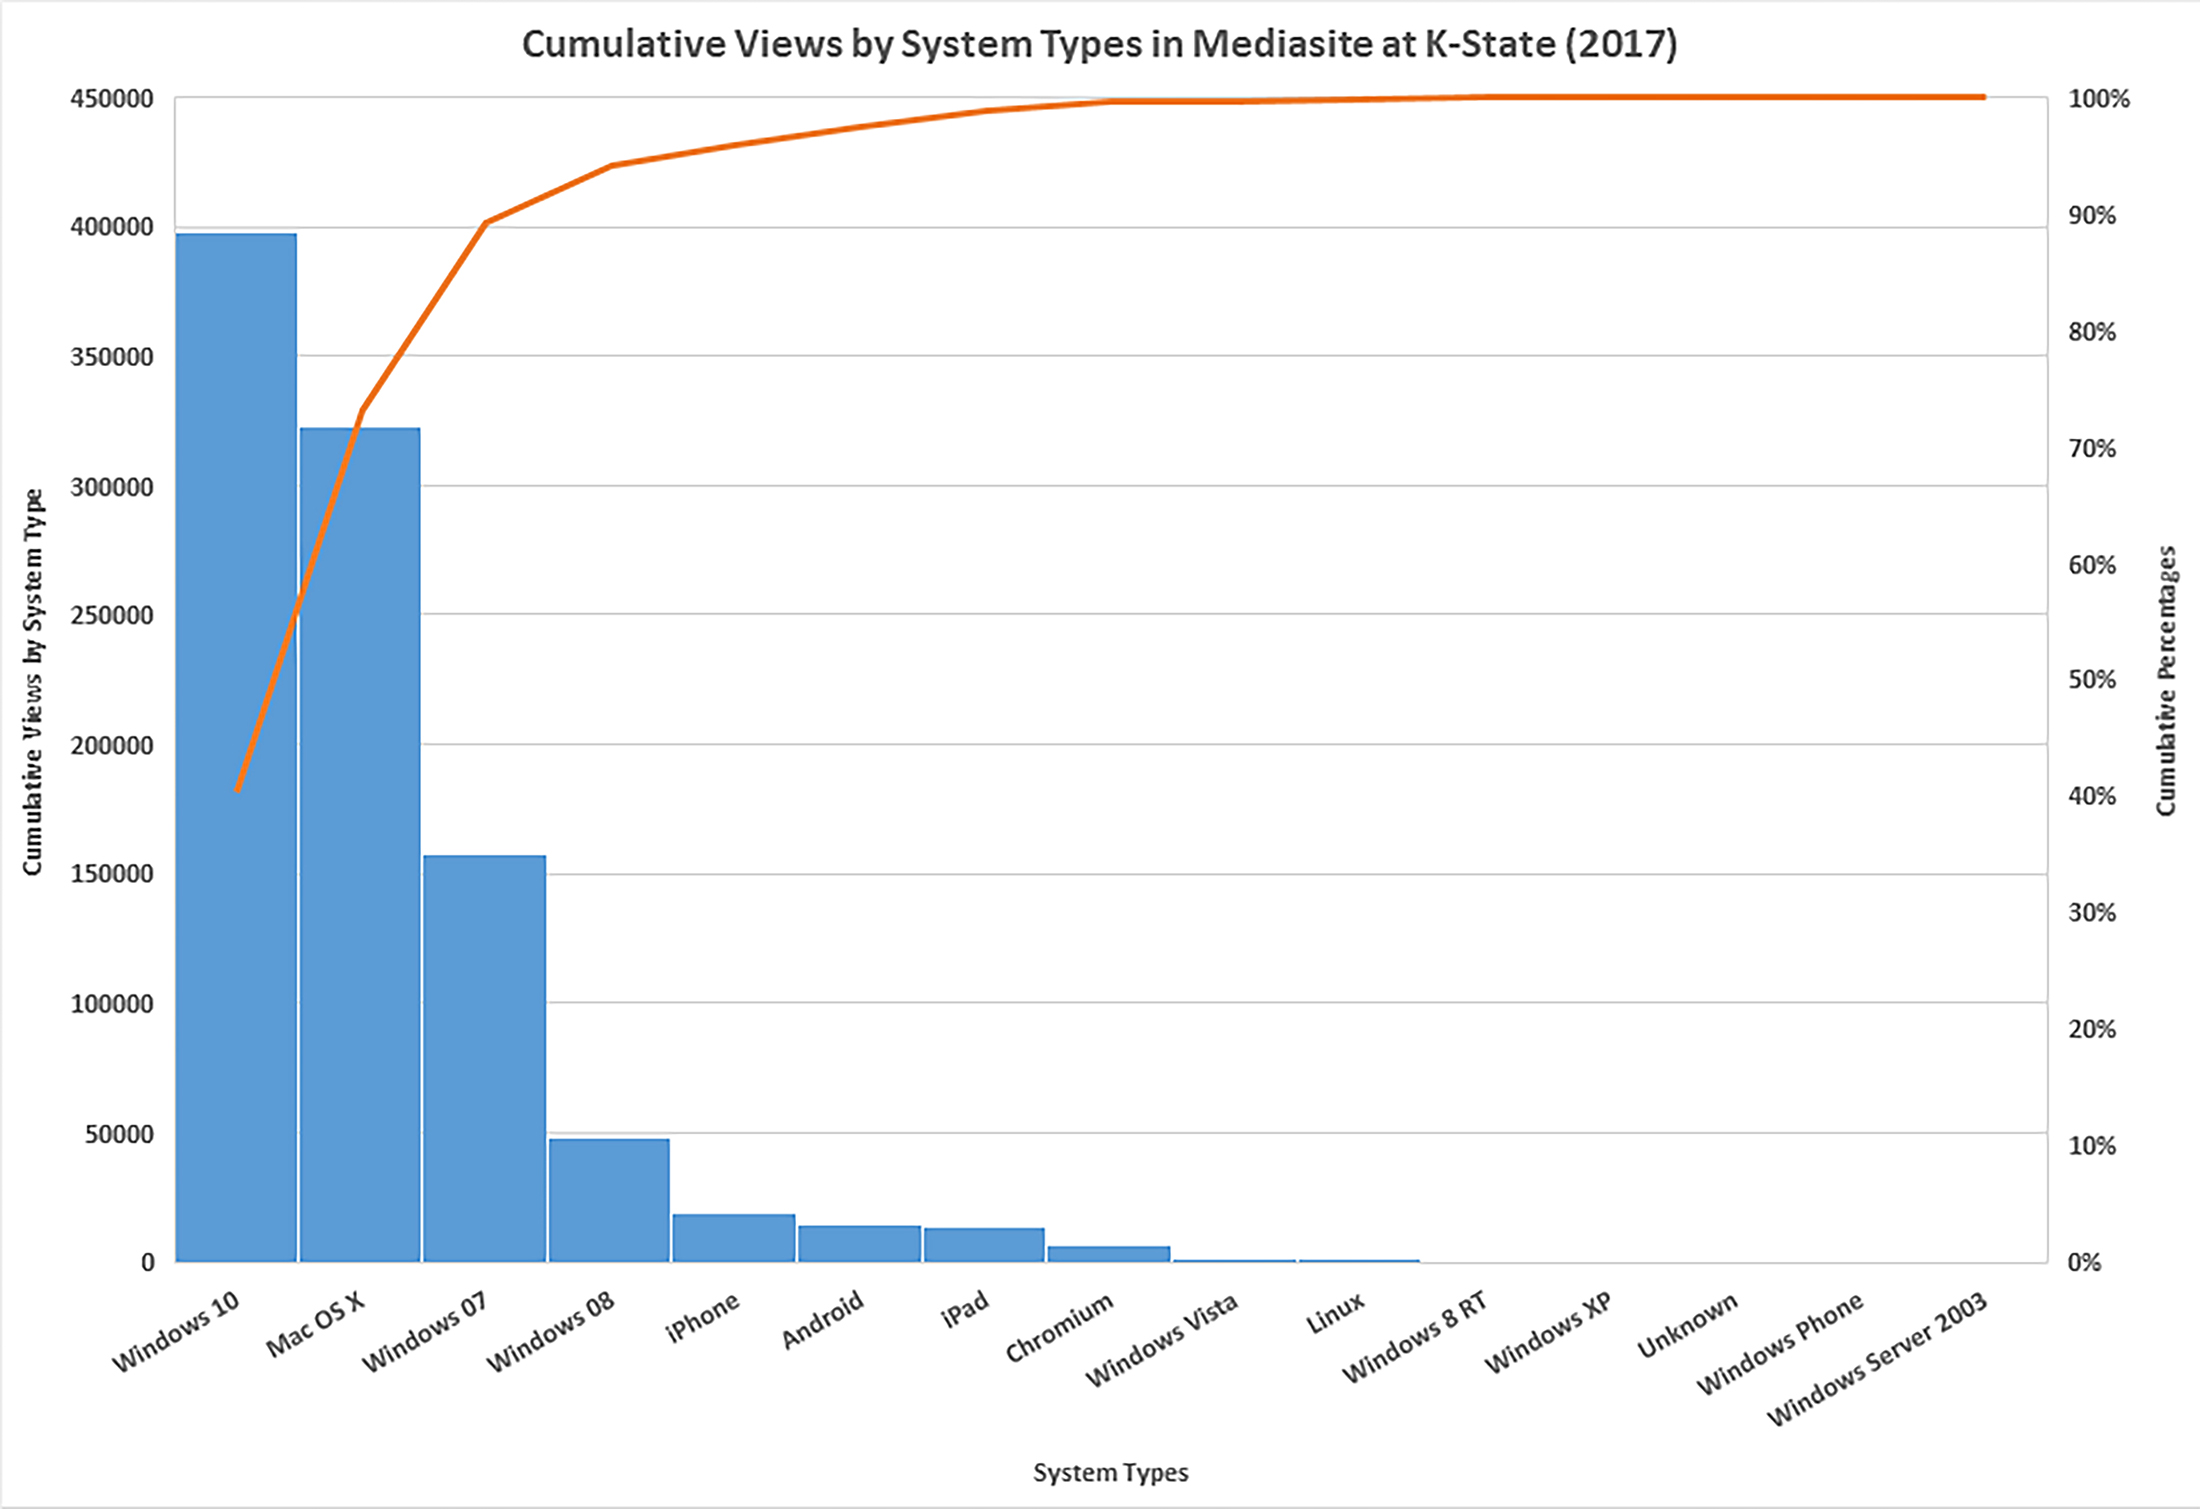
Cumulative Views by System Types
In terms of cumulative views by system types, the most common systems used in descending order were as follows: Windows 10, Mac OS X, Windows 07, iPhone, Android, iPad, Chromium, Windows Vista, and so on. (Figure 15)
Figure 15: Cumulative Views by System Types in Mediasite at K-State (2017) / Pareto Chart
The accesses by various system types may of course also be viewed as a factor of time (Figure 16). There seems to be a fair amount of dynamism over time in terms of the uses of both Windows 10 and Mac OS X over time (these are the two top lines in the line graph consistently through 2017).
Figure 16: Cumulative Views by System Types on Mediasite at K-State (2017) / Linegraph
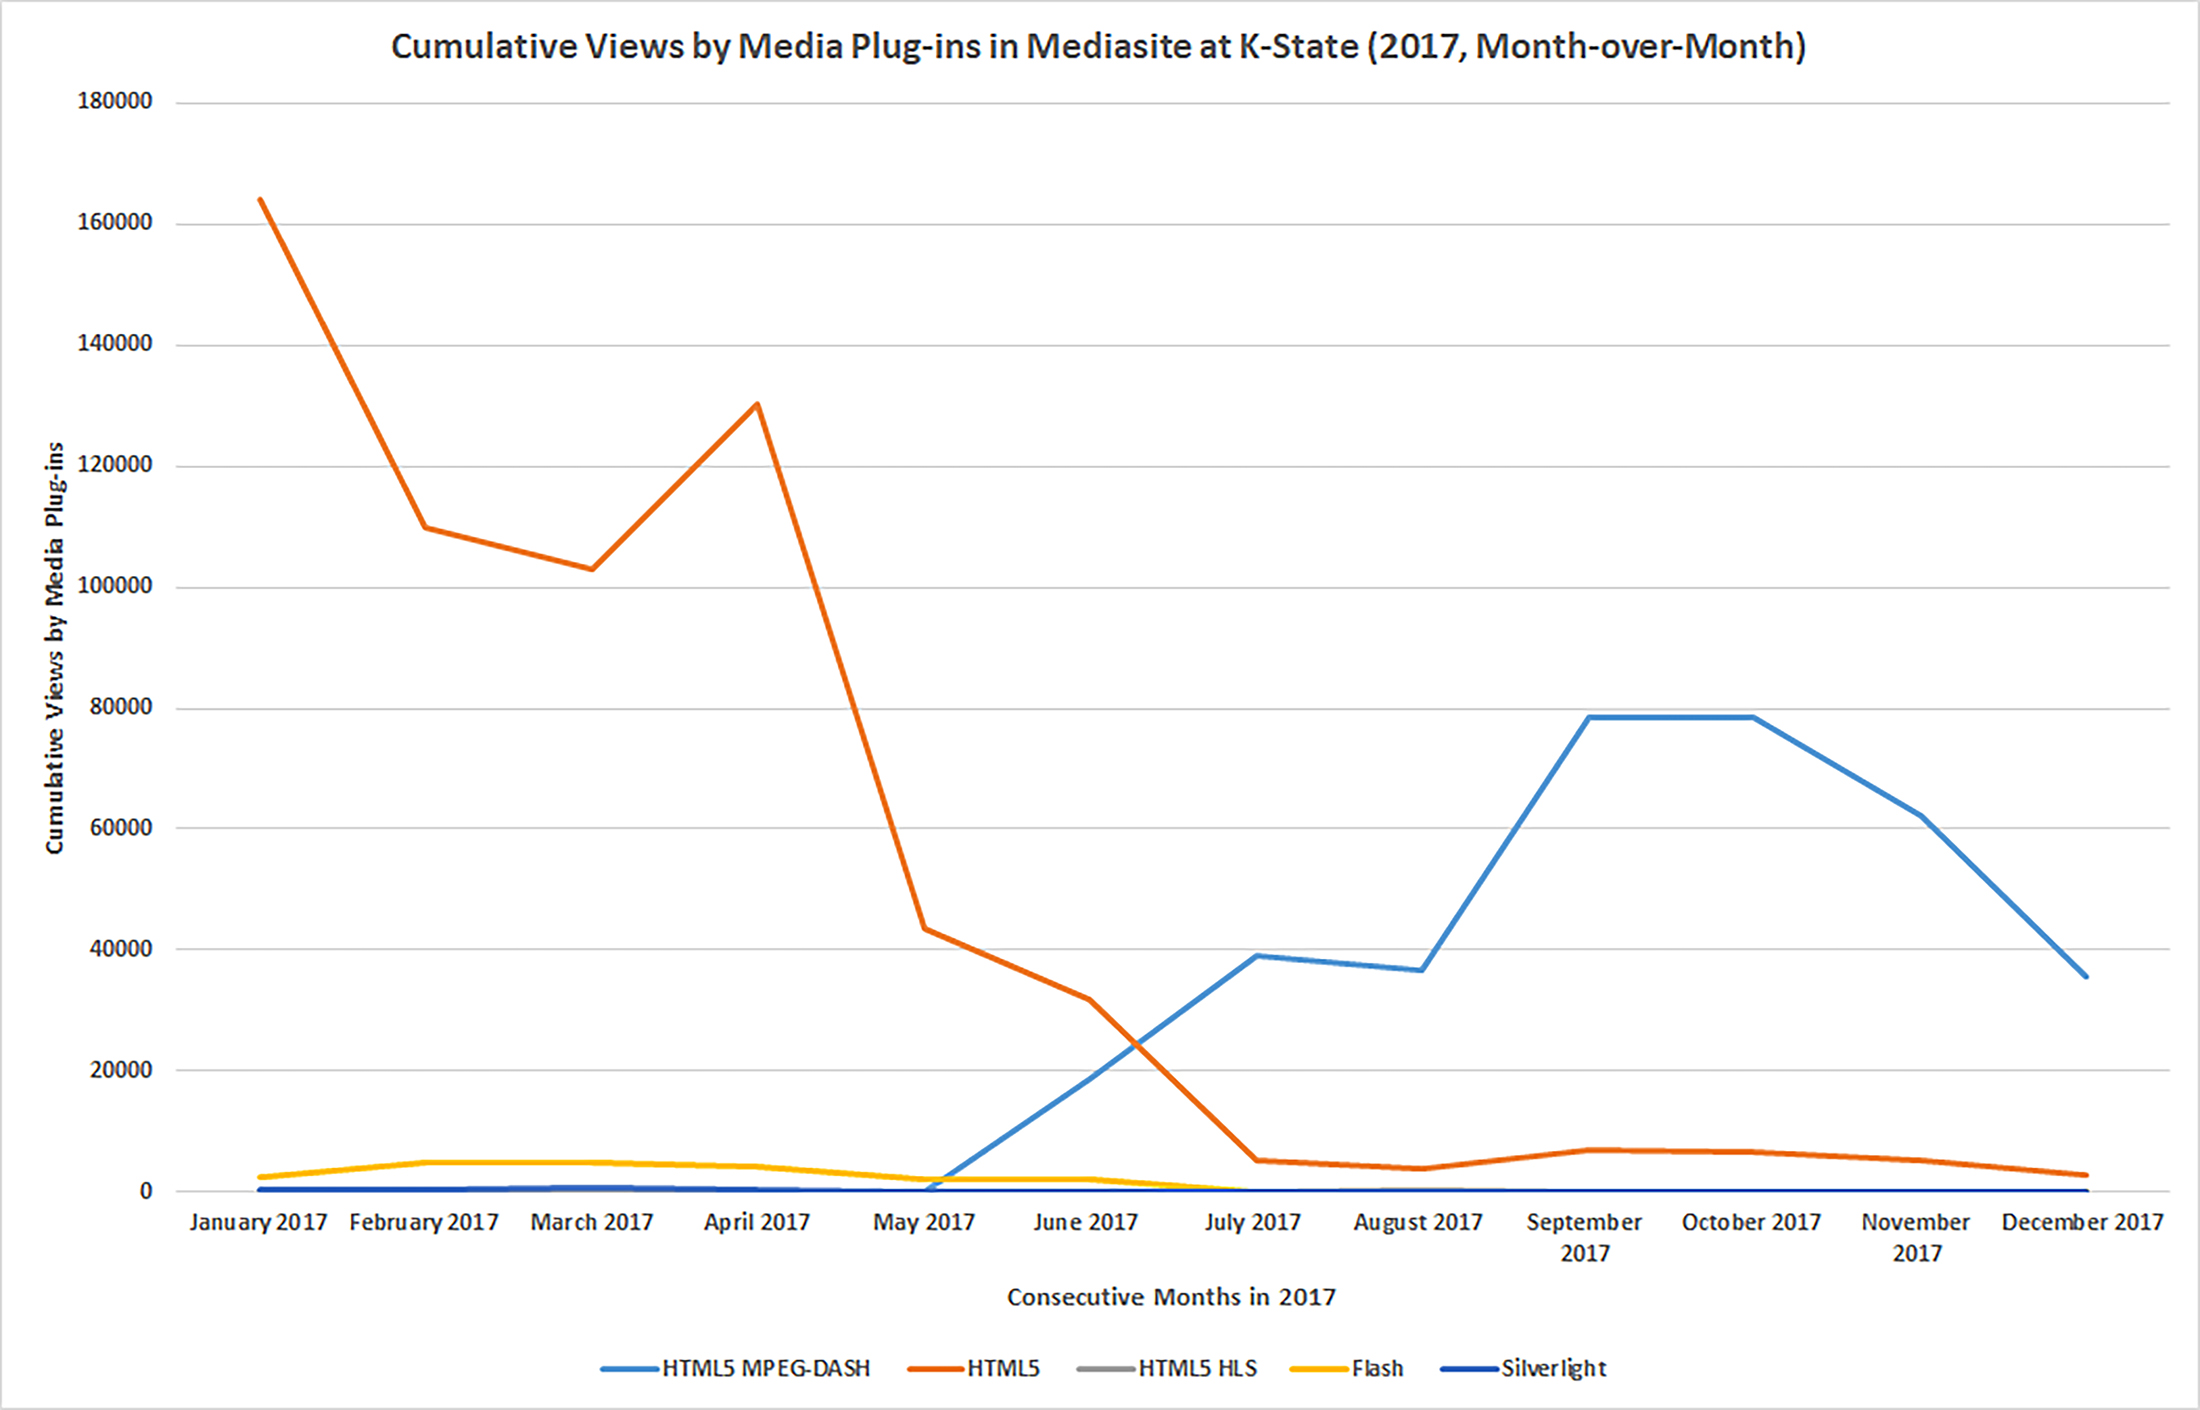
Cumulative Views by Media Plug-in
In terms of media plug-ins, the most common ones are HTML5, HTML5 MPEG-DASH, Flash, Silverlight, and HTML5 HLS (Figure 17).
Figure 17: Cumulative Views by Media Plug-ins on K-State’s Mediasite Instance in 2017 (Pareto Chart)
In Figure 18, “Cumulative Views by Media Plug-ins in Mediasite at K-State (2017, Month-over-Month),” there is an interesting cross-over point of usage in mid-June 2017, when accesses with HTML5 diminished and those for HTML5 MPEG-DASH took over. Ideally, developers just want the browsers to handle the video contents without a need for any plug-in, but that is balanced against video quality and effects.
Figure 18: Cumulative Views by Media Plug-ins in Mediasite at K-State (2017, Month-over-Month)
It is possible to explore how a particular video is accessed, in terms of web browser (Figure 19), or other system or plug-in.
Figure 19: Web Browsers Used to Watch “Video to Enhance Face-to-Face and Online Instruction, Presence, and Interaction”
Discussion
So of the initial brainstormed questions, which ones were answerable? The title-ling of the videos may be seen with ease. Further analysis could enable an understanding of the parts of campus using Mediasite. Otherwise, the other questions have to be answered using other data and other means.
Conclusion
This work captures a quick view of some of the available information about the Mediasite instance at Kansas State University.
Acknowledgments: Thanks to Scott Finkeldei for permission to access this data, and thanks to Brandon Utech for providing the data tables. Weirdly, it’s been fun!
References
Alexander, W.R.J. (2013). Blackboard/Mediasite usage and student grades: Evidence from a natural experiment in an introductory economics class. Australasian Journal of Economics Education: 10(1), 39 = 55.
Allocca, K. (2018). Videocracy: How YouTube is changing the world…with double rainbows, singing foxes, and other trends we can’t stop watching. New York: Bloomsbury.
Antani, S. Kasturi, R., & Jain, R. (2002). A survey on the use of pattern recognition methods for abstraction, indexing and retrieval of images and video. Pattern Recognition: 35, 945- 965.
Blundell, B.G. & Lu, L.W. (2013). Ethical and Professional Issues: Transcending the Obstacles to Student Engagement, in: Proceedings BCS INSPIRE 2013 (18th International Conference for Process Improvement, Research and Education), “Education Inspires”, eds. J Uhomoibhi, S Barikzai, M Ross and G Staples,
Demazière, C., Stöhr, C., & Adawi, T. (2015). Using Learning Analytics in Virtual Learning Environments. In the Proceedings från 5:e Utvecklingskonferensen för Sveriges ingenjörsutbildningar, Uppsala, Sweden. Vol. 5. 121 – 125.
Gorissen, P., van Bruggen, J., & Jochems, W. (2013). Methodological triangulation of the students’ use of recorded lectures. International Journal of Learning Technology: 8(1), 20 – 40.
Pilarski, P.P., Johnstone, D.A., Pettepher, C.C., & Osheroff, N. (2008). From music to macromolecules: Using rich media/podcast lecture recordings to enhance the preclinical educational experience. Medical Teacher: 30, 630 – 632.
Ross, T.K. & Bell, P.D. (2007, July). “’No significant difference’ only on the surface.” International Journal of Instructional Technology and Distance Learning: 4(7), 1 - 11. Retrieved http://www.itdl.org/Journal/Jul_07/article01.htm.
Sheth, N.U., Dowling, T.C., & Congdon, H.B. (2013). Evaluation of synchronous versus live instructional delivery methods of student academic outcomes and perceptions at a multi-campus school. Currents in Pharmacy Teaching and Learning: 5(2013), 381 – 386.
Suda, K.J., Bell, G.C., & Franks, A.S. (2011, Dec. 15). Faculty and student perceptions of effective strategies and materials. American Journal of Pharmaceutical Education: 75(10, 201 – 206.
Suda, K.J., Sterling, J.M., Guirguis, A.B., & Mathur, S.K. (2014). Student perception and academic performance after implementation of a blended learning approach to a drug information and literature evaluation course. Currents in Pharmacy Teaching and Learning: 6(2014), 367 – 372.
Vasu, M.L. & Ozturk, A.O. (2008, Nov.). A rich-media solution for distance education: A review of MediaSite. Social Science Computer Review: 26(4), 528 – 533.
Wijtmans, M., Scholten, D.J., Boon, E., Kozak, T., Kurat, N., & van Muijlwijk-Koezen, J. (2016). Recording editable slidecasts in-class with a smartphone using Presentain and Mediasite. Web Lectures. Retrieved from https://www.weblectures.nl/sites/default/files/attachments/recording-slidecasts-smartphone_2016_v2_final.pdf.
About the Author
Shalin Hai-Jew is an instructional designer. Her email is shalin@k-state.edu.
| Previous page on path | Cover, page 14 of 23 | Next page on path |
Discussion of "Some Back-end Data from the K-State Mediasite Instance (for 2017)"
Add your voice to this discussion.
Checking your signed in status ...