Book Review: Improving School Practice through Exploratory Factor Analysis
By Shalin Hai-Jew, Kansas State University
Exploratory Factor Analysis: Applications in School Improvement Research
By Diana Mindrila
New York: Nova Science Publishers
2017 202 pp.
Imagine that you have a set of quantitative data based on somewhat-related variables. You want to know what hidden (latent) constructs may underlie the dataset. A tool that you might go to would be the exploratory factor analysis (EFA), which is used to identify multivariate correlation—the associations between multiple variables.
Diana Mindrila, a professor and researcher out of the University of West Georgia in Carrollton, has published an edited text on this topic: “Exploratory Factor Analysis: Applications in School Improvement Research.” She writes:
It helps reduce large data sets into main components or identify distinct constructs that account for the pattern of correlations among observed variables. These unobservable constructs are refered (sic) to as common factors, latent variables, or internal attributes, and they exert linear influences on more than one observed variable (Mindrila, “Preface,” 2017, p. vii)
She notes that while exploratory factor analysis has gained widespread adoption in the social sciences since its inception over a century ago (Spearman, 1904, 1927), applied researchers have been less enthusiastic (Mindrila, “Preface,” 2017, p. 2). This light collection of six chapters works both as a “how-to” regarding EFA and a collection of real-world applied cases. Here, the focus is on methodological rigor in applying this statistical approach (using IBM’s SPSS) and practicality in applying the findings to actual situational awareness and decision-making.
Exploratory Factor Analysis (EFA)
An exploratory factor analysis (EFA) is a statistical method that is applied to quantitative data (often from surveys) to identify latent underlying associations or patterns in the data. The respective questions in a survey are variables, and if they co-vary, they may be collected into a composite factor (or component). Selected variables may “load” to a component. The components have to be interpreted not only statistically (based on methods and the proper parameters to be set for certain parts of the analysis), but they are also interpreted textually—by reading the original survey questions or reviewing the original variables, to understand what the extracted factor pattern may be. These EFA observations enable a researcher to learn from empirical quantitative data.
An EFA (as compared to a confirmatory factor analysis) does not start with a hypothesis or any a priori assumptions, Basically, it begins with the data and an openness to using statistical means to identify potential patterns. As such, EFA enables statistic-based data reduction (by simplifying granular variables to broader-scale factors) and data summarization (by enabling the identification of latent constructs or “common factors” and their listing in descending order) (Mindrila, 2017, p. 4).
In a confirmatory factor analysis, the theorizing should not generally be post hoc but a priori. CFA is also used to validate scales in instruments. Mindrila (2017) writes:
Confirmatory factor analytic procedures can be used when researchers have some prior knowledge about the actual structure of the data either from prior research or extant theory (Finch & West, 1997)… Exploratory and confirmatory factor analysis can also be used in conjunction with one another. The exploratory procedures are employed first to identify the factor structure; the factor model is then tested in a subsequent study through confirmatory factor analysis” (p. 3).
The extraction of underlying structures may also be used predictively, to suggest that future data may fall into certain factor categories at certain rates (in terms of data modeling).
Sufficient and proper data to get started? A researcher may start with a research design. Or he / she may start with a basic dataset of quantitative data (the most common ones mentioned are survey data and grade data, in the educational context). Some degree of multicollinearity among the variables (or items) is required, which basically just means that the items cannot be purely orthogonal or non-related. Too much multicollinearity can be prohibitive, too, because that would suggest that the items are measuring some of the same things and are overly associated. In survey datasets, the understanding is that the instrument is measuring a particular phenomenon or construct. The assumptions of a grade dataset are that the assessment is measuring a particular topic or subject area or construct.
Another requirement for the underlying data is that there have to be a sufficient number of cases to enable the extraction of sub-groups from among those cases. Without a sufficient number, there may be too few subgroups or none that are identifiable. Or the factor analysis itself may fail to be statistically significant. There have to be sufficient numbers of variables or items, too, because EFA is a multivariate statistical analytical technique. Having only one or two variables is insufficient.
In scaled responses (like Likert), the responses should all be correctly represented with numbers (usually higher numbers for positive and lower numbers for negative). Questions that do not result in a numeric measure, such as “yes/no” questions, have to be converted to numeric ones (1’s for yesses, 0’s for nos). String data have to be converted to numeric data. In grade datasets, grades have to be in numeric format.
- The typical process is to run a linear regression over the variables to get a sense of the level of multicollinearity present among the items. (Analyze -> Regression -> Linear)
- Then, the Analyze -> Dimension Reduction -> Factor is run for the exploratory factor analysis. These may be output with different parameters depending on the outcomes. For example, if the pattern matrix has cross listings, those should be addressed usually by sequential removal of variables that cross-list across two (or more) factors.
- Then, based on the variables that loaded to particular factors, it is important to test the reliability of those combined variables for reliability (to know how coherently those combined variables depict an identified latent construct). (Analyze -> Scale -> Reliability)
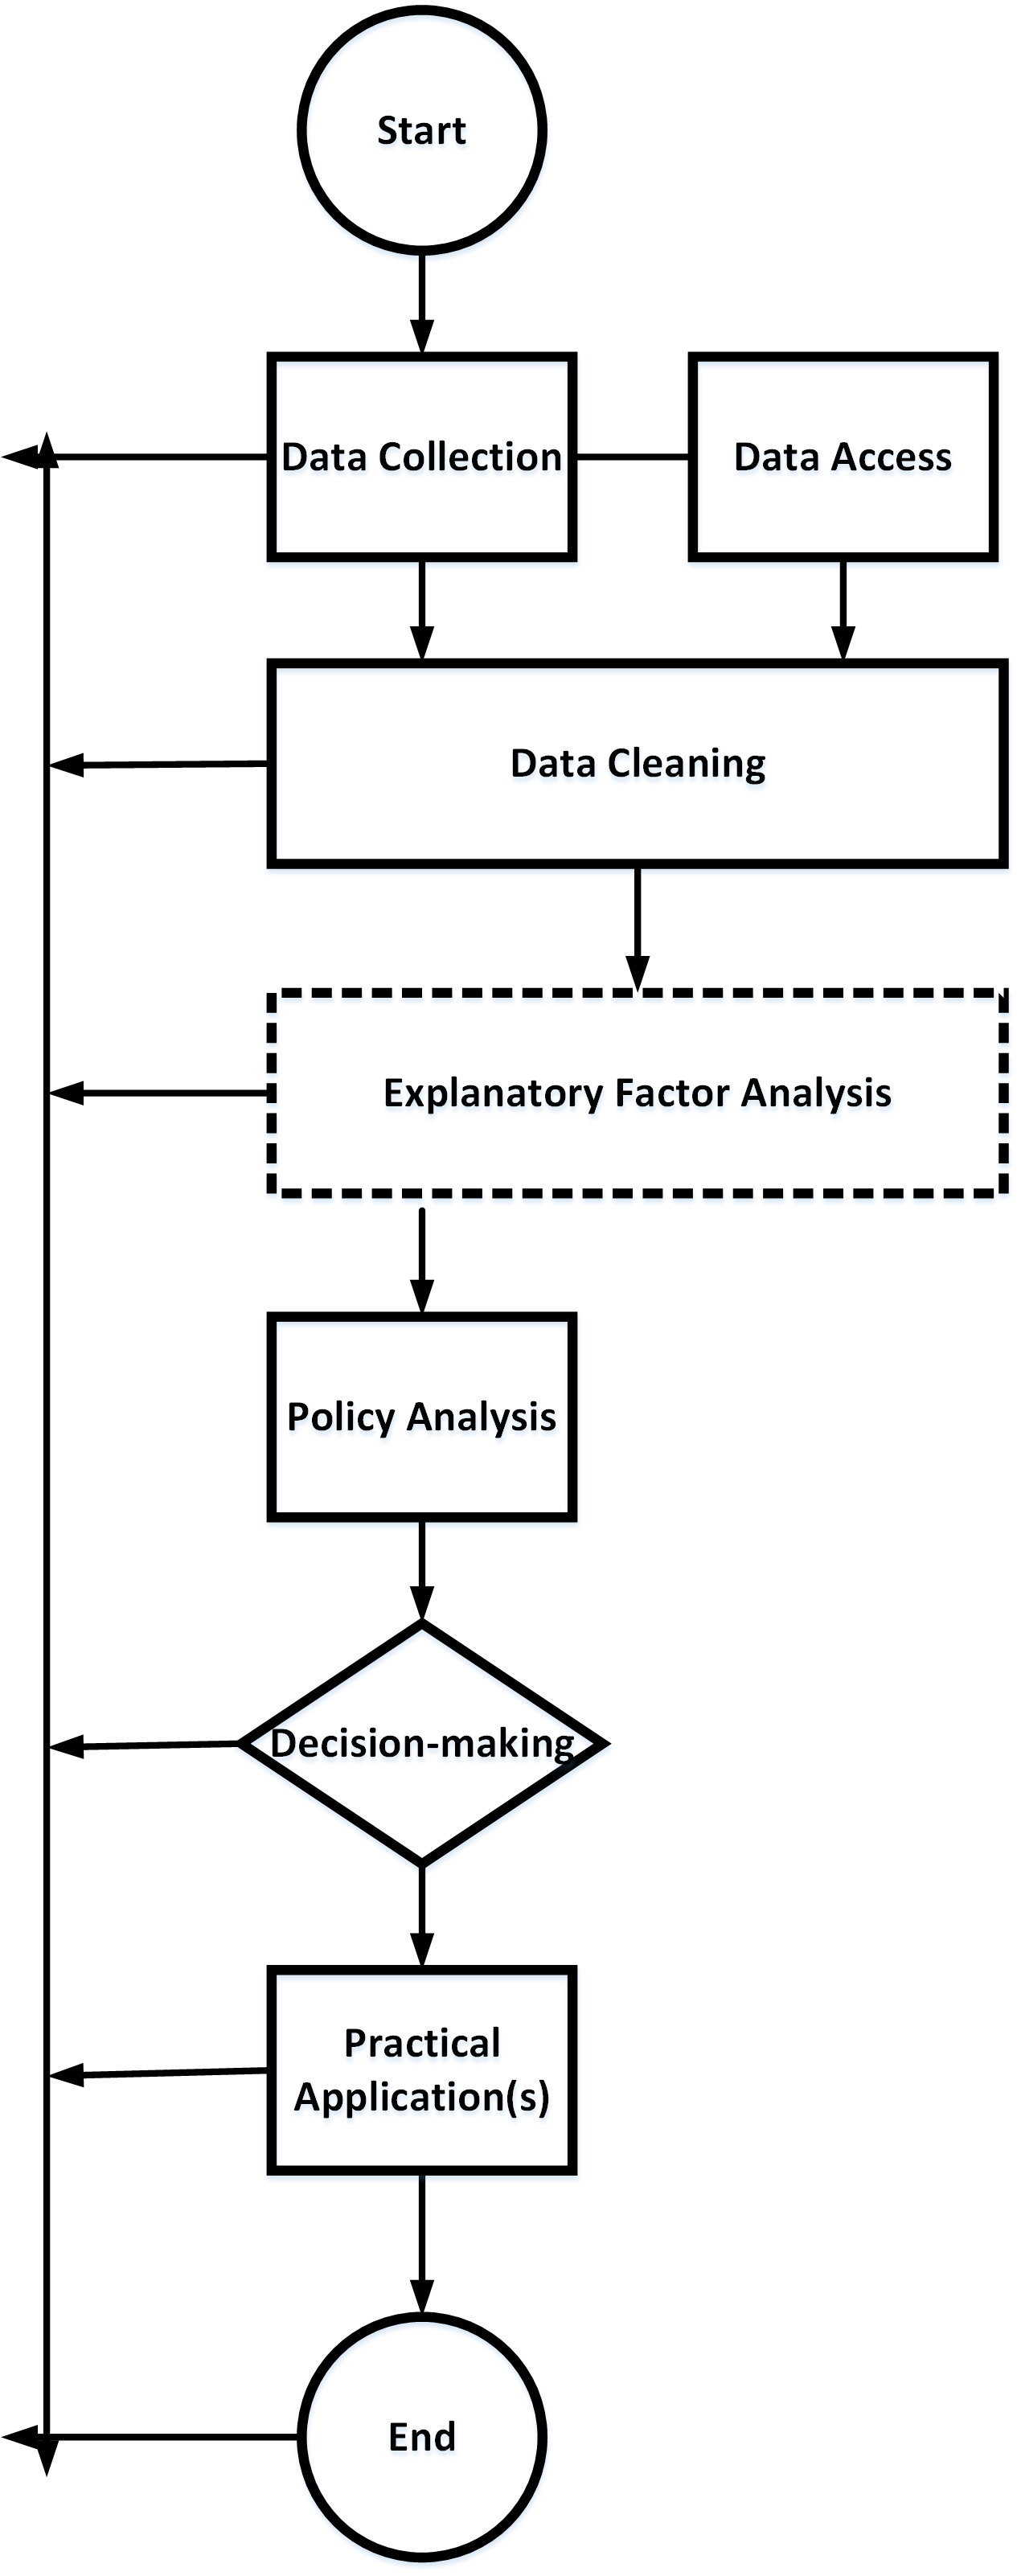
Figure 1: Exploratory Factor Analysis Use in Workplace Problem-solving Sequence
Laying the Groundwork for EFA
Diana Mindrila’s “Exploratory Factor Analysis: An Overview” (Ch. 1) introduces EFA in a coherent and thoroughly cited way to readers. As such, this work is a good place for newcomers to EFA to get started. She describes the objectives of EFA succinctly:
The goal is to identify a set of underlying dimensions that are referred to as common factors and to estimate the amount of variance in the observed variables explained by each factor (Hair, Anderson, Tatham, & Black, 1998, as cited in Mindrila, 2017, p. 2).
As compared to other multivariate statistical analysis techniques, EFA assumes independence between the studied variables and so is an “independence technique” (it is not measuring independent variables against dependent variables). Or more correctly, this is an interdependence technique with some limited multicollinearity between each variable and other variables.
Mindrila differentiates between “exploratory” and “confirmatory” factor analysis. The first is used when researchers have no a priori knowledge of the underlying factors in the data or which variables exist in each factor (Fabrigar et al., 1999, as cited in Mandrila, 2017, p. 3). The latter is used when there may be a hypothesis or theorizing that informs what factors may be identified and in what order, for example, and then the confirmatory factor analysis either confirms or disconfirms the hypothesis(ses).
As a stepwise technique, factor analysis requires that researchers have to set parameters and make decisions at very steps in the process. Different selections involve different assumptions and different resulting processes. While some statisticians may be able to explicate in great depth, professionals in other fields may have to conduct in-depth research to understand the implications of various choices and then to explicate their decisions.
Factors are extracted when variables are identified as co-associated at a particular threshold (Mindrila, 2017, p. 6). Factor analysis begins with observed variables, and through multivariate correlation analysis, it collects related variables into underlying factors (or “dimensions” or “components”). Not all measured items (variables) are part of underlying constructs. Unintended constructs may have been captured with instruments unbeknownst to the survey creators.
A factor analysis results in a number of details. The process involves creating a correlation matrix between each of the variables (bivariate correlations) and extracting a pattern matrix that identifies the groups of variables that are most closely correlated / associated. “Communality” refers to “the proportion of the observed variance accounted for by the common factors” (and these are “computed by dividing the common variance to the observed variance or by subtracting the unique variance divided by the observed variance from one (Fabrigar & Wegener, 2011, as cited in Mindrila, 2017, p. 5). There are correlational matrices that show possible associations between the extracted common factors (Mindrila, 2017, p. 7).
The Kaiser-Meyer-Olkin (KMO) score (which ranges from 0 – 1) measures “sampling adequacy” or how sufficient a dataset is for extracting common factors (or smaller sets of underlying factors). Anything .8 and above is considered excellent, over .7 is sufficient, and anything below .5 is not acceptable. Bartlett’s Test of Sphericity measure offers a statistical significance measure (with the warning that large n’s may be sensitive to noise—in which small correlations may be “statistically significant” even when they are not).
Recruiting High School Special Education Teachers
Matthew D. Lawrence’s “Teacher Motivation and Recruitment in High School Special Education” (Ch. 2) focuses on the recruitment of people to become high school special education teachers. This is a field that has high demand but few takers, and the retention is low.
At present, the educational system in the U.S. does not seem to be succeeding for learners with disabilities. Lawrence writes:
As funding has increased, however, the academic and socioeconomic outcomes of students who receive these services continue to lag far behind the outcomes of their nondisabled peers. According to the National Center for Education Statistics (NCES, 2013), the US high school graduation rate was 82.3% for all students in 2014, and 63.1% for students with disabilities. In the state of Georgia, the graduation rate for students with special needs is half that of the general population. Additionally, according to the NCES (2013), 38.4% of students with special needs obtained a postsecondary degree, compared to 51.2% of students who received no special education services. As a consequence of former students with special needs having suboptimal levels of human capital, 54% of adults with SLID (specific learning disability) report either being (1) unemployed or (2) not in the labor force—and they are twice as likely (as) their nondisabled peers to be living in poverty. Finally, per the NCES (2013), only about half of students who once received learning disability accommodations were living independently during the first eight years after having received their high school diplomas. (Lawrence, 2017, pp. 28 - 29)
He notes that special education fails students both while they’re in the public schools system and afterwards. Not only are there teacher shortages in special education in the public schools, but many who are in place may lack the full professional qualifications required. In one state, special education teachers only stayed in that position about six years before leaving (Martin, 2010, as cited in (Lawrence, 2017, p. 29).
This author’s research goal: identify factors which “lead prospective educators to become high school special education teachers” (Lawrence, 2017, p. 27) and to use this information to recruit would-be teachers sufficiently early in their university-level learning. To these ends, a survey instrument was created and pilot-tested with one school and then sent out to a whole district to try to capture insights from existing special education teachers. He identified four motivating factors: “students/clientele”; “societal impact”; “professional security,” and “personal compatibility.”
Assessing Teacher Buy-in to Learner-Centered Instruction (LCI)
Yun-Jo An and Diana Mindrila’s “Clusters of Teachers Based on their Perceptions of Learner-Centered Instruction” (Ch. 3) focuses on a constructive teaching approach—learner-centered instruction (LCI). Learner-centered instruction shifts power from a teacher-centered learning experience to a learner-based one. Learner-centered instruction involves a number of approaches:
Learner-centered approaches include but are not limited to problem-based learning, project-based learning, and inquiry based learning. While learner-centered instruction (LCI) does not take only one form, learner-centered classrooms tend to have the following five characteristics in common: personalized and cusotmized learning, social and emotional support, self-regulation, collaborative and authentic learning experiences, and assessment for learning (An, 2012; An & Reigeluth, 2011, as cited in An & Mindrila, 2017, p. 65).
In a survey responded to by 134 K12 teachers, the researchers identified two clusters: Learner-centered teachers (LCT) and those with “concerns about LCI (CLCI)” (An & Mindrila, 2017, p. 63). In this population, they found that a majority were supportive of learning centered teaching, and only a third were High CLCI and Low LCT. They write:
The majority of the participants were assigned to the Average and High LCT clusters, which had positive perceptions of LCI. Only a third of the participants were included in the High CLCI and Low LCT clusters. The proportion of middle school teachers was significantly higher in the High CLCI cluster (Χ2(6) = 12.483, p = .05). The High CLCI cluster also had the largest proportion of females and the largest proportion of teachers with 11 or more years of experience. (An & Mindrila, 2017, pp. 63 - 64)
Resistance to learner-centered instruction tended to be among those who had been teaching over eleven years. This work is also survey-based which means self-reporting, without a verification or test of how teachers actually teach.
Student Voice and Learning Empowerment
Jennifer E. Elemen’s “Student Voice Opportunities Quantified by Exploratory Factor Analysis” (Ch. 4) describes the study of students school leadership experiences in both high school and university to see how “aspects of school leadership and culture” may affect “student achievement and civic participation” (Elemen, 2017, pp. 87 - 88).
The research questions in this study include the following five:
(1) Do undergraduate students perceive they had opportunities to participate in high school organizational leadership dialogue and decision-making?(2) What are the factors that define organizational leadership dialogue and participative decision-making?(3) Are there significant relationships between individuals’ factor scores and student achievement?(4) Are there significant relationships between individuals’ factor scores and civic participation?(5) Are there significant differences in academic achievement and civic participation between students who perceive they had opportunities to participate in high school organizational leadership dialogue and decision-making compared to students who perceive they did not? (Elemen, 2017, p. 90)
The two main factor loadings were “Organizational Leadership Dialogue” and “Participative Decision-making” (Elemen, 2017, p. 108). Student perceptions of “opportunities to have participated in high school organizational leadership dialogue and decision-making were positively correlated at statistically significant levels with higher levels of participants’ civic participation” (Elemen, 2017, p. 113). Otherwise, the results were sufficiently complex and nuanced as to be excessive to summarize. Using a mix of research and data analytics approaches, Elemen found that without active outreach, students may be excluded from participative decision-making and not benefit from those experiences that may enhance their academic achievement (Elemen, 2017, pp. 116 - 117).
Assessing Spiritual Health and Implications for Academic Achievement
Chad A. McBane’s “Spiritual Health in Christian Schools: Implications for Academic Achievement and School Improvement” (Ch. 5) explored the “spiritual health” of middle school students in two private faith-based schools. The research engaged four questions: “(1) What are the levels of spiritual health reported by middle school students attending Christian schools? (2) What are the factors of spiritual health among middle school students within Christian schools as measured by the Spiritual Health Survey? (3) Are scores on the spiritual health factors statistically significant predictors of student achievement, as measured by GPA? (4) Does the relationship between students’ GPA and spiritual health scores vary across Christian schools?” (McBane, 2017, p. 124)
The Spiritual Health Survey is a 30-question instrument partially originated by the author and partly derived from another instrument:
No research survey instrument was found that measured the spiritual health of students attending Christian schools. Due to the lack of an existing survey instrument the Spiritual Health Survey…used in this research was developed through a combination of two separate measurement tools. Parts of the survey instrument were developed by a team of administrators and Bible teachers and provided thirteen of the survey items for the Spiritual Health Survey. The seventeen remaining survey items were drawn from the LifeWay Spiritual Growth Assessment (LifeWay, 2006). (McBane, 2017, p. 128)
The questions are responded to using a six-point Likert scale. To understand spiritual health both in an internal experienced way and in an external behavioral way, the researcher focused on a range of questions, including on family dynamics, church attendance, schools attended, and others.
Using an exploratory factor analysis, the author found three main latent factors: “Relationship with God,” “Relationship with others,” and “Confident testimony.” To provide a sense of the instrument, the top three variables (of ten) loading on “Relationship with God” were as follows (in descending order): “I remain confident of God’s love and provision during difficult times,” “I replace impure or inappropriate thoughts with God’s truth,” and “I trust God to answer when I pray and wait patiently on His timing.” In terms of “Relationships with others,” the top three variables (of five) were: “I go out of my way to show love to people I meet,” “I forgive others when their actions harm me,” and “I act as if others’ needs are as important as my own” (McBane, 2017, p. 132). Three variables (of three) that loaded on “Confident testimony” were the following (in descending order): “I am prepared to share my testimony at any time.” “When asked about my faith, I remain firm in my testimony.” “I have relationships with non-believers and share my testimony with them.” (McBane, 2017, p. 133).
The author notes that self-reporting surveys have their limitations, and there may be norms of expected ideologies within a Christian school that may lead to some limitations in the responses. Also, the maturity level of the middle-school-aged learners may be a factor. (McBane, 2017, pp. 142 - 143)
There was no statistically significant relationship between “spiritual health” as measured and academic performance (the self-reported cumulative GPA). Finally, the researcher suggests that …”faith-based schools should be strategic in their formal improvement planning and target specific aspects of student spiritual growth” (McBane, 2017, p. 122).
Educator TPACK Sophistication and Learner Success
Educators who are able to strategically integrate technology, pedagogy, and content knowledge are better able to support their students in their learning and achievements. Wofford L. Green’s “Educator Technological Pedagogical Content Knowledge and Student Achievement” (Ch. 6) uses the TPACK framework to identify teachers who are effective in supporting student achievement (as measured by state-mandated standardized assessments). His research is based on a school district in rural Georgia, whose teachers responded to a 50-question TPACK survey. An exploratory factor analysis of the results identified three important factors: instructional practice, technology integration and technology knowledge.
Subsequent to the EFA, Green used the factor scores as input for k-means cluster analysis, “which yielded three teacher profiles: High-TPACK, Mid-TPACK, and Low-TPACK”; from these categories, demographic data, levels of education, and years of experience were extracted. Those with higher levels of TPACK have students who perform better on standardized assessments. A t-test was run on student performance on the standardized assessments separated out by teachers:
Further, a t-test showed that the average percentage of students meeting and exceeding standards was significantly higher for the teachers in the High-TPACK cluster than in the Mid-TPACK cluster (t(97) = -3.045, p=.004) (Green, 2017, pp. 165 - 166).
Green identified a gender gap in his research, with females predominantly in the Low-TPACK and Mid-TPACK clusters. The High-TPACK cluster were mostly males and trended younger, with most under 45 (Green, 2017, pp. 183 - 184).
The factor correlation matrix showed a moderate correlation between Instructional Practice and Technology Integration with a correlation coefficient of 0.369. There was also a moderate correlation between Instructional Practice and Technology Knowledge with a correlation coefficient of 0.359. There was a relatively strong correlation between Technology Integration and Technology Knowledge with a correlation coefficient of 0.588. (Green, 2017, p. 182)
Finally, this layered research work offers practical takeaways—to encourage teacher technology use and improve professional development geared towards higher TPACK. The takeaways are not about stereotyping instructors based on age, years in the field, gender, or other factors (Green, 2017, pp. 165 - 166).
Some Askable Questions with Exploratory Factor Analysis
The questions asked in an applied research context have to do with acquiring awareness and solving real-world problems. The questions emerge from people's observations in the workplace and in society. It seems a little contorted and limiting to begin with a statistical method and see what questions may be asked from that. Also, this collection contains six examples only, and these clearly do not capture the universe of possible applications of exploratory factor analysis in education. Depending on the available data, it is possible to ask and answer various questions. For example, here are some askable questions:
- Is this test or survey instrument assessing what it is assumed to be testing (validity re: underlying constructs)? Is the instrument reliable (based on Cronbach’s alpha)? [This information can be used for pilot-testing of an instrument before its revision and full deployment.]
- In (auto- or manually-) coded data about communities communicating on social media, what underlying factors are there in discussions around particular topics?
And for confirmatory factor analysis, various types of hypotheses may be proposed and tested.
- In a particular theorized model, with hypothesized relationships between variables, does the model hold water? If so, how so? If not, how not?
In terms of how well particular questions are answered by this process, this clearly depends on how the research is designed, how data is collected and handled, how factors are extracted, how factors are understood and analyzed, and what decisions are made from the data.
Worth the Effort?
Is it worth the effort to learn the in’s and out’s of exploratory factor analysis? To understand the abstractions and the rationales behind the setting of parameters and the analysis and decision-making?
The answer to the initial question may depend on the person’s professional role. Will he or she need to conduct data analysis to understand underlying factors? Will there be occasions to handle large-scale datasets that would benefit from data summarization to reduced common factors?
In this current age, the hard maths and statistical analyses are all borne by computers. These techniques enable reproducibility and repeatability of most statistical techniques. Yet, people carry responsibilities, too. Researchers may do any or all of the following:
- conceptualize the application of the statistical analysis to a real world challenge
- properly collect data
- properly clean data
- maintain accurate records about the data
- set the parameters correctly for various statistical analyses
- run statistical analyses and troubleshoot potential issues
- analyze the findings and identify both patterns and anomalies from statistical analyses
- interpret the factors and apply labels to them
- report out the findings in clear and precise language
- follow through on decision-making and other relevant work
There are a number of statistical analysis techniques that may be applied to education data for school improvement, and exploratory (and confirmatory) factor analyses are practical and valuable for insights that would otherwise remain hidden. (There are other types of statistical methods to surface latent factors. Each statistical technique has its own assumptions, data requirements, and strengths and weaknesses.)
Harnessing statistics may seem daunting at first. The underlying processes may seem elusive. There are so many options at each phase of the setup to run statistical analyses (especially in stepwise procedures). There are so many complex nuances to reasoning with numbers.
That said, there has been no better age than the present to approach statistical learning because there are so many powerful resources (Khan Academy, certain channels on YouTube, free MOOCs, and others) and so many ways to come at the information: videos, with worked examples and stories and visualizations; mathematical notations; and walk-throughs.
Exploratory factor analysis does not require any unusual data structures or unusual data cleaning. Typical structured datasets from surveys and other types of research are sufficient, assuming that researchers have access to the relevant data, know the data’s provenance, have a right to use the data for research...and that the data has some degree of multicollinearity between variables EFA may be applied as a one-off, or it may be part of a sequence of statistical procedures to surface different insights.
Conclusion
Finally, Diana Mindrila’s Exploratory Factor Analysis: Applications in School Improvement Research (2017) is a meticulously described and tightly edited collection. Its coherent succinctness is a strength in that it makes the work seem eminently doable and interesting. The applied aspect of the works encourage practitioners to integrate research into their practice and even to conduct their own research for informed and empirical data-driven decision-making. The use of IBM’s SPSS for many (all?) of these works is helpful given the ubiquity of this tool, the easy navigability of the various statistical runs (in the left menu), the educational discounts available, its well documented support, and the ability to run various statistical tests with default parameters. The writing precision is helpful because the decision-making logic is transparent and clear. The uses of data tables, data visualizations, scree plots, and line graphs enhance the approachability of the information.
EFA, interestingly, is identifying latent factors based on how respondents reply to surveys and perform in courses. This suggests that human populations themselves are responsive to underlying factors that they bring to the survey and / or assessment.
The fact that many of the authors describe their research work from Georgia is a limitation; more diverse geographical examples and cases may highlight different insights. Also, it seems that only survey data was engaged, and this, too, can be a limitation. Seeing how EFA applies to grade data, for example, would be helpful. Readers should approach exploratory factor analysis as a tool that can be applied broadly, even beyond the examples in this work. Also, none of the examples dealt with more complex data handling, such as splitting datasets into time periods to see how underlying factors may have evolved over longitudinal time.
About the Author
Shalin Hai-Jew works as an instructional designer at Kansas State University. Her email is shalin@k-state.edu.
| Previous page on path | Cover, page 22 of 26 | Next page on path |
Discussion of "Book Review: Improving School Practice through Exploratory Factor Analysis"
Add your voice to this discussion.
Checking your signed in status ...