Introduction to Big Data
By Donna Bridgham, Division of Aging and Rehabilitative Services, Commonwealth of Virginia
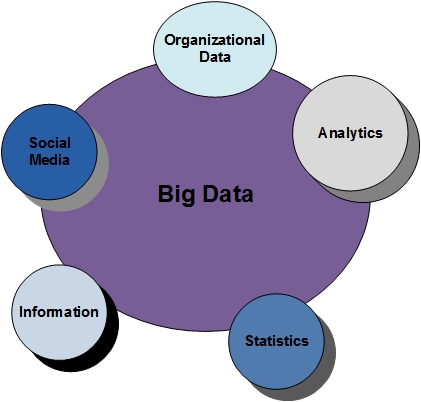
In the world of never ending collection of data and information Big Data is a term that is used to describe the exponential growth and availability of data that can either be structured or unstructured (SAS, 2014). For large businesses big data may become as important as other technology such as the Internet since more data will lead to more accurate analysis. This will be important since data is collected and these decisions will impact the well-being of organizations. This will include the potential well-being or quality of life based on the analysis of the types of data collected and can reduce the potential of cost and time savings of operations (SAS, 2014).
Figure 1: Big Data
Some Background on Big Data
The original thought of big data was volume, velocity and variety. Volume at one time was dictated by the cost of storage and the capabilities of storing data (SAS, 2014). These issues have turned now to what type of data should be stored and how large of a data set should be collected to do analytics. With the emergence of social media and transaction based data organizations have to decide what type of data is relevant to their business and within the large volume of the data collected how much do they want to use (SAS, 2014).
The next issue with data was the speed. Data streaming at one time could crash an entire network if it was not done correctly or if organizations did not control the streaming. Today data is able to stream at a high rate of speed and can deal with the data in a timely fashion (SAS, 2014). There are many ways to deal with the data so most data can be considered no matter how large the load is rendered in real time. Being able to deal with the data and maintain the data in an almost real time environment can be a challenge but understanding how velocity and volume work together is instrumental to success.
Variety is a factor since the types of data formats that are collected can be numerous. Data can come from databases, text files, excel spread sheets to name a few (SAS, 2014). Some of the formats will be structures and some of the formats will be unstructured. Being able to merge and manage the data is one of the challenges to organizations. In order to use the data it must come together in some way in order to use it as part of the analysis.
At SAS one of the surveys that used to poll companies that used big data agreed that “It’s About Variety, not Volume: The survey indicates companies are focused on the variety of data, not its volume, both today and in three years. The most important goal and potential reward of Big Data initiatives is the ability to analyze diverse data sources and new data types, not managing very large data sets” (SAS, 2014, para. 5).
Need for Big Data
The United States Government has researched the need for big data and what will happen with data in such professional fields, as the health field, federal research projects, how public and private organizations handle data and how privacy laws are managed (2013). The question of management challenges, workforce development issues and applications of big data have been questioned. A committee has been assigned to see how big data is being handled now and what the consequences of big data will be in the future. The committee has been tasked to see what the significance of big data is, how it can be enhanced, how the technology within the government can handle it and will the United States be able to handle the onslaught of big data (United States Government, 2013).
When dealing with data with a supercomputer measures are in flops. A petaflop gives the computer the ability to do one quadrillion floating point operations per seconds (Webopedia, 2014). "A petaflop is measured as one thousand teraflops. A petaflop computer will require an enormous number of computers that work in parallel on the same problem. The application may do anything from a real life astrophysical simulation to a nuclear imaging resonance during a surgery" (Webopedia, 2014). The National Science Foundation using the supercomputers to solve science problems dealing with climate, medicine, graphing and other issues that involve big data.
Decision Making in Using Data Warehousing
In the world of business and technology today, it is expected that fast and quick decision are delivered which will help organizations to succeed. Creating a well-defined and structured data warehouse can help to support the decision making within an organization (Golfarelli & Rizzi, 2009). The data warehouse will contain current and historical data that will be help for stakeholders and managers to make decisions. When purchasing an enterprise database such as SQL Server with that always a multitude of databases there could be a need to create an integrated warehouse where all the data is shared by each department for each department through the different databases. The organization would be in need of such a repository so that decision makers will have access to data in order to analyze that data to improve the organizational operational processes. At this point it should also be decided if the data warehouse is considered a warehouse or an extension of Big Data.
A data warehouse is a subject oriented, integrated and time varying repository. The data warehouse is a collection of data that will be used to support decision making processes by the management. This is made possible since the data warehouse is the repository or the centralized data center that will store the data from all the data sources and allow them to be transformed into a multidimensional model that if designed correctly will query efficiently for analysis (Stat 4 U, 2009). The question then becomes, is a data warehouse a small piece of the collection of Big Data or is Big Data a holding of Big Data.
Architecture
Data Marts can be set up for every department within an organization and for most tasks done within the department. Since there may be cost constraints and time constraints a bottom up methodology is a used by many organizations for the initial design. Then the two- layer architecture will be used since it will be critical to use the ETL tools to ensure that the data is cleansed and the integrity of the data is not compromised. Golfarelli and Rizzi explain that the two layer architecture would be beneficial to an organization since the data flow is in four stages; the source layer, the data staging, the data warehouse layer and analysis. In the data staging stage, the ETL is used (Golfarelli & Rizzi, 2009). The ETL is the Extraction, Transformation, and Loading tools. This would allow different databases to work together. This will affirm the use of creating a data warehouse if you already have an enterprise database server. This allow the use of the all the data collected in an enterprise database that has been integrated into the data warehouse.
The ETL takes three database functions which are extracting, transforming and loading data and combines it into one tool to allow data to be pulled out of one database and pulled into another. This would allow an organization to migrate data from one database to another and form a data mart and data warehouse. The difference though between the data mart and the data warehouse is that the data mart is an aggregation of the data stored to the primary data warehouse (Golfarelli & Rizzi, 2009).
Setting up the Data
The biggest obstacle in setting up the data warehouse is so that the data is compatible. If the data that is being used in one database is not cleaned up and made compatible to work within the data warehouse there would be errors and an incorrect design. If the constructs within the data are compatible they are said to be comparable or understandable (Golfarelli & Rizzi, 2009). The compatibility would be if an employee is assigned to a department and also that one or more departments are assigned to a region. The schemata may not be equivalent but it is not incompatible because there is an understanding of region to department. The incompatibility is when the specifications are inconsistent. The set of objects in R1 deny the set of objects in R2 (Golfarelli & Rizzi, 2009). An incompatible schemata is when a department cannot have more than one manger and the other specification is that the departments need to have at least two managers on duty (2009). This would create conflicting results and the data source for the departments would need to be modeled.
Both scenarios would cause a conflict but the compatible schemata can be mapped and modeled through a quick analysis. The incompatibility schemata would need to be analyzed to evaluate for errors, inconsistency and incorrect design. This could cause delays or if not fixed incorrect reports. The only way to fix this is to find a consistent key or define a key between the data or check the business process. This would be consistent with the reporting in a Big Data environment also.
In the schema comparison there are several areas in this phase that may cause conflicts. One of the biggest conflicts that are usually encountered is the name conflicts. This is due to different developers using different terms that may or may not mean the same thing. It is similar to language; you have homonymies and synonymies (Golfarelli & Rizzi, 2006). In homonymies, the term will stand for two different concepts while synonymies are equivalent representations of the same concept with different terms. Golfarelli and Rizzi write that one common name conflict in Business Intelligence is CUSTOMER and PURCHASER (2009). It is important to have a data dictionary and an understanding of how these terms work in relationship to the data in the schemata so there is not duplicated data.
Staging
The data warehouse needs to be designed so that the all the sources are set up in order for all the ETL steps to be performed. This area is called the staging area and the major ETL steps are done in this area. Rahman in an article written in 2007 suggested that there be another area called an auxiliary area. The auxiliary area would be devoted to subject area structures that are set up within the data warehouse to buffer the actual data in the warehouse and the data translator. Therefore there would be a two-step process to update the data.
This will ensure that the data warehouse is being used at its optimal system evaluation tasks. The first step is gathering the data from the operational source system and then loads the data into the staging subject area tables using the ETL tools (Rahman, 2007). Then the data is staged into the auxiliary structure of the warehouse. The analytical subject areas are refreshed by bringing data from the staging area using transformational logic in stored procedures. By using this process, the data will have been processed and analyzed based on specific logic that will help in the decision making process (Rahman, 2007). The key to the success is setting up the staging area. Once again, this is a process that will decrease errors and increase the capability to make better business and management decisions by optimizing the tools that are already available to the developers.
Early Design
Luján-Mora and Trujillo in 2006 proposed that the design of the data warehouse from the beginning will relieve some of the issues that data warehouses encounter if they are designed after data has been brought into storage. The issues of physical storage, query performance and risks need to be discussed in the early stages of the project. That is why if an organization purchases an enterprise database such as Oracle or SQL Server they know the capabilities of the hardware and the software and plan accordingly. In the initial meetings of project design usually the managers, users, business analysts and data administrators or DBA’s attend the meetings and many precursory decisions can be made that will affect all projects (2006).
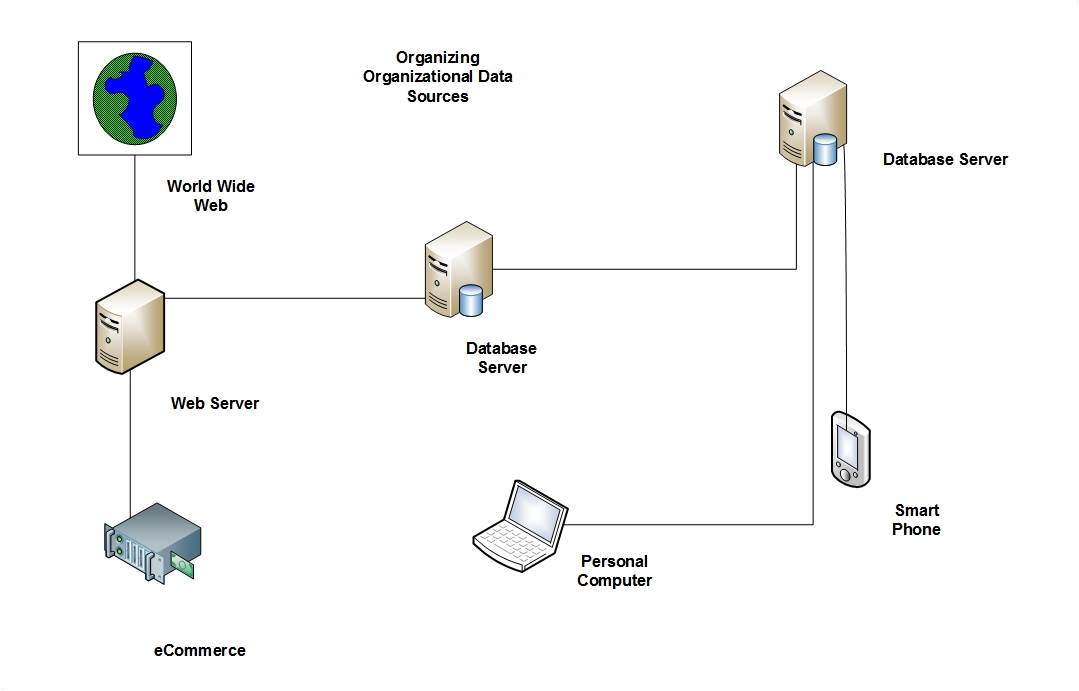
The reason is that in data warehouse (DW) projects, final users, analysts, business managers, DW designers, and database administrators participate at least in the first meetings. At this meeting many decisions can be discussed that will impact the use of the data warehouse (Luján-Mora & Trujillo, 2006). Each person can identify the sources where data is presently coming from and where it is stored in the organization. An example of different data sources are in Figure 2. This will give the data administrators an idea of what needs to be done and how the design will be carried out.
The decisions that should be made in the preliminary meetings are the capabilities of the hard disk in relationship to anticipated tables and views, the ability to partition and dimension tables, a clear and concise list of user requirements, and the estimated workload based on the scenarios (Luján-Mora & Trujillo, 2006). By doing this work before creating a data warehouse, money and time will be saved since it is a part of the original project plan. By utilizing all aspects of the enterprise data base, reports will be enhanced, the amount of errors will be reduced, and sound decisions will be made based on the sound design.
Figure 2: Data Sources for an Organization
Putting it Together
So as early as possible all the data sources need to be defined such as the OLTP system, any external sources, internal sources and other sources that may be needed. Then the mapping needs to be discussed so there is a smooth integration between all of the data sources and the data warehouse (Luján-Mora & Trujillo, 2006). The structure of the data warehouse needs to be defined and if the use of the data marts will be used need to be discussed at this point. The use of data marts will determine further architectural and mapping definitions.
The customization of the mapping will be set up and a use of a data dictionary will be used to keep all language consistent. The mapping will define the information between the data warehouse and the client’s structure (Luján-Mora & Trujillo, 2006). The client will define the any special structures that are used to access the data warehouse which will include data marts or OLAP Applications. The logical design will define the ETL process and business processes needed to fulfill requirements (Luján-Mora & Trujillo, 2006). The physical design will define the storage of the logical design and the configuration of the database servers.
The Issues with Data Workloads
The workloads need to be analyzed and characterized to see the impact of running more than one workload at a time. It is important to test and analyze the impact of running and executing multiple workloads at the same time. If some of the workloads do not work well together when executed at the same time it will impact the performance of one or more workloads (BMC.Com, n.d). The best way to keep peak performance is to not run these workloads at the same time.
For some data warehouses, they may have say three workloads that need to be run separately because they have an impact on each other if they are run together. To avoid performance issues one is run at 12:00 AM, one is run at 3:00 AM and on is run at 6:00 AM. If there are issues with executing any of the workloads an email is sent so that an analysis can be done to see what caused the issues. These issues may impact an entire work process s the choice here would be to use a data mart or use Big Data.
By creating data marts you can reduce the impact of the workloads negative performance. The marts can divide the work across the different data marts reducing the chance of other workloads competing for same execution time (BMC.Com, n.d). This will decrease the negative impact on the server.
Another factor that will impact the workloads is the clean-up of the data. If the data has not been analyzed and normalized or mapped correctly it will affect the workloads (BMC.Com, n.d). The workloads will be trying to be move data from one source to another when it cannot be moved since it was not structured properly.
Performance management of the data warehouse is based on the architecture and designer/developer. They must understand the data that will be used in the data warehouse and how the data will be used. From that point on, how the data is taken care will impact the performance of ever action going forward.
MOLAP is when data is stored in a multidimensional cube. The storage is in proprietary format and not in a relational database. The allows for good performance since the cubes are built for fast retrieval and are ideal for any slicing and dicing operations needed. If complex calculations are needed they can be pre-generated when the cube is created which returns a fast return on the calculation.
On the other hand the amount of data that MOLAP can handle is limited for calculations since the calculations are performed as the cube is being built which reduces the amount of data that can be rendered in the cube. The addition of cube technology may cost more money to an organization since the technology is very proprietary.
ROLAP manipulates the data that is stored in a relational database so it looks like the traditional OLAP slicing and dicing functionality. Slicing and dicing is equal to adding a where clause to the SQL statement. The advantage of using ROLAP is that it can handle large amounts of data and is only limited by the underlying relational database. Since a relational database has inherent functionalities ROLAP can pull these functionalities into its data manipulation.
The ROLAP performance can be slow since each ROLAP report is a SQL query. The time of the query is based on the size of the data. ROLAP is limited by SQL statements and SQL statements can not perform some complex calculations.
HOLAP tries to combine the best features of MOLAP and ROLAP. HOLAP uses cube technology for quick performance but when detailed information is needed HOLAP can go beyond the cube to the relational database when needed. The partitions that are stored as HOLAP are smaller than the MOLAP partitions since they do not contain source data and respond faster than ROLAP partitions for queries involving summary data.
Data Marts
When building a data warehouse one of the considerations is whether or not to include data marts. As well as many organizations not using data warehouses when they have the opportunity too, they do not use data marts when they would help with design and performance. Microsoft has a data warehouse architecture that includes high speed, parallel transfers between Madison which is grid enabling strategy and SQL Server 2008 databases (Microsoft, 2014). This architecture provides the ability to enable large enterprises to build an effective and highly scalable hub-and-spoke enterprise data warehouse that helps to meet today’s business needs (Microsoft, 2014).
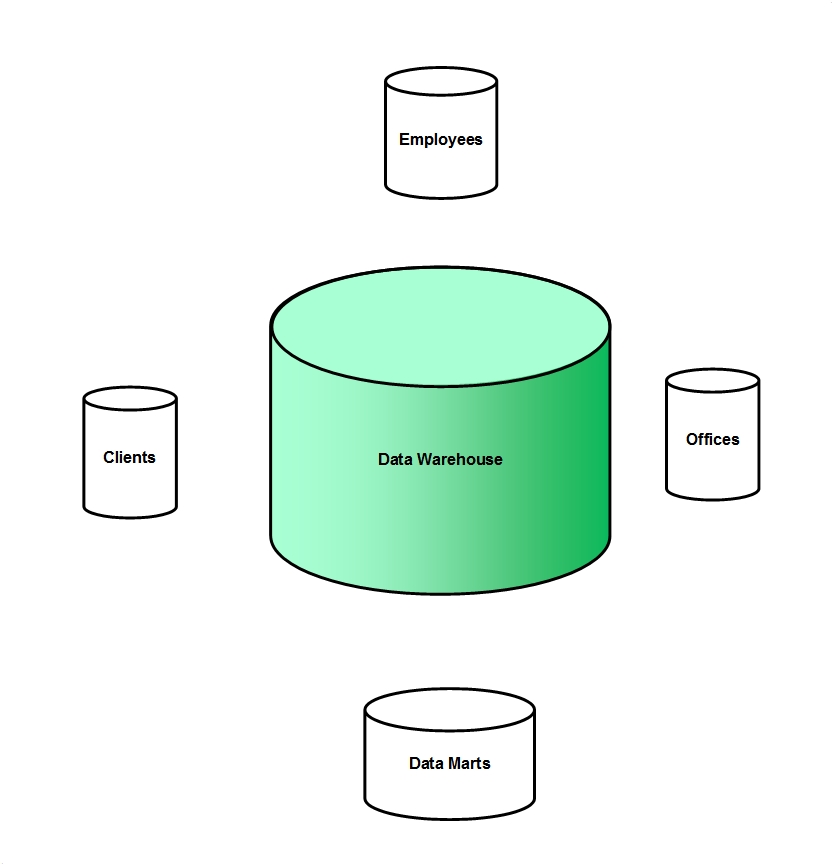
This will allow organizations alternatives to monumental and centralized approaches. Then data marts can be created to meet the needs of the organizations to increase performance and capacity as illustrated in Figure 3. By using the Enterprise Data Warehouse the deployment of a few stand alone data marts on SQL Server data warehouse reference architecture can be used. This will be cost effective, flexible, improve performance, and allows full use of the capabilities of SQL Server.
Figure 3: Data Marts with a Data Warehouse
Improving Performance
In order to use a data warehouse and data marts you have to understand the organizational business needs and know how the capabilities of using data can improve your business processes (Golfarelli & Rizzi, 2009). By working with the Information Technology Department, using the data the organization an ETL project can be set up by creating data marts. The data marts will be built to fulfill requirements within the organization to answer questions that decisions need to be made on based on data that is constantly being collected. There will be a requirements phase, a conceptual phase, the design of the schema, a logical design and then the physical design (Golfarelli & Rizzi, 2009. This will be done by the DBA or the database specialist.
The data marts will be designed to gain an analysis of employee data, relationship between employees, and determine how this will be useful in original scenario to go along with client data. The data marts will then be used to determine if the additional use of employee data will bring back relevant information to users. The ETL processes can test the back end early to ensure that the data marts are set up properly and return useful data sets and results sets (Golfarelli & Rizzi, 2009. It is proposed that the use of employee data will show client load, geographical representation, retention and other useful data.
Improved Management
To help management make better decisions the design and then maintaining the warehouse are paramount to making sound decisions based on results sets. The strategy of a data warehouse is to make efficient decisions based on the quality of the data (Malhorta, 2006). If the data is not maintained the quality of the decisions will not be reliable. Management should work with designers to make sure that there is a strategy for each result set. Each result set should have a goal based on a requirement. The designers need to be able to analyze the risk of each goal.
The decisions should be evaluated throughout the testing phases and throughout the lifecycle of the data warehouse or the data marts. The manager should know through experience or through reasoning if the result set is reliable (Malhotra, 2006). The managers must work with the DBA’s or developers to ensure that the there is good data and a good result set through analysis.
According to Malhotra in 2006 the following processes were needed to be used to give managers data that they could rely on. The manager must be part of the process and each process must follow the same sequence of steps before becoming a final decisions. There needs to be a definition as to when and where to make the decision within the process. There needs to be a point where the decision is completely declared and what the decision is and who will work with the decision. The criteria will need to be selected and it needs to be clear and concise. The manager must make create alternatives based on the information and then chose and commit to the decision that will best fulfill your goal (2006).
When managers are part of the analysis and discover phases the result sets will be in line with their goals. The managers can set milestones and will get results in real time, when needed and as needed. This will improve the decision making process for the managers and will increase their productivity. They will no longer have to run hand analysis or wait for reports from each data source.
In our scenario with employees, by creating more data marts on employee data the organization will be more efficient. If the organization is only using the data warehouse for customer or client based data the full functionality of the data warehouse is not being used. So the designers can work with the managers to create processes to fulfill the goals needed by human resources on employee data and by managers who need employee/client data.
Challenges
The challenges of data warehousing is that users and stakeholders expect immediate results. When first designing a data warehouse the design, fact finding, gathering of requirements may take more time to implement than management expected (Moore, 1999). It may be hard to determine and define a clear implementation plan and strategy when involving all stakeholders (Moore, 1999). It may be difficult to measure the impact if the goals are not refines. It is important that all members of the project team go through the design process and bring clear and concise goals and requirements.
Since many of the reports and result sets are used by end users who are not part of the ongoing design team, it may take time to get feedback. It is important that ongoing testing is done so that the end user does provide feedback so that a complete analysis can be done and scenarios are checked against requirements. This may add time to the development time but will produce better results which will reduce cost and time in the long run (Moore, 1999)
The other challenge when dealing with a data warehouse is understanding the amount of data you have at the beginning of the project and the amount of data that will be collected during the its lifecycle (Golfarelli & Rizzi, 2009). Making sure that there is normalization, data integrity and the ETL process is run properly will increase the productivity of the data analysis. It is still important to know how much data your server can process, knowing how the data sources are bringing the data into the warehouse and ensuring that the data has been mapped properly (Golfarelli & Rizzi, 2009).
Sensors
One of the new technologies that have helped to increase the amount of data is the use of sensors. Davenport and Dyche write that companies such as UPS have increased their data input by using telematic sensors (2013). The sensors have been put on the UPS trucks or car and show the vehicles and drivers performance for speed, direction, parking, and other performance points. The sensors are used to evaluate performance and to evaluate if the drivers are using the best possible route for deliveries. “This initiative, called ORION (On-Road Integrated Optimization and Navigation), is arguably the world’s largest operations research project” (Davenport & Dyche, 2013, p. 4.). Even though UPS has tripled the amount of data that they collect in the past 20 years on performance it has saved the company $30 million on one daily mile per driver by reducing 85 million miles off its daily routes. The analytics of the big data has led to substantial cost savings and has led to a higher degree of efficiency.
UPS is known for its brown trucks with the UPS seal on the side It monitors, when the doors are opened, when the brakes are used, when the driver stops at frequently used businesses such as Federal and State Buildings. UPS is hoping to create more analytics to save more money and increase customer satisfaction.
To go along with sensors, Davenport and Dyche write that Hadoop and analytic software is becoming instrumental to analyzing and using big data (2013). Groups such as Caesar’s entertainment have been a model for using analytics for customer loyalty, marketing and providing services. Since data for customer services can be more beneficial in real time it is important to work analytics that have the capability to incorporate big data technologies as well as the skills to implement the tools that allows customers to see immediate results. The results would come from either web based applications or playing a slot machine in real time. The biggest challenge for Caesars had been to integrate all the services of their Total Reward Program so the customer can collect their rewards almost in real time.
Hadoop
Hadoop is a technology that allows organizations to index textural and structural information that is being collected and then return results sets to users that have meaning (Turner, 2011). Google first created a platform called Nutch which was open source and the Hadoop was created from that technology. Yahoo took the technology and developed it further for enterprise applications (Turner, 2011). IBM’s Apache supports Hadoop which is an open source software project that will allow large data sets across clusters of commodity servers. The design allows the ability to range from a single server to thousands of machines. The clusters come from the software’s ability to find and handle the failures of the application layer.
Hedlund created a simple diagram to show how clusters in Hadoop work (2011). As stated Hadoop was created to help businesses and governments analyzed and processed tremendous amounts of data very quickly. By reducing huge chunks of data into small chunks and spread it out over many machines they then have all those machines process their portion of the data in parallel. This explains what Hadoop does.
Hedlund’s design shows the world in relation to the switches (2011). Then each switch is set up in relation to its rack. There is Rack 1, Rack 2, Rack 3, Rack 4 and then Rack to the N. The Hadoop concept is defined by the rack of each data node in your cluster. The reasons for the node are to prevent data loss and performance for the network. Each block of data will be replicated to prevent failure as it moves from machine to machine (Hedlund, 2011). This will keep from losing all the data if one of the machines fails.
If a there was a power failure or a switch failure there would be a chance that the data could be lost. If all the data was on the same rack all copies of the data would be lost which would be unacceptable (Hedlund, 2011). To avoid this type of catastrophe, the designer needs to be able to identify where the data nodes are located on the network. Intelligent decisions need to be made to identify where the data replicas need to be placed in the cluster. This is where the name node is essential to the process and will reduce the chance of failure.
Hadoop was designed to solve problems when there is a lot of data whether it is complex or structured or a mixture. Hadoop is for analytics that are computationally intense, either as clusters or targets (Turner, 2011). Google used this concept for indexing the web and improving the user experience through enhanced performance algorithms. Hadoop can be used in finance, retail, and other online businesses (2011).
Since its inception Hadoop has become an important technology for big data. In order to achieve the real time experience from all the data sources for customers; Hadoop clusters and open source commercial analytic software can be used (Davenport & Dyche, 2013). In casinos, Caesar’s is using this technology. Caesar’s goal is to ensure that their loyal customers are taken care of. With video analytics on big data tools, Caesar’s is able to use automated ways to spot service issues. By using the different big data technologies, Caesar’s can improve the customer experience for their new customers and their loyal customers. This issue lies in whether the customer is aware of this service.
Another company that is has collected data and had a need to find a way to make it usable was United Healthcare. United Healthcare had unstructured data in the form of customer calls to call centers (Davenport & Dyche, 2013). The company had no way to transcribe the amount of data into a useful format until they started use a variety of tools. The consumer calls are now turned into text files. In order to analyze the text data the data goes into a data lake using Hadoop and NoSQL storage in order not to normalize the data Davenport & Dyche, 2013). By using different strategies and technologies United Healthcare is still testing technologies to give the best analysis of customer concerns. At the present time United Health care is using interfaces that use statistical analysis tools and Hadoop.
Many departments within United Healthcare need to provide customer satisfaction. The data analyzed must be used in different ways from using the data for finances, to customer services, to selling individual services and predicting related services Davenport and Dyche, 2013). The IT department must work with the data team to bring together all the data to set up predictive analytics that will strengthen the company.
Data Warehousing
Materialized views can be used in data warehouses. The materialized view can be used to precalculate and store aggregate data like the sum of the sales (Oracle, 1999). These views are referred to as summaries since they will store data that is summarized. The materialized view can also precalculate joins with or without using an aggregate (Oracle, 1999).. The materialized view can eliminate the cost associated with running expensive joins or aggregates that are large.
In a distributed environment the materialized view is used to replicate data at distributed sites. This will allow synchronized updates that can be done at several sites with a conflict resolution method (Oracle, 1999). The materialized view that is a replica that can provide local access to data that under normal conditions would have to be accessed through a remote site.
In order to use materialized views the schema should reviewed and make sure that it follows design guidelines (Oracle, 1999). Some of the guidelines are the dimensions should be demoralized or the joins between the tables should be set that the child side rows joins only with one parent side row. If the dimensions are demoralized the hierarchical integrity needs to be maintained between the key columns of the dimensional table (Oracle, 1999). The child key should uniquely identify the parent key value. The fact table and dimension table need to show that each fact table row joins with one and just only one dimension table row.
It is important that when using views they are used to improve the performance. By making sure the schema and design is done correctly the views will help with summaries and replication. These are a few of the ways that views can be used.
Purpose of the Reconciled Database
The reconciliation of a database focuses on the integrity and quality of the database or the data set. The reconciliation of the database is the superset of data reconciliation (Golfarelli & Rizzi, 2009). Data reconciliation is used to deal with the integrity and accuracy of the individual records of data quantities. After data migration, data reconciliation is brought up to ensure that the validity of the data set is still intact.
In BI, the consistency of the data between various process steps needs to spot on. Data reconciliation will allow for the consistency of the data that is loaded into the BI and is then available for use. The data reconciliation can be based on comparing the data loaded into the BI and the application data from the source system. To complete this comparison the data is accessed in the source system directly.
Reconciled data as described by Golfarelli and Rizzi is proposed as the integrated and normalized version of the operational database. It should maintain the same properties (2009). The time of the reconciled data should be equal to or no longer than the operational data.
In ETL, populating the reconciled database is the goal of the data integration and cleansing phases. The reconciled schema and its data should be free from errors and consistent. Data mart designers should understand the operational data sources. It should be materialized if possible (Golfarelli & Rizzi, 2009).
Conclusion
As the United States Government has concluded in their research in 2013, one of the biggest challenges of big data is the workforce and the ongoing need for tools that can handle the amount of data that is being processed. Since data no longer has to stay in one file format or one database the amount of data that can be processed is overwhelming. To help keep up with the demands the National Science Foundation is offering educational support and activities to help support big data researchers (United States Government, 2013). There is a shortage of workers that have the skills to maintain and analyze the high velocity of data sets and the velocity of the data sets.
To go along with the shortage of workers and tools are the issues of privacy. Since big data can be produced and transferred to other sources quickly developers and organizations should be concerned with privacy (United States Government, 2013). There needs to be better ways to ensure that organization are protecting their data and protecting the right of individuals.
Big Data is allowing companies and organizations to solve problems and provide services that were never conceivable. Big Data can solve medical problems, help with communication and messaging issues, help predict climate events and present graphs that will improve the quality of life and may even save lives. In the retail world or business world, customers will be able to receive services and quality in real time. Many different types of business can work together along. This is also a way to share data globally but once again, developers and IT departments most protect the data, maintain the integrity of the data and understand the data.
References
BMC.Com. (n.d). Performance management of a Data Warehouse. Retrieved from http://documents.bmc.com/products/documents/93/24/9324/100034259/index.htm
Davenport, T. & Dyche, J. (2013). Big data in big companies. Retrieved from http://www.sas.com/resources/asset/Big-Data-in-Big-Companies.pdf
Golfarelli, M & Rizzi, S. (2009). Data warehouse design: Modern principles and methodologies. McGraw-Hill/Osborne.
Hedlund, B. (2011). Understanding Hadoop. Retrieved from http://bradhedlund.com/2011/09/10/understanding-hadoop-clusters-and-the-network/
Lee, C. (2013). MOLAP, ROLAP, and HOLAP. http://www.1keydata.com/datawarehousing/molap-rolap.html
Luján-Mora, S., & Trujillo, J. (2006). Physical modeling of data warehouses using UML component and deployment diagrams: Design and implementation issues. Journal of Database Management, 17(2), 12-42. Retrieved from http://search.proquest.com/docview/199611468?accountid=8289
Malhotra, N. (2006). Decision environment improvement using data warehouse for efficient organizational decisions. Retrieved from http://opencores.org/articles,1146604753
Microsoft. (2014). Using SQL Server to build a Hub-and-Spoke Enterprise Data Warehouse Architecture. Retrieved from http://technet.microsoft.com/en-us/library/dd458815%28v=sql.100%29.aspx
Moore, R. (1999). The challenges with data warehouses. Retrieved from http://www.information-management.com/issues/19990101/232-1.html
MSDN. (2013). Using SQL Server integration services. Retrieved from http://msdn.microsoft.com/en-us/library/cc671624.aspx
Oracle. (1999). Data warehousing with materialized views. Retrieved from http://www.csee.umbc.edu/portal/help/oracle8/server.815/a67775/ch1.htm
Rahman, N. (2007). REFRESHING DATA WAREHOUSES WITH NEAR REAL-TIME UPDATES. The Journal of Computer Information Systems, 47(3), 71-80. Retrieved from http://search.proquest.com/docview/232574587?accountid=8289
Stat for U. (2009). Data warehouse. Retrieved from http://datawarehouse4u.info/
SAS. (2014). What is big data Retrieved from http://www.sas.com/en_us/insights/big-data/what-is-big-data.html
Turner, J. (2011). Hadoop: What it is, how it works, and what it can do. Retrieved from http://strata.oreilly.com/2011/01/what-is-hadoop.html
United States Government. (2013). Next generation computing and big data analytics. Retrieved from http://www.gpo.gov/fdsys/pkg/CHRG-113hhrg80561/pdf/CHRG-113hhrg80561.pdf
Webopedia. (2014). Petaflop. Retrieved from http://www.webopedia.com/TERM/P/petaflop.html
About the Author
Donna Bridgham is a Systems Analyst with the Commonwealth of Virginia with the Division of Aging and Rehabilitative Services. She provides customer service to the Virginia Department for the Deaf and Hard of Hearing. Bridgham is proficient in breaking down high level information into details for designing databases and prototypes for application design . She also has a technical expertise in data analysis. She has a B.S. from Lyndon State College, an MBA from Northcentral University (NCU), and an MS in Information Technology from American Public University System (APUS). She may be reached at donnabridgham@comcast.net.
| Previous page on path | Issue Navigation, page 9 of 25 | Next page on path |
Discussion of "Introduction to Big Data"
Add your voice to this discussion.
Checking your signed in status ...