Book Review: Four Canonical Data Mining Cases
By Shalin Hai-Jew, Kansas State University
Data Mining: Principles, Applications and Emerging Challenges
Harold L. Capri, Editor
Nova Science Publishers, NY
2015, 131 pp.
The world is awash in queryable data. They are captured by governments, corporations, organizations, and universities; they are generously shared on social media platforms, the Web, and Internet (and these include content data, multimedia, metadata, and trace data). Sensor data are captured and shared. This is all before the full Internet of Things has taken effect when a lot more digital data will be available.
From a prior context of data sparsity, researchers are finding themselves in a context of data richness, with previously unexploited “found data” and publicly available heterogeneous multimedia. The challenge is that much of the data is “big data” and most effectively queried using human smarts (embodied in algorithms) and computer affordances (including blisteringly fast computation, high accuracy, and parallel processing). Data mining is practically applied in a wide range of fields: medical science and diagnostics, environmental sciences, security studies, health sciences, business, marketing, e-learning analytics, and others.
Harold L. Capri’s “Data Mining: Principles, Applications and Emerging Challenges” opens with a broad spectrum and ambitious title but features only four cases. As a short book, “Data Mining…” offers insights into a very complex and broad-scale data analytics approach.
Capri’s preface does not offer much more than a recap of the four chapters’ abstracts and does not give a clear indication of the actual acceptance rate for the publication; however, if the quality of the cases is any indication, a fair amount of work was invested into each, and all four offer unique insights on the practical application of data mining for contemporary researchers. The four cases cover the following: (1) the application of data mining to Beijing’s transit system, (2) e-learning, (3) the phenomena of failed states in political science, and (4) a foundational approach to creating association rules for data mining algorithms.
Figure 1: Harold L. Capri's "Data Mining: Principles, Applications and Emerging Challenges" (Cover)
Harold L. Capri, Editor
Nova Science Publishers, NY
2015, 131 pp.
The world is awash in queryable data. They are captured by governments, corporations, organizations, and universities; they are generously shared on social media platforms, the Web, and Internet (and these include content data, multimedia, metadata, and trace data). Sensor data are captured and shared. This is all before the full Internet of Things has taken effect when a lot more digital data will be available.
From a prior context of data sparsity, researchers are finding themselves in a context of data richness, with previously unexploited “found data” and publicly available heterogeneous multimedia. The challenge is that much of the data is “big data” and most effectively queried using human smarts (embodied in algorithms) and computer affordances (including blisteringly fast computation, high accuracy, and parallel processing). Data mining is practically applied in a wide range of fields: medical science and diagnostics, environmental sciences, security studies, health sciences, business, marketing, e-learning analytics, and others.
Harold L. Capri’s “Data Mining: Principles, Applications and Emerging Challenges” opens with a broad spectrum and ambitious title but features only four cases. As a short book, “Data Mining…” offers insights into a very complex and broad-scale data analytics approach.
Capri’s preface does not offer much more than a recap of the four chapters’ abstracts and does not give a clear indication of the actual acceptance rate for the publication; however, if the quality of the cases is any indication, a fair amount of work was invested into each, and all four offer unique insights on the practical application of data mining for contemporary researchers. The four cases cover the following: (1) the application of data mining to Beijing’s transit system, (2) e-learning, (3) the phenomena of failed states in political science, and (4) a foundational approach to creating association rules for data mining algorithms.
Fusing and Mining Transit System Data with GPS Data to Support Public Transit Services
One of the major competitive advantages of data mining is the ability to capture insights from extant data, including “passive” data that is collected as a side effect (if you will) of the provision of services. Datasets may be fused to enable rich insights that would not be possible otherwise. One very creative and complex approach involves the use of noisy fare collection data and the geolocation of subway trains and busses to measure the performance of a 1,000-route transit system in Beijing, capital city of the People’s Republic of China.
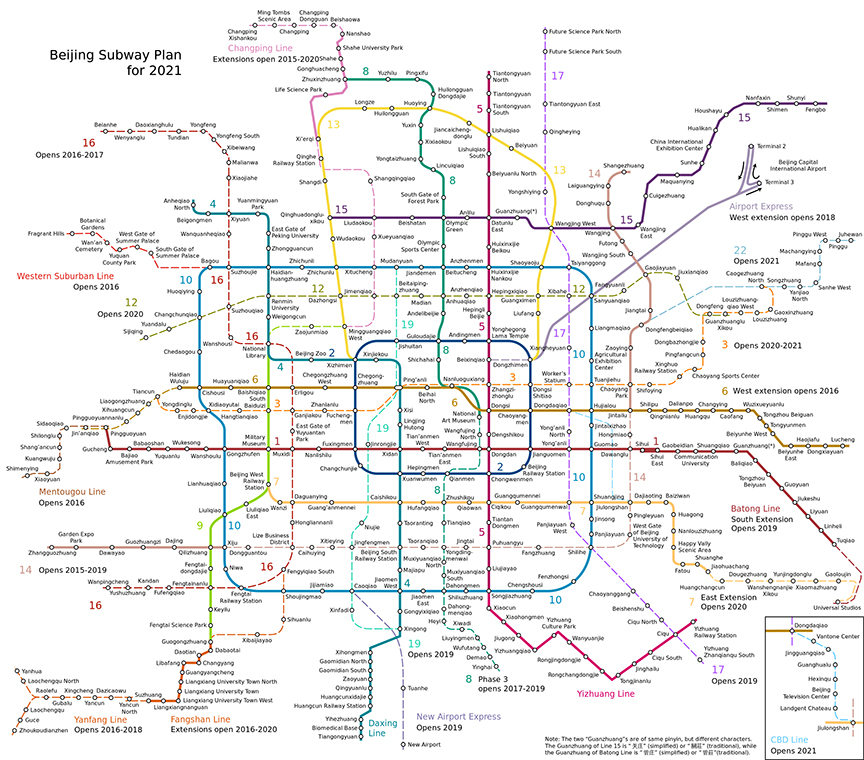
Figure 2: The "Western Suburban Line, Beijing Subway" Map (open-source image on Wikipedia)
Xiaolei Ma and Yinhai Wang’s “Transit Passenger Origin Inference using Smart Card Data and GPS Data” (Ch. 1) opens with the observation of just how dominant the use of privately owned vehicles is for work commutes among Americans (approximately 76% in 2000) and Beijingers (approximately 34% in 2010). Increased use of public transport for commuting to work involves a number of potential benefits: reduction in air pollution, lowered energy consumption, less stress on road infrastructures, lowered traffic congestion and travel delay, and diminished urban sprawl (with transit-oriented development and livable communities with high walkability features). In emergency situations, functioning public transport can make evacuation more effective, and these can be the difference in population survival and well-being.
Ma and Wang, a research team from Beihang University (Beijing) and the University of Washington (Seattle), explore how to turn Automatic Fare Collection (AFC) systems (with smart card readers) and Automatic Vehicle Track (GPS trackers) on public transit vehicles into valuable data about transit rider riding behaviors and transit system performance.
Naively, this may seem like a data mining job that may take only a few days for experts to set up. Then it becomes clear that there are a number of challenges that need to be addressed. The transit data is incomplete. There are some routes with flat fares (so the system does not capture when a rider gets on or off in the check-in or check-out scan but only captures the time of entry into the system); there are distance fares (so the system captures both when a passenger gets on and gets off).
The transit system is comprised of both busses and trains, and only 50% of the vehicles have GPS tracking (Ma & Wang, 2015, p. 6), and there is a fair amount of GPS signal loss because of the high-rise structures in the city due to tall building obstructions. The GPS information lacks vehicle direction information, and there is also GPS point and satellite signal fluctuation (requiring map matching algorithms needed to place the inaccurate GPS spatial records on road networks). The geography itself is challenging, with 1,000 routes in this city with 11.51 million people (in 2000) distributed in 6,487 square miles. In other words, the context is a complex one, and the data is noisy and incomplete. In practice, the buses do not follow a fixed schedule given high ridership demands and changing environmental factors that affect bus timing; only bus routes with long distance ones follow schedules (to accommodate riders). The researchers want to know where the vehicles are at various time periods and where people get on and off in order to understand how well the transit system is working.
The researchers describe how they fuse transit smart card data with roadway geospatial data to estimate transit vehicle arrival information. They used a Bayesian decision tree algorithm to estimate each passenger’s boarding (origin) stop when they could not ascertain this from GPS data. The root node for each Bayesian decision tree was the starting transit stop (origin data) for each rider, and the branches were all the other potential following stops possible from that originating stop and then the likely final destination—with each physical destination given a conditional probability (Ma & Wang, 2015, p. 15). The Bayes method enables the probabilistic assessment of what the true state of a hidden reality may be given available signals. They used the Markov-chain property to lessen the computational burden of the decision-tree algorithm; the Markov chain is used to model linked stochastic (randomly determined) but path-dependent events (in a condition of “memorylessness,” with the next state only reliant on the current state) and whether transition states occur or not. The researchers created their Markov Chain Based Bayesian Decision Classification algorithm with the assumption that a rider moving toward their destination with an increasing probability of StopID. This system aims to capture both boarding (origin) and alighting (destination) stops.
They defined back-end rules for how to handle data, such as clustering time-proxemic rider records based on the assumption that these represent riders getting on a transit vehicle collectively. They assumed a normal distribution of travel speed between adjacent stops and used Bayesian inference to depict the randomness of passenger boarding stops. To assess their equations and algorithms, they used on-board survey and GPS data (Ma & Wang, 2015, p. 4).
As is usual with data cleaning, they removed outlier (or abnormal) rider transaction data. With the inclusion of a greater number of stops, there was an increasing amount of run-time required, highlighting the tradeoff between higher accuracy and lower efficiency (Ma & Wang, 2015, p. 28). Their algorithm does not perform as well if travel speed between adjacent stops is indistinct and variable (Ma & Wang, 2015, pp. 28 – 29).
These findings are applicable to other countries where such Automatic Fare Collection (AFC) and Automatic Vehicle Track (AVT) systems are in use. If nothing else is learned, it helps to note that data often do not come pre-packaged in an analyzable way, and it takes a lot of grit, analytical smarts, and datamining skills to mine data to solve hard problems.
Mining Formative Evaluation in Online Learning Systems
With the popularization of massive open online courses (MOOCs) and adaptive and intelligent online learning systems, data scientists have been busy working on ways to exploit the capture learner data and to apply those insights to improving learner profiling, adaptive learning objects and sequences, automated messaging, automated agentry, and user interfaces. The field itself is quite sophisticated already, which may explain a little of the disappointment from the next work. In a sense, the speed of others work has long trumped the proposal of the following researchers. The authors suggest that three mainstream data mining algorithms from a 20-year-old data mining tool may enhance an automated self-directed online learning-by-doing tool (WebSiela).
Farida Bouarab-Dahmani and Razika Tahi’s “Knowledge Extraction from an Automated Formative Evaluation based on ODALA Approach using the Weka Tool?” (Ch. 2), proposes the use of the free and open-source Weka (Waikato Environment for Knowledge Analysis) tool to datamine formative assessment in online learning systems to understand learner needs. The researchers, who hail from the University of Tizi-Ouzou and the University of Boumerdes, in Algeria, suggest that three general-purpose algorithms may be applied in a learning cycle beginning with learning activities, formative evaluation of those activities with ODALA (Ontology-Driven Auto-Evaluation for Learning Approach), knowledge extraction (using data mining), and improved learner management and monitoring (Bouarab-Dahmani & Tahi, 2015, p. 37), with the monitoring involving “evaluating his (and her) knowledge and skills in one hand and detecting and analyzing his (and her) errors and obstacles in the other hand” (Bouarab-Dahmani & Tahi, 2015, p. 33). The three algorithms are the following: C4.5 algorithm (with the J48 implementation) for classification, an Apriori one for association rules deduction, and k-means for clustering. The authors suggest that data mining could benefit computer environments for human learning (CEHL).
Instead of actually showing how this would be done by testing their ideas on real data and showing what may be understood, the authors propose the idea but do not actually offer a walk-through of the programming and the data structuring and the analytical process. This work is quite preliminary, and the proof-of-concept has not actually been achieved yet. Bouarab-Dahmani and Tahi stake out a concept which has already been in practice by others, and in terms of novelty, this work is only unique then in the name-dropping of what tools to apply to what but without the hard work of actual application.
Mining “Failed State” Data to Promote Global Security
In “Modeling Nation’s Failure via Data Mining Techniques” (Ch. 3), Mohamed M. Mostafa, a professor at the Gulf University for Science and Technology in Kuwait, asks two major questions: What are the major factors that affect state failure at the global level (vs. for a particular nation-state)? How do the various computational intelligence models fare against traditional statistical analysis techniques in identifying and modeling variables that contribute to state failure (and which factors ultimately put a nation-state in the danger zone of utter collapse)? (Mostafa, 2015, p. 55)
Any mix of social, economic, and political factors may combine to create a “failed state,” a nation which cannot provide its citizens with political “goods”: basic security, economic stability, judicial systems, basic infrastructure, bureaucracy, tax collection, and other features of modern states. The “failed states” label may be applied to states ranging from weak ones that can provide some political goods to collapsed states “that cannot guarantee even a modicum of order” (Mostafa, 2015, p. 54). At any one time, of the 196 countries in the world, there are a number of states identified as fragile, which explains the ripped-from-the-headlines feel. In the modern security literature, failed states have been linked to transnational terrorism and global insecurity.
The author describes various variable sets and how they pattern (in combination) in the real world to indicate risks of state failure:
“The variable sets considered are demographic pressures, movement of refugees, group paranoia, human flight, regional economic development, economic decline, de-legitimization of the state, public services’ performance, human rights status, security apparatus, elites’ behavior and the role played by other states or external political actors” (Mostafa, 2015, p. 53).
In other words, these variable sets may be used to extract empirically observed predictor variables that contribute to the outcome variable of state failure. Such analyses extract percentages that describe how much variance in the outcome variable is explained by a particular predictor variable. The understanding is generally that these are observed associations or correlations, not causations.
Using the same datasets, Mostafa studied multiple methods to identify which ones would be most effective in analyzing this question, including multi-layer perceptron neural network (MLP), radial basis function neural network (RBFNN), self-organizing maps neural network (SOM), and support vector machines (machine learning)…as compared to standard linear discriminant analysis (LDA). To actualize these models, he used IBM’s SPSS suite. He used built-in validation testing features of the respective models, such as extracting the models and then testing them against test data (vs. what the model was trained on…or the training data).
“Despite the satisfactory classification performance of the MLP, RBFNN and SVM in this study, such models are often criticized as black boxes that do not allow decision-makers to make inferences on how the input variables affect the models’ results. One way to address this issue is to conduct a variable impact analysis (VIA)…to measure the sensitivity of net predictions to changes in independent variables…” (Mostafa, 2015, p. 70)
He also used a variety of data visualizations to explain the results of the respective models, including temperature maps. So what were some of his findings? In his research, based on several models, he found that “refugees, security apparatus and external intervention” were the most important input variables (p. 70), but it is intuitive clear that the cause-and-effects may be inferred but are not clearly spelled out (state failure may come before a refugee crisis, for example; so the refugee crisis may be a lagging indicator of state failure). However, the author also observed the “billiard effect” of refugee movements which may lead to nation-state crises in the receiving states (Mostafa, 2015, p. 78). Finally, Mostafa suggests that integrating fuzzy discriminant analysis and genetic algorithms with computational intelligence models may improve the ultimate performance.
Extracting Association Rules with a Simplified Novel Evolutionary Self-Adaptive Algorithm
Genetic algorithms (a subset of evolutionary algorithms) are built around the "metaheuristic" of natural selection (inheritance, mutation, selection, and crossover). These algorithms are often used to identify candidate solutions to a particular problem by iterating various potential solutions (with different features) over a number of generations to arrive at the fittest mix of collective features for a particular challenge. Fitness is based on the value of the objective function of the optimization problem being solved. Each candidate solution (“individual”) has a set of properties that may be mutated and altered. This process may start with a population of randomly generated “individuals”. The final individual is identified as the fittest with the features combined and recombined from prior generations, at which point a “termination” condition has been reached.
Jośe María Luna, Alberto Cano, and Sebastián Ventura’s “An Evolutionary Self-Adaptive Algorithm for Mining Association Rules” (Ch. 4) introduces a context-free grammar-guided, genetically-programmed, and self-adaptive algorithm for the identification of association rules. This research team hail from Department of Computer Science and Numerical Analysis at the University of Cordoba and the Department of Computer Science at King Abdulaziz University in Saudi Arabia. The authors explain association rule mining as a functionality which involves the search for “strong relationships” among items in datasets. They write:
“An association rule (AR) is defined as an implication of the form Antecedent -> Consequent, both Antecedent and Consequent being sets with no items in common. The meaning of an AR (association rule) is that if the antecedent is satisfied, then it is highly probable that the consequent will be also satisfied” (Luna, Cano, & Ventura, 2015, p. 90).
As such, most association rule mining algorithms find all rules that satisfy the user-specified parameters (thresholds, in this case), generally defined as minimum support ("minsup") and minimum confidence ("minconf"). By contrast, the proposed G3PARM+ (Grammar Guided Genetic Programming Association Rule Mining+) algorithm does not require the setting of a priori parameters or thresholds; it proposes a “novel parent selector based on a niche-crowding model” to group rules to keep the best individuals in a pool and “restricts the extraction of similar rules by analyzing the instances covered” (Luna, Cano, & Ventura, 2015, pp. 89 - 90). This simplified approach may help non-expert users better discover association rules.
This authoring team makes savvy use of text-complementing visualizations to explain their work. As an example, in Figure 2, the authors showcase a sample derivation syntax-tree conformant to the grammar; specifically, this visualization shows that if a toy’s price is at certain level and the toy is a ball, then a male has a fairly high likelihood to purchase the toy (Luna, Cano, & Ventura, 2015, p. 101). In Figure 5, the authors provide an informative flowchart depicting the processes of the proposed new algorithm (Luna, Cano, & Ventura, 2015, p. 109).
To test the efficacy of this approach, the research team compared the results of their algorithm with G3PARM, without the innovations, and found G3PARM+ running more efficiently and with comparable results in terms of extracted association rules.
Conclusion
For the majority who have not been working in the space of data mining, Data Mining: Principles, Applications and Emerging Challenges helps readers get into the head space of extracting patterned insights from data, whether the data are structured or unstructured. Many of these methods have been around for decades, but the transfer to specialists outside of data science and computer science has been slowed—in part due to the high learning curve.
Data Mining… shows the importance of contextual and in-domain knowledge. While the book is a bit of a sampler, given the breadth of the field, these four chapters demonstrate how experts apply new technologies and methods to real-world research challenges and interpret and apply results from the respective data mining methods.
About the Author
Shalin Hai-Jew serves on the Steering Committee for Colleague 2 Colleague and works as a co-editor of C2C Digital Magazine.
She reviews for a number of publishers, including Springer, Elsevier, IGI-Global, and others. She has been publishing so long that she has books in the 1-cent bin on a few online sites.
She may be reached at shalin@k-state.edu.
Note: Thanks to Nova Science Publishers for a complimentary and watermarked electronic copy of the text for review.
| Previous page on path | Issue Navigation, page 20 of 26 | Next page on path |
Discussion of "Book Review: Four Canonical Data Mining Cases"
Add your voice to this discussion.
Checking your signed in status ...