Data source: Painting sites
Raw data: RDF | JSON
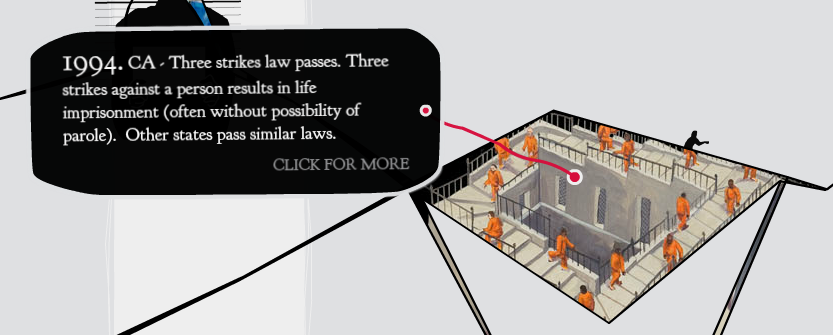
Content is attached to the curves of The Knotted Line via painting sites (also sometimes referred to as portals). Visually, these painting sites can be seen as red dots which appear as each section of the timeline is opened.
Key properties for painting sites include:
Content is attached to the curves of The Knotted Line via painting sites (also sometimes referred to as portals). Visually, these painting sites can be seen as red dots which appear as each section of the timeline is opened.
Key properties for painting sites include:
- A dcterms:spatial property containing its comma-delimited x and y coordinates (with 0,0 being the top-right corner of the timeline; positive x = right and positive y = down)
- A dcterms:references property containing a comma-delimited list of node ids, identifying the nodes which must be “unlocked” through the user’s interaction with the animated curve before the painting site will appear.
- All painting sites are tagged with a painting site tag—if you visit the page for that tag, you can see an interactive visualization of the connections.
- Each painting site is tagged with a gloss which determines the content of the black shape that appears when the user moves their cursor close to the painting site in the timeline.
- Some painting sites are tagged with questions that appear as the user interacts with the site.
| Previous page on path | Data sources, page 2 of 6 | Next page on path |
Discussion of "Data source: Painting sites"
Add your voice to this discussion.
Checking your signed in status ...