Scalar's 'additional metadata' features have been disabled on this install. Learn more.
Using Scalar in the Classroom
Main Menu
Learning to Use Scalar
Instructions for learning how to create a Scalar book
Austin Landmark: The Perry-Castañeda Library
The largest library on UT's campus
Scalar Examples
About this Scalar Book
Rights and Acknowlegments
Joshua Kopin
4542763d1e0443d8a0c29cf7f7be890079111678
Allyssa Guzman
5710deded7d7aa5d2cdf443be0925292f7b705d1
WidgetHighlight
1 2018-11-14T15:49:42-08:00 Allyssa Guzman 5710deded7d7aa5d2cdf443be0925292f7b705d1 31820 1 Where to click to select items to add to widgets plain 2018-11-14T15:49:43-08:00 Allyssa Guzman 5710deded7d7aa5d2cdf443be0925292f7b705d1This page is referenced by:
-
1
2018-11-14T02:05:52-08:00
Using Widgets
4
Adding a map to your Scalar page
plain
2018-11-14T15:56:03-08:00
Scalar has a feature called Widgets that allows you to add interactive elements to your pages. Today we're going to go over how to use the map option. There are other widgets to create visualizations, timelines, and media galleries. For more information on all the Scalar widgets, see the Scalar User’s guide.
The Maps widget embeds a simple Google map on one of your Scalar pages.
Today we’re going to create a very simple map with one point: the landmark that you’ve chosen to feature. Before we can create the map, we need to add the coordinates of the landmark to the image that you imported in the last step. This will tell Scalar where on the map to place the point.
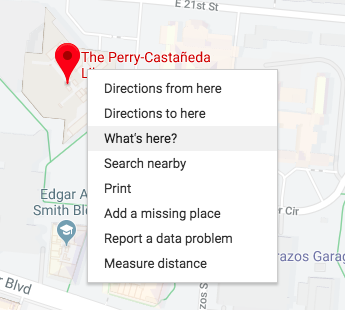
Mapping could be many workshops in and of itself, so today we’re taking a very simple approach. To find the coordinates of your landmark, navigate to it in Google Maps.
Once you have your landmark pulled up, right click on it and select “What’s here?.”
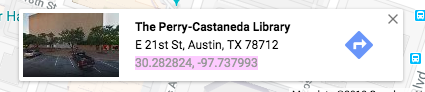
A box will show up at the bottom of the screen with the latitude and longitude of the point you clicked. Copy those coordinates and then navigate back to your Scalar book.
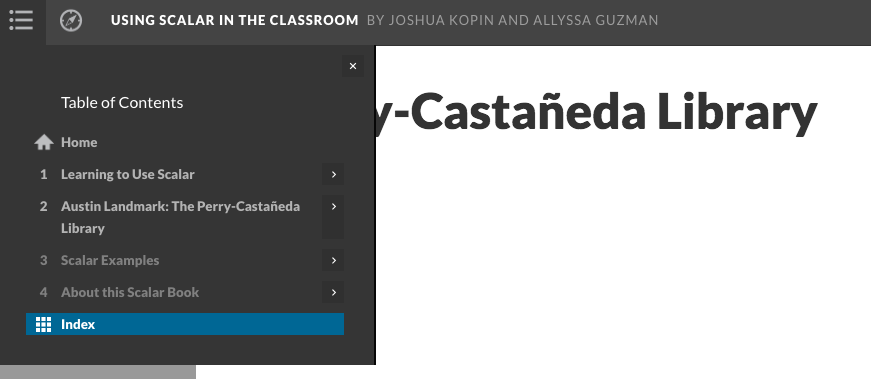
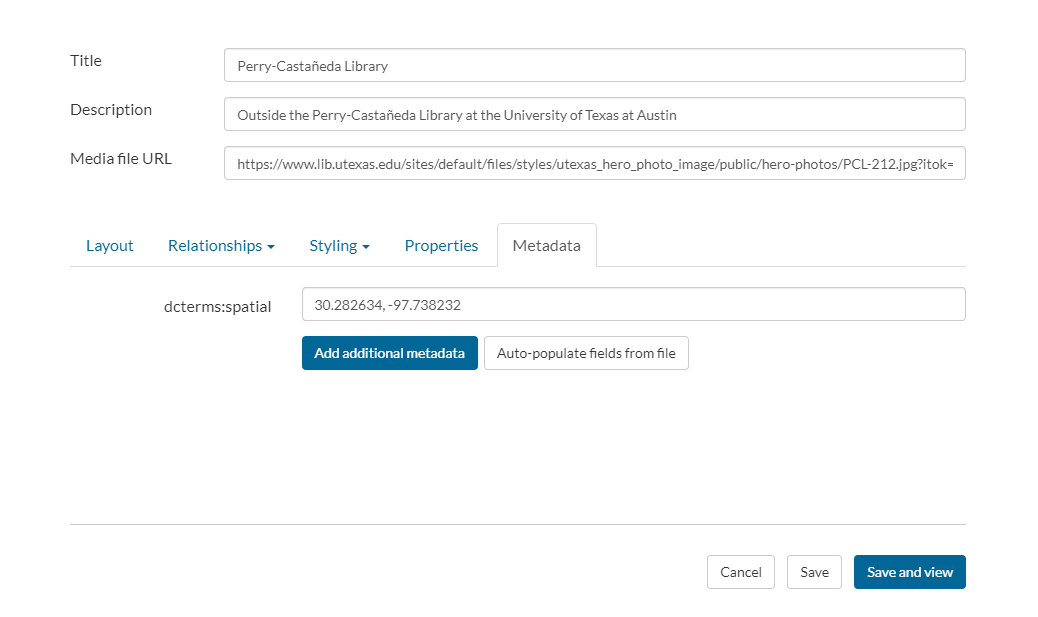
Using the Index, navigate to the media file that you imported in the last step and then click the pencil icon to edit.
Click on the Metadata tab and then paste the coordinates you copied into the field called “dcterms:spatial.” Click Save & View.
Note: We’re not really getting into metadata in this workshop, because it’s a complex topic. If you’re working on a large Scalar project of your own, we recommend reading more about it on the UT Libraries website.
Okay, now that we’ve added the coordinates to our media file, it’s time to create our map widget. If you were creating a map with multiple points, you would want to make sure that you added all of the coordinates to their associated media files before creating your map.
Navigate to the page where you would like to place your map. Click the pencil icon to edit that page.
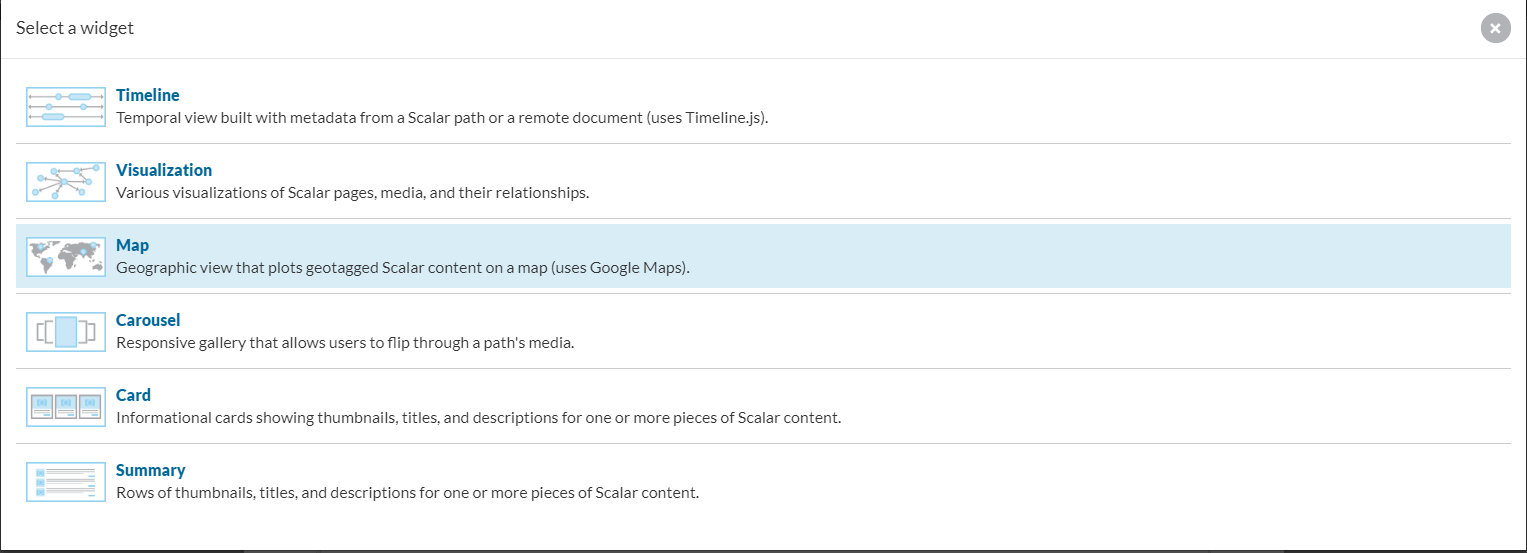
Now click on the button that looks like a puzzle piece in a box.
Select the Map option from the list of widgets.
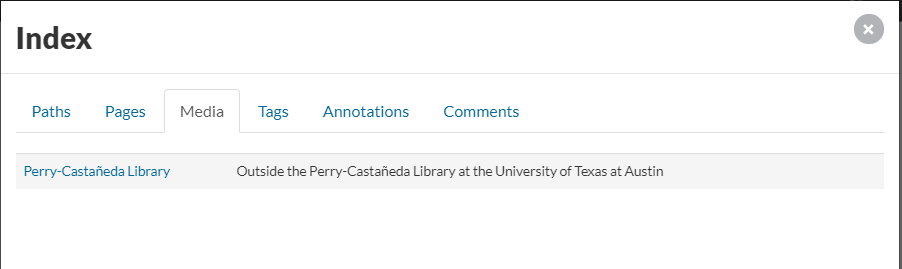
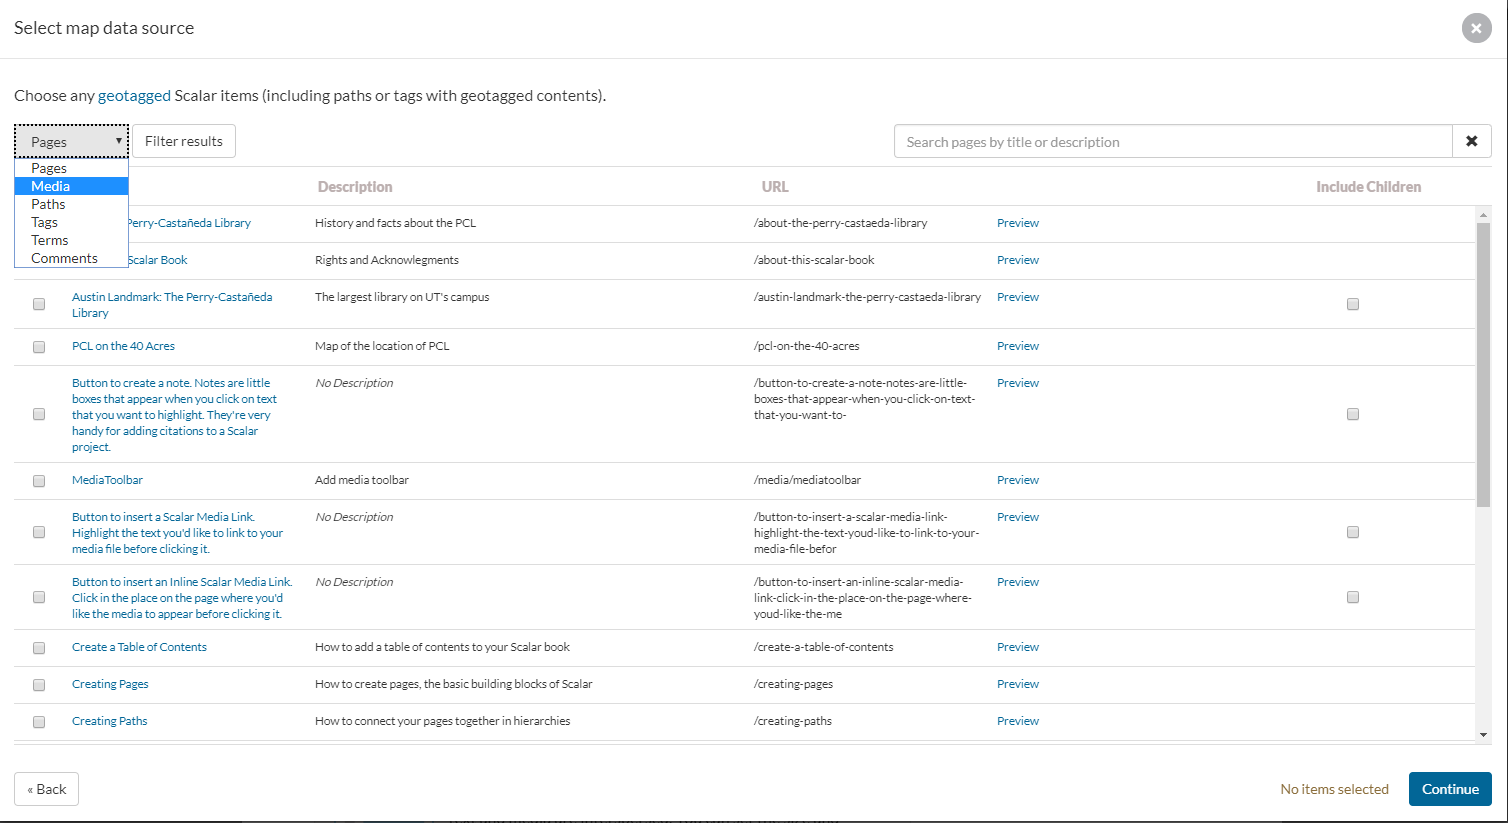
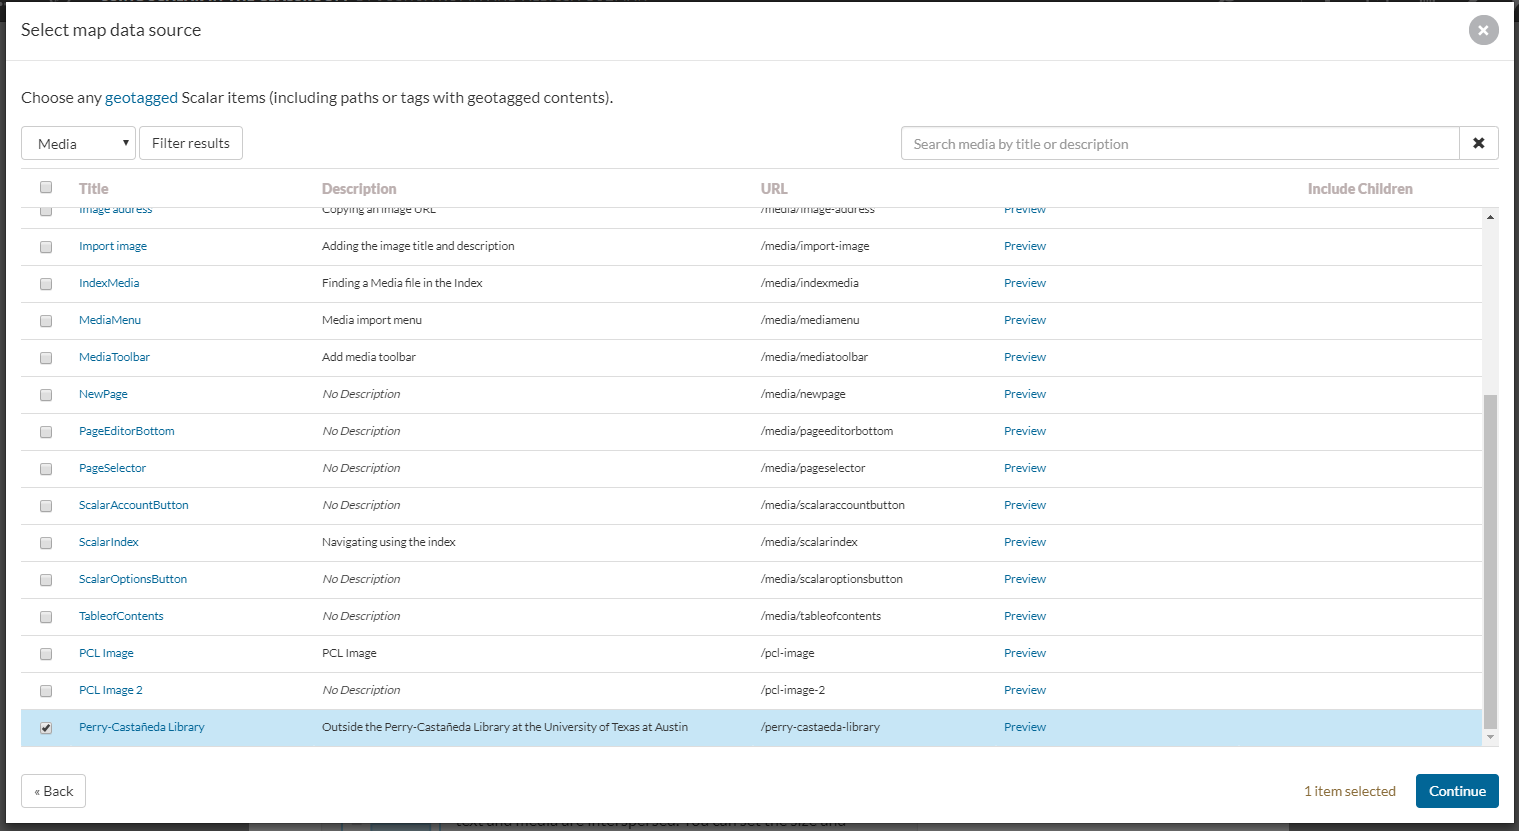
Now select the media file that you’d like to place on the map. You will need to filter the results by Media.
Important: It’s a little tricky to select the items from this list. Just clicking on the checkbox next to the item you want to select won’t work. You have to click in the gray box around the item you want to select. Once the box turns blue, you’ve selected the item and can click continue.
After that you’ll have a similar set of presentation options to the ones you used with the media files in the last step.
After this, save and view your page and you should have a map!