The NVivo User Interface
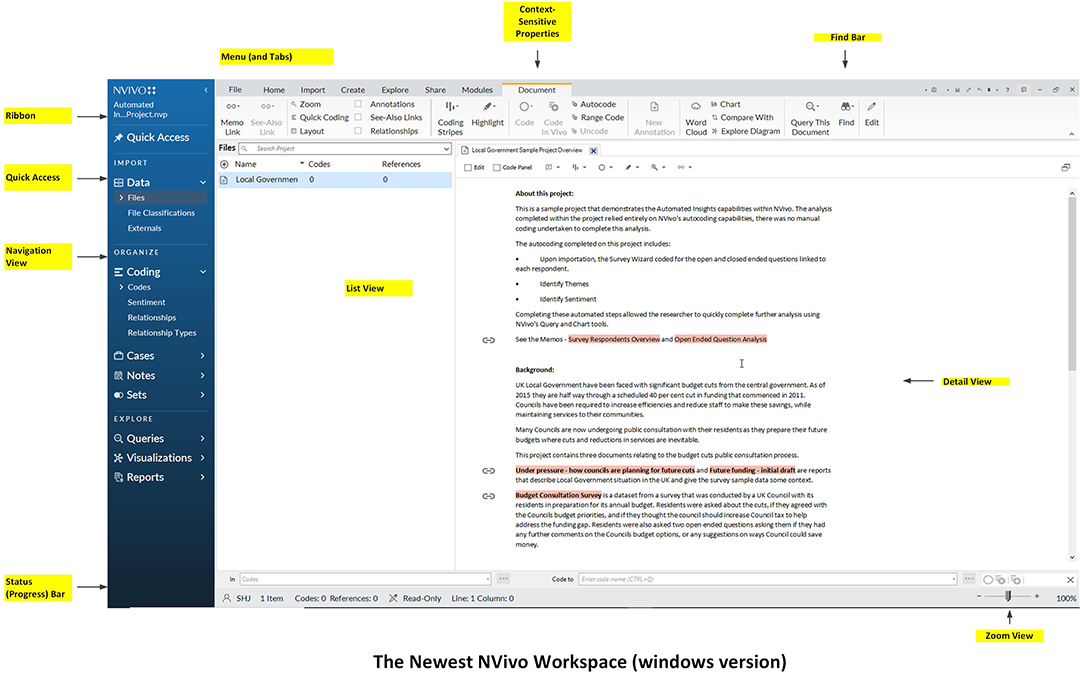
New NVivo Workspace
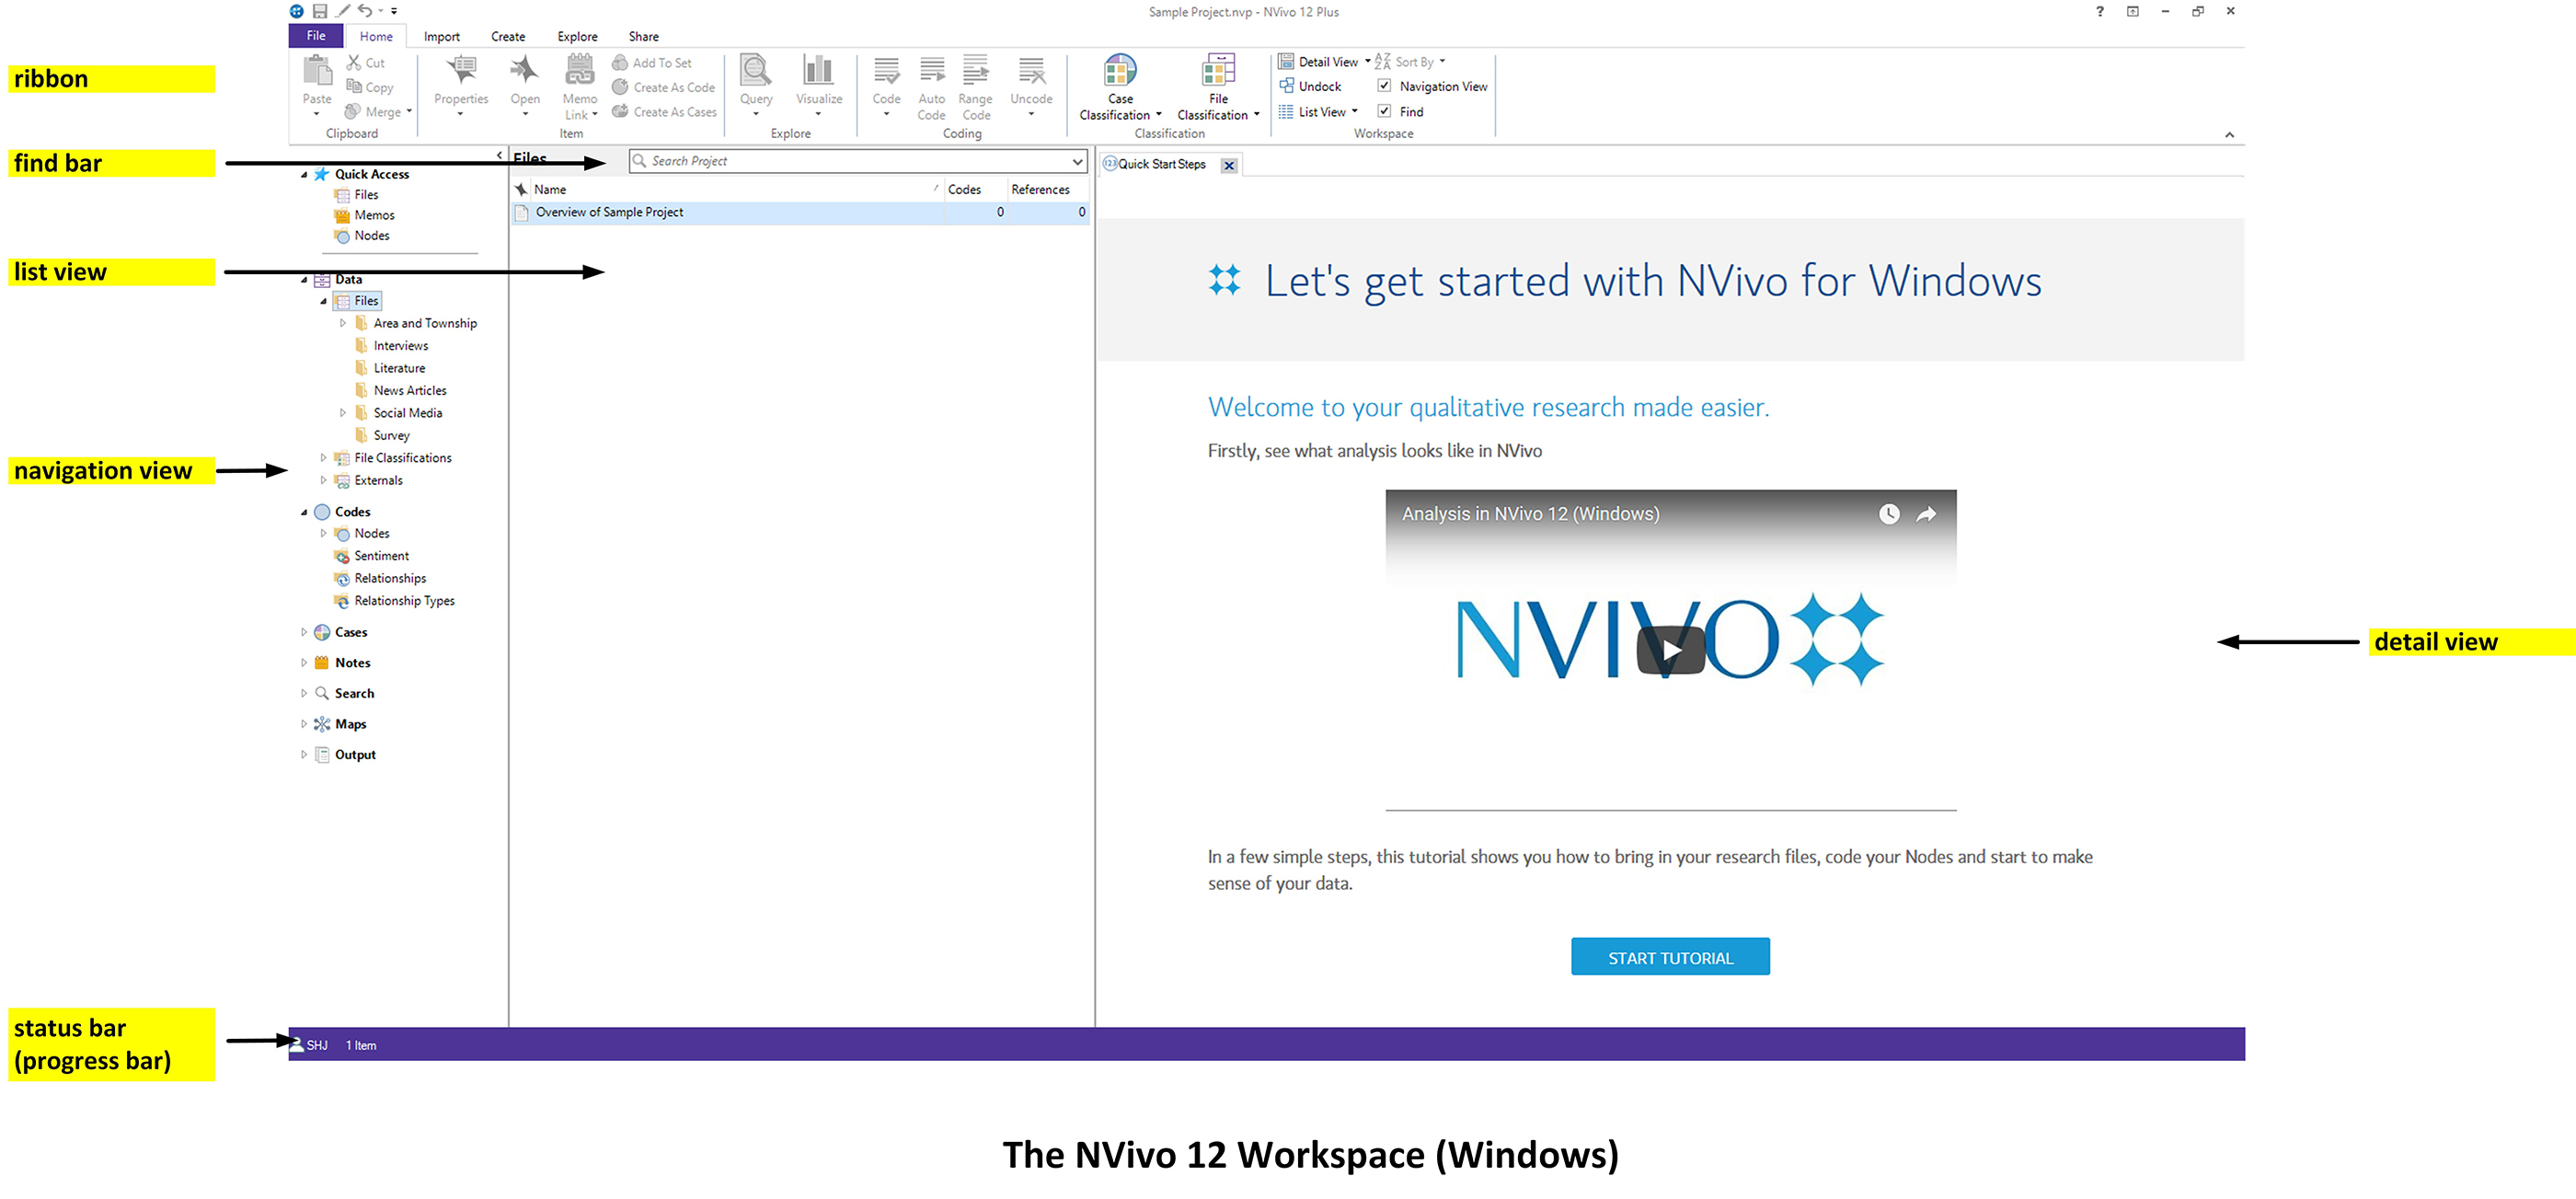
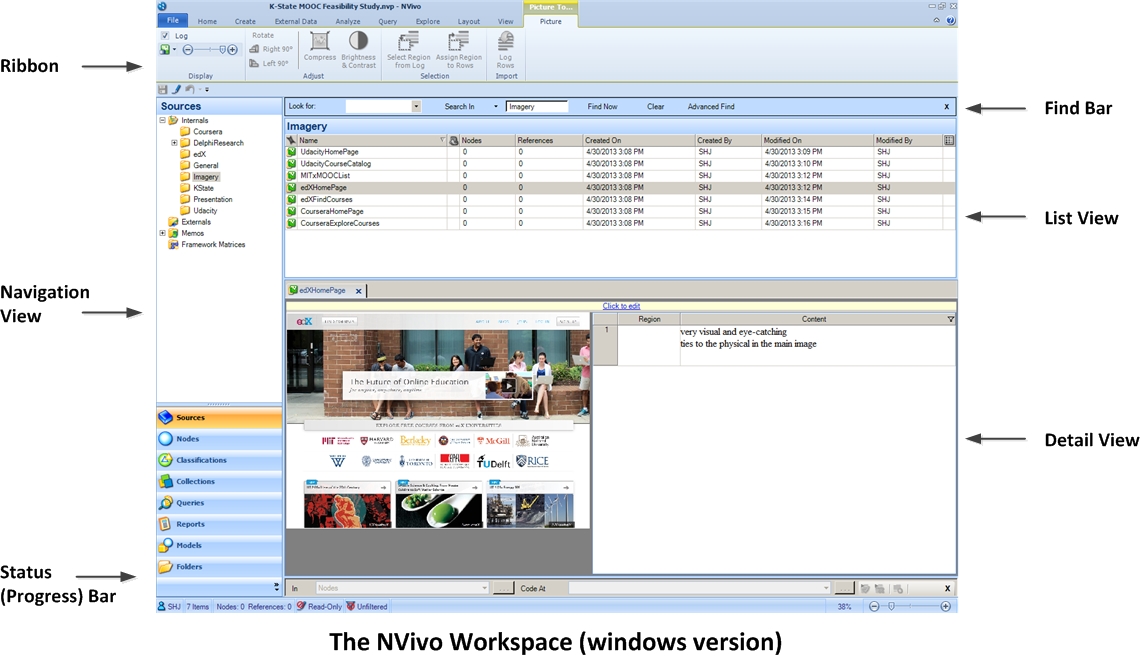
The NVivo Workspace
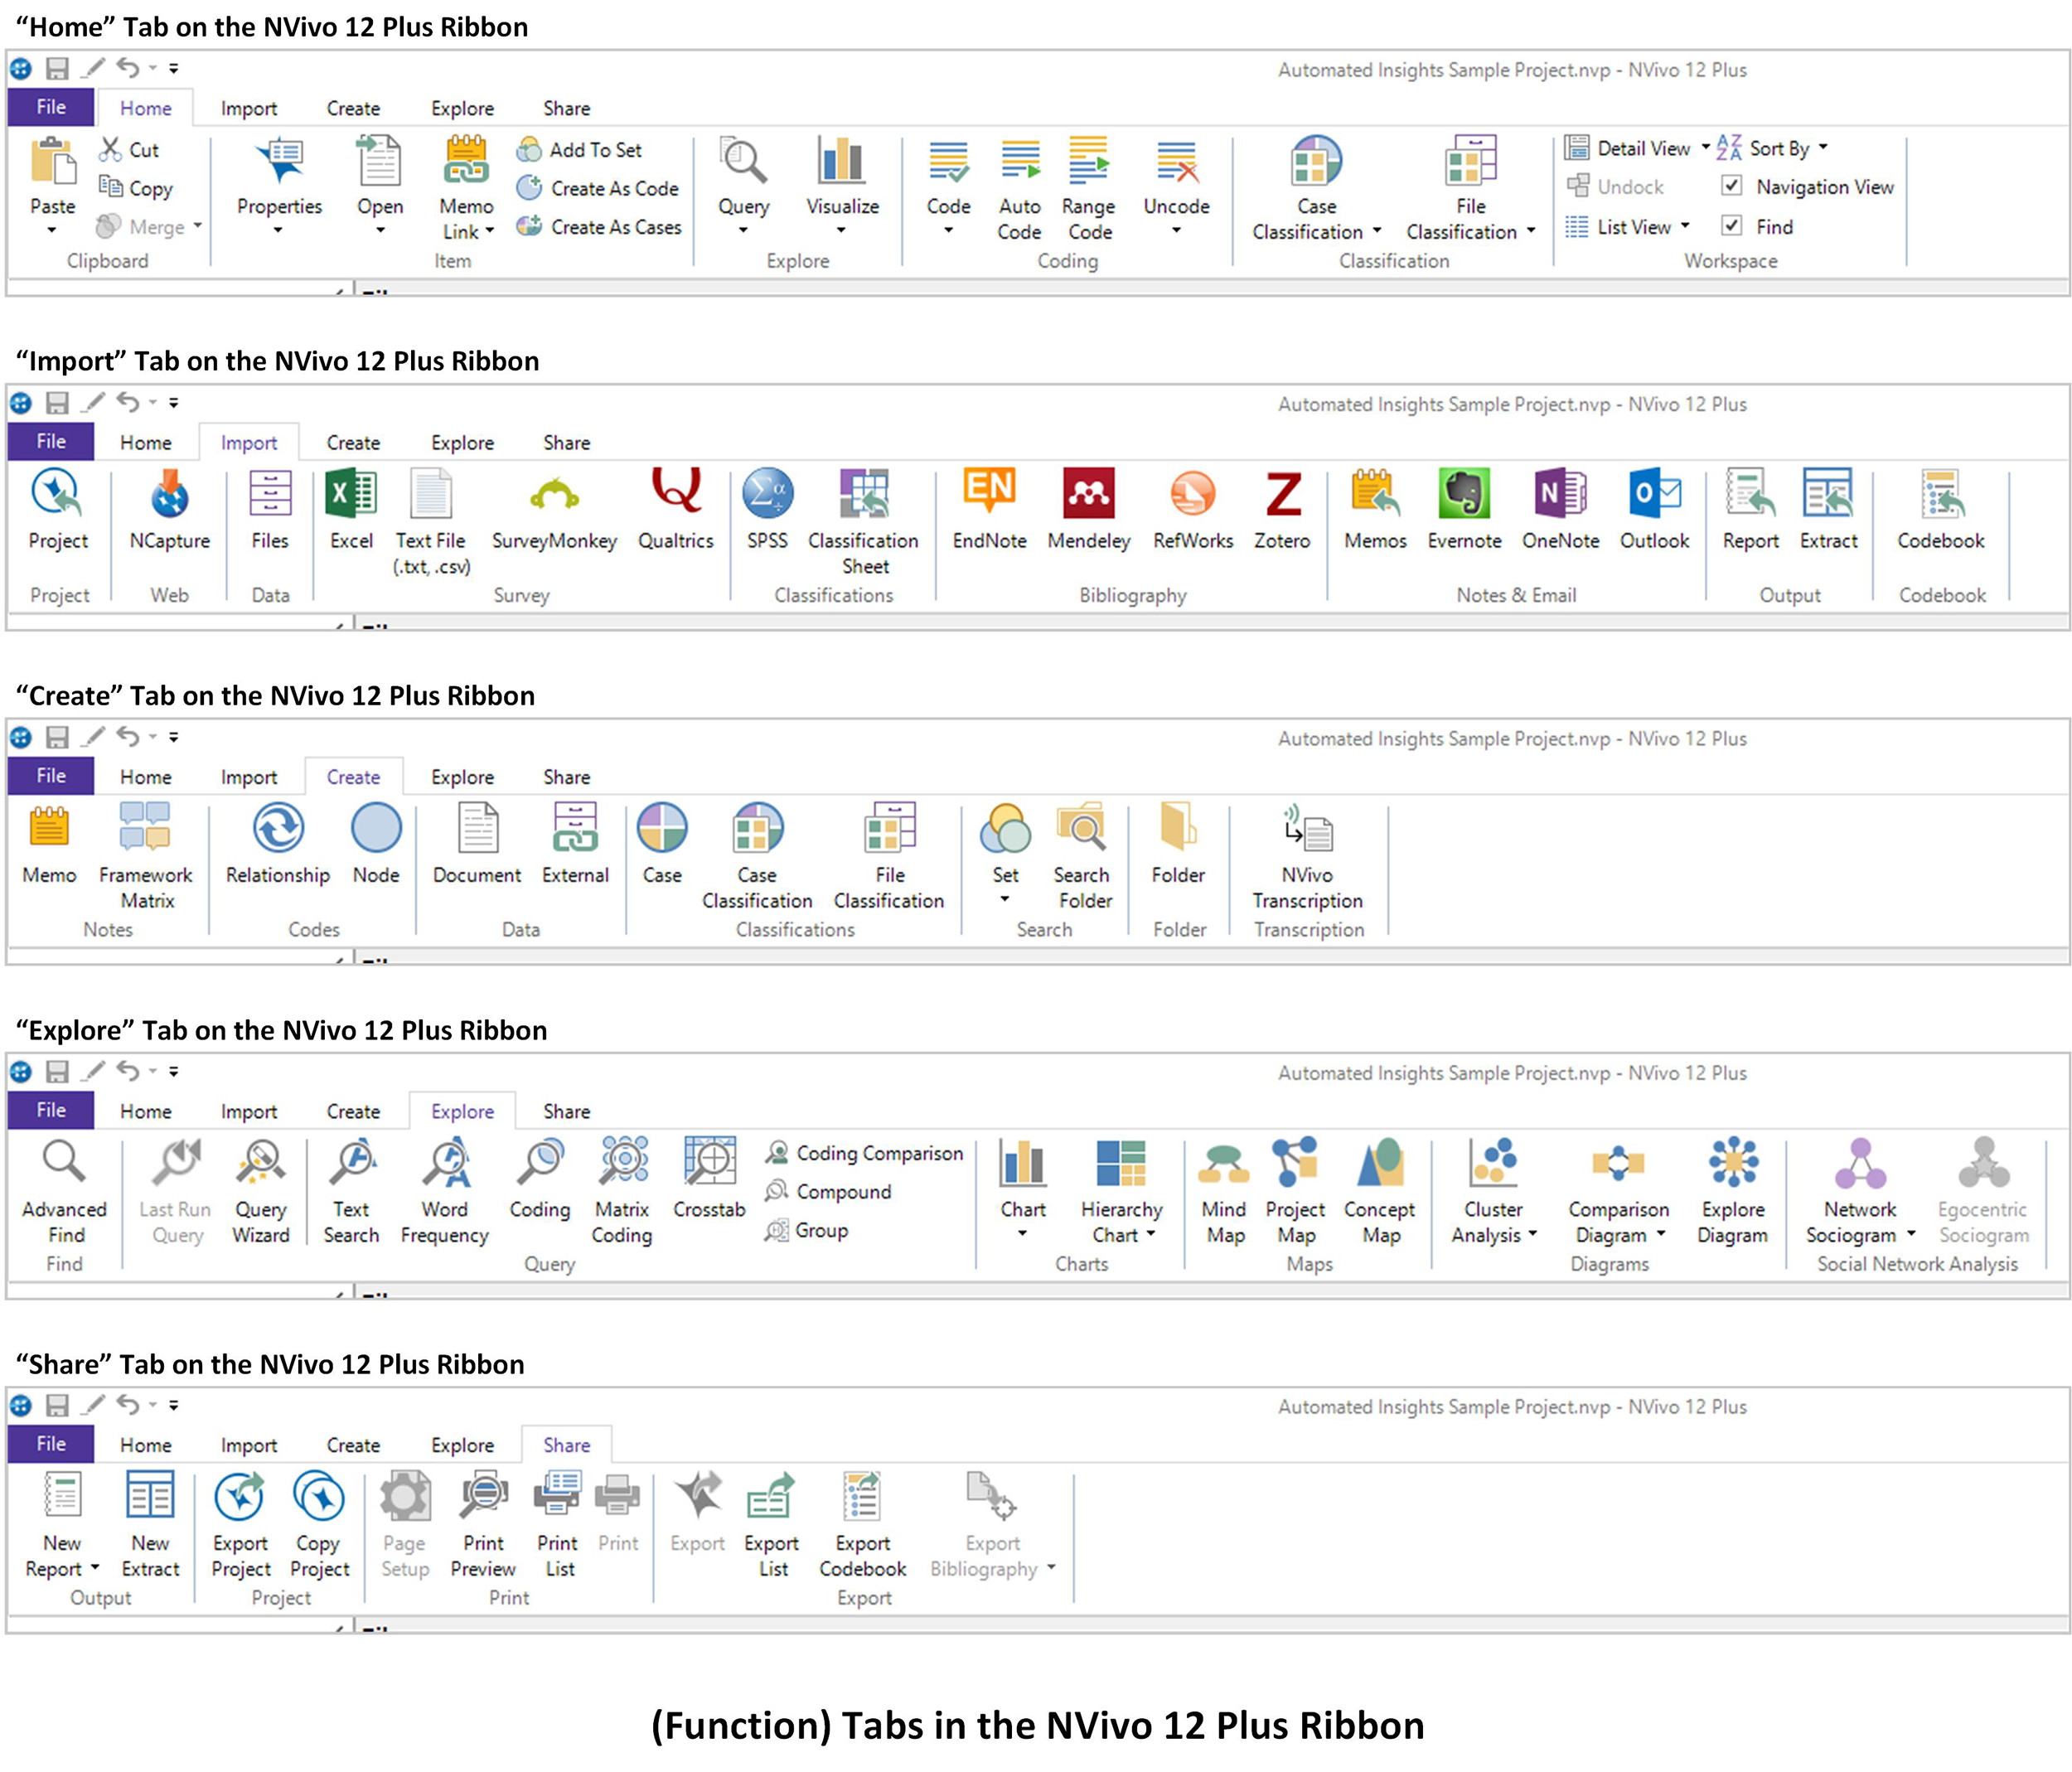
Function Tabs
- Item: This contains the Item area learning more about the highlighted content's properties, opening it, creating a memo to it, adding it to a particular set, creating that content as its own coded node, or creating the highlighted content as a case.
- Explore: This area enables the running of some common queries (word frequency count, text search) and accessing the nodes and case nodes created to the particular document.
- Coding: This area links to the machine learning module within NVivo, for sentiment analysis, topic modeling, and others.
- Classification: This area enables the application of classification sheets to the file.
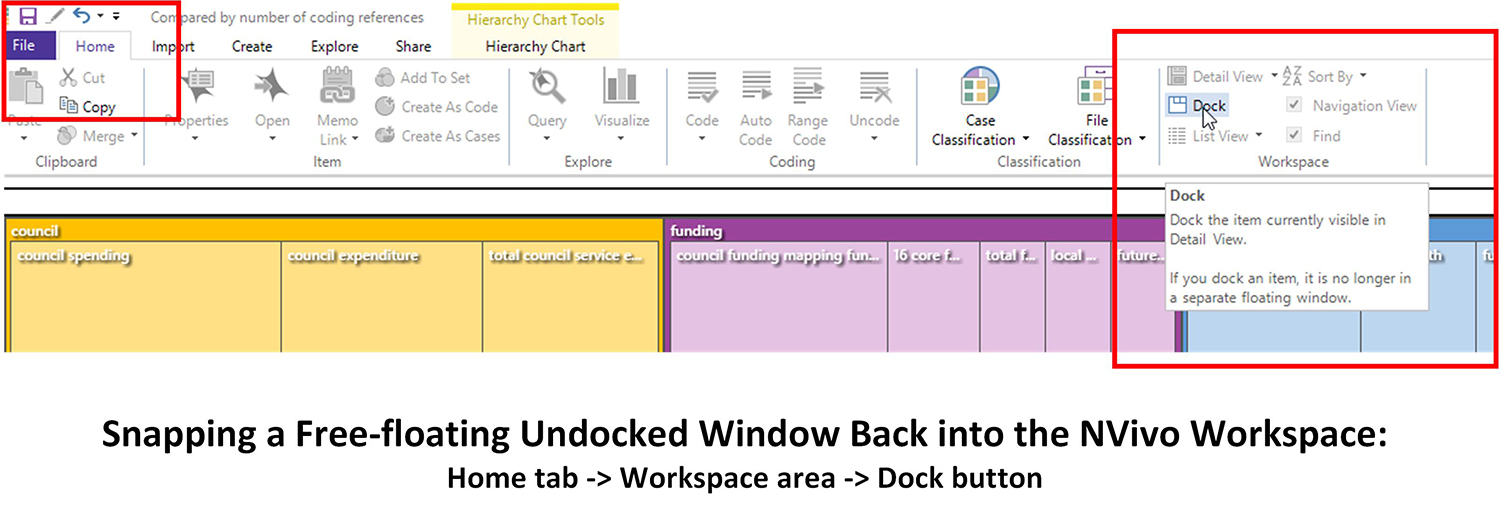
- Workspace: This area in the Home tab enables ways to modify the setup of the workspace.
- Project: This area in the Import Tab enables the ingesting of other projects. A Windows project requires that the project be a windows one. (A Mac or Server 11 project may be copied out in the windows format, and a Windows project may be exported as a Mac or Server 11 project, etc.) This is the capability used for team coding projects when the team is ready to make a master file including all the individually coded projects.
- Web: This area is shown with the NCapture icon. This is the place to ingest the .nvcx files from social media platforms. These files are either in the Downloads folder (for Google Chrome) or the Documents -> NCapture folder (for Internet Explorer), for Windows. Prior to importing this data, the data captures have to have been achieved using the web browsers...accessing the application programming interfaces (APIs) of the respective social media platforms. All social media platforms have data limits for extraction, and many are also rate-limited with only certain amounts of data that may be downloaded within a time period. All also require "white-listing" into the particular platform.
- Survey: The Survey area enables the upload of Excel files, which will be autocoded based on the parameters set in the related Wizard. Here, a text file (.txt, and others) may be inloaded. Also, there are integrations with the online survey platforms: Survey Monkey and Qualtrics. Both require particular identity verification to access. For Qualtrics, the unique token available on the user identity page has to be created on Qualtrics and used within NVivo.
- Classifications: This area enables the loading of .sav (SPSS data) files and classification sheets (.xlsx, .xls, .sav, .txt, and others).
- Bibliography: This area enables accessing online note-taking (EndNote), bibliographic and citation (Mendeley, Refworks, Zotero), and other resources. Those who conduct research on databases, for example, can access a number of research sources and ingest the sources and their formal metadata into NVivo through Mendeley. (This is likely available in other online tools, too, but this author only has more in-depth usage of Mendeley in recent years.)
- Notes & Email: This area enables the ingesting of memos from a different project or from other researchers. The notes may also come from Evernote and OneNote. Emails can be extracted from Outlook for analysis (with the proper user credentials). [Emails may be studied for textual content, for social networks, and others.]
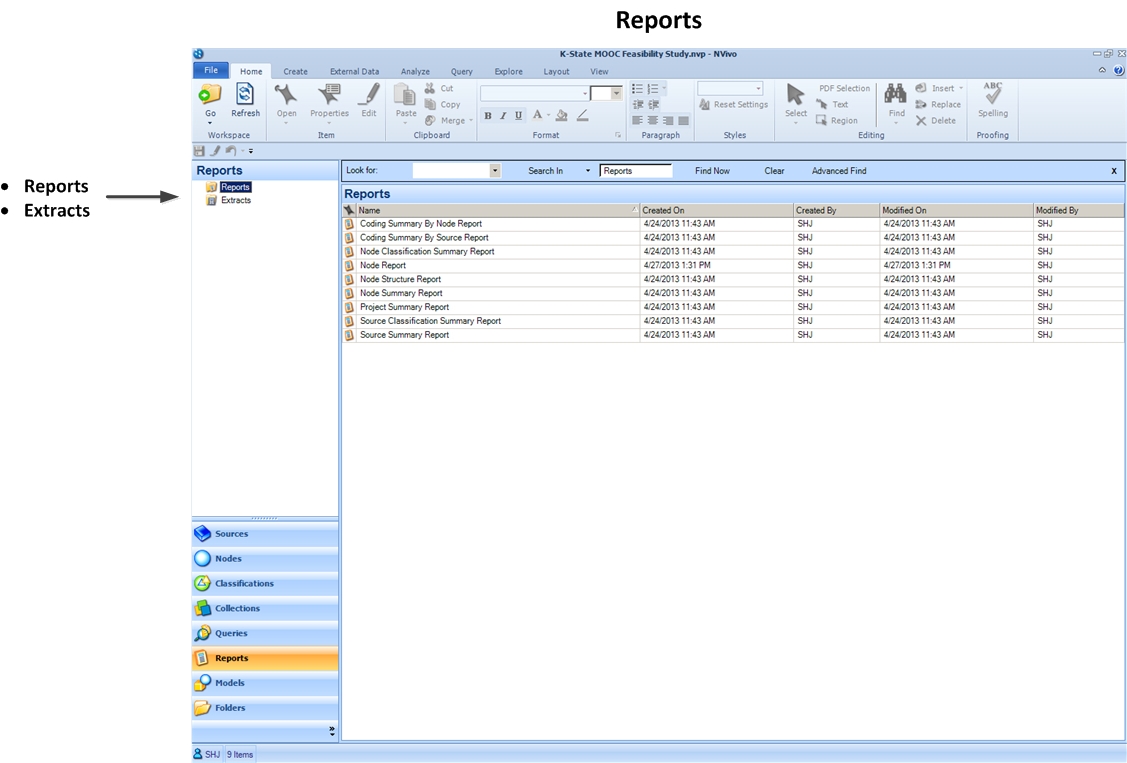
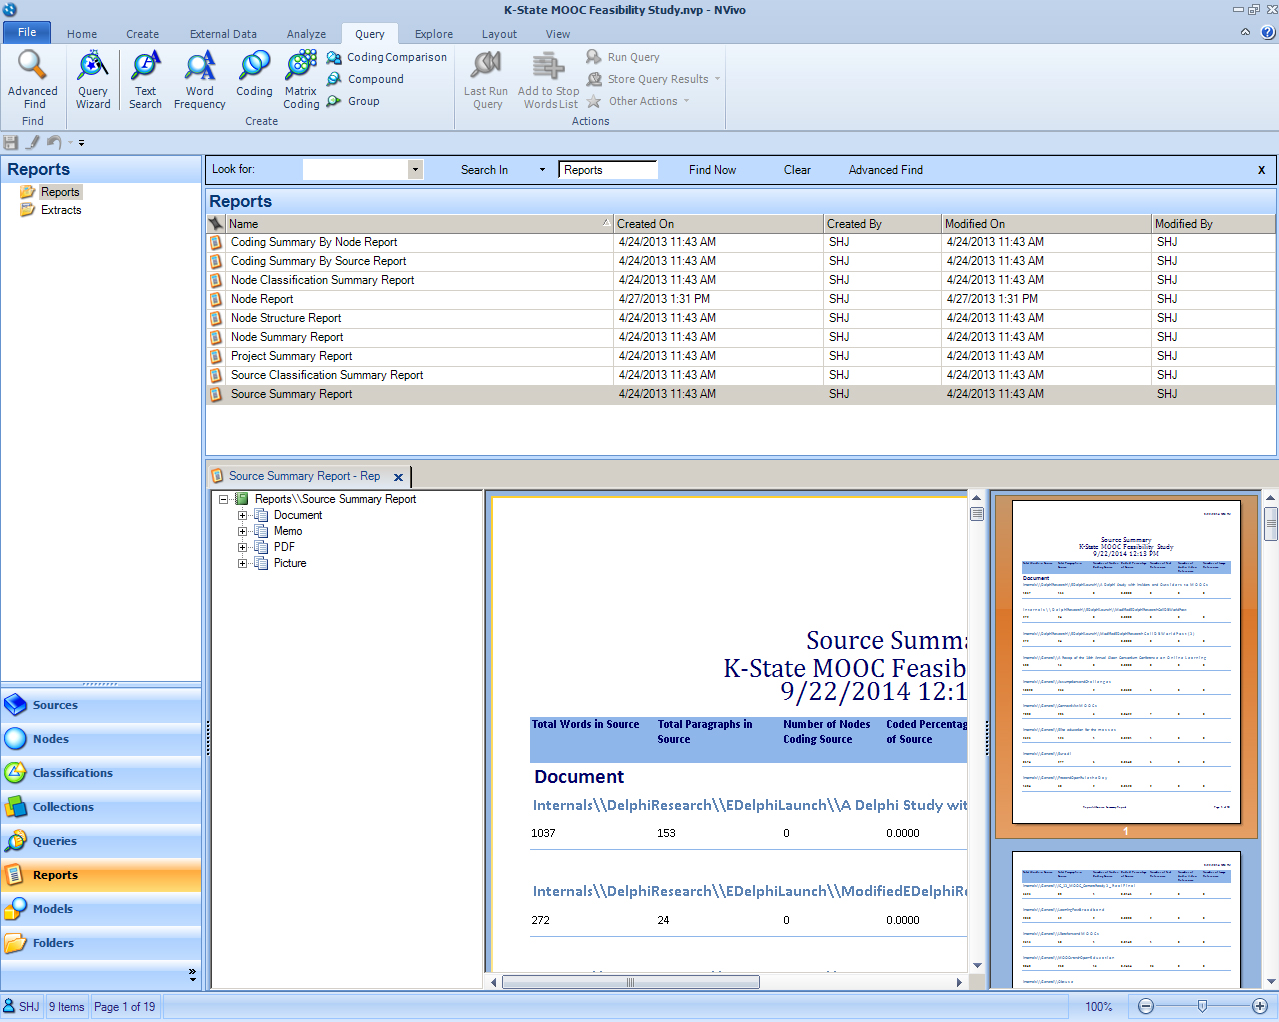
- Output: Reports that had been created in NVivo and output in the .nvr format (not .docx, not .pdf) may be ingested into this project. Likewise, extracts (.nvx) from NVivo may be imported here, too.
- Codebook: A new feature of NVivo 12 involves a smoother path to exporting a codebook. (Earlier versions required using the Reports feature to export the codebook.)
- Notes: This area enables the ingestion of memos and framework matrices from other NVivo projects. Memos are thoughts about the research and sources, generally speaking. Frameworks are generally conceptual structures related to particular topical areas of study and phenomena.
- Codes: This enables the connecting of various elements in the research to indicate directional and meaning-based relationships in "Relationship" and various coding nodes in "Node". (Coding nodes are sort of like categories or containers for particular types of meaningful information.)
- Data: The data section enables the creation of born-digital documents in Document or born-digital External "proxy" files for the data on which the analyses will be run.
- Classifications: This area enables the creation of case nodes (single "egos" and group "entities") for various types of analyses. Classifications of cases enable more in-depth identifications of data patterns through the respective features of the egos and entities.
- Search: The search feature enables the finding of particular resources through text searches of particular parts of the project, such as by set or by folder. (The found contents may be stored as informational resources in the project.)
- Folder: The folder area enables the creation of a new folder.
- Transcription: The transcription feature enables access to a paid service.
- Find: The Advanced Find enables targeted searching based on a sequence of conditionals (by name, by when something was created, by whom, in particular folders, and so on). [Remember that NVivo projects in Windows are built on SQL and are essentially qualitative databases of contents.]
- Query: The Query area enables rich ways to explore data, through text search, word frequency counts, matrix queries, crosstab analyses, coding comparisons (Cohen's Kappa is achieved here), compound queries, group-based queries, and others. The Query Wizard simplifies the query process. More complex queries should be "Add to Project..." as a macro, so it can be re-run without having to go through the respective steps. Researchers need to record the data and the query in their work, so they can have these documented for reportage and publication. The findings of the queries may be saved as data tables and data visualizations, and these may be exported out in common file types.
- Charts: The Charts enable the creation of various structured data visualizations from identified data.
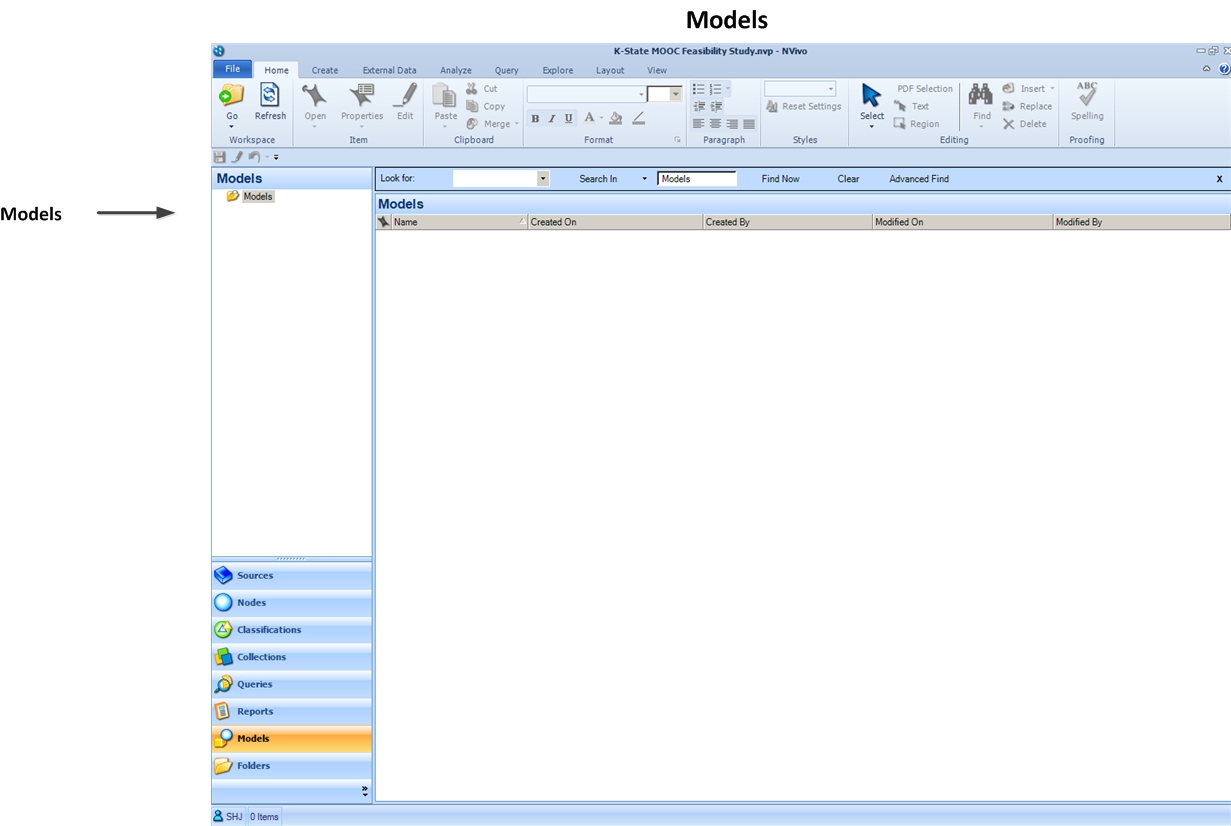
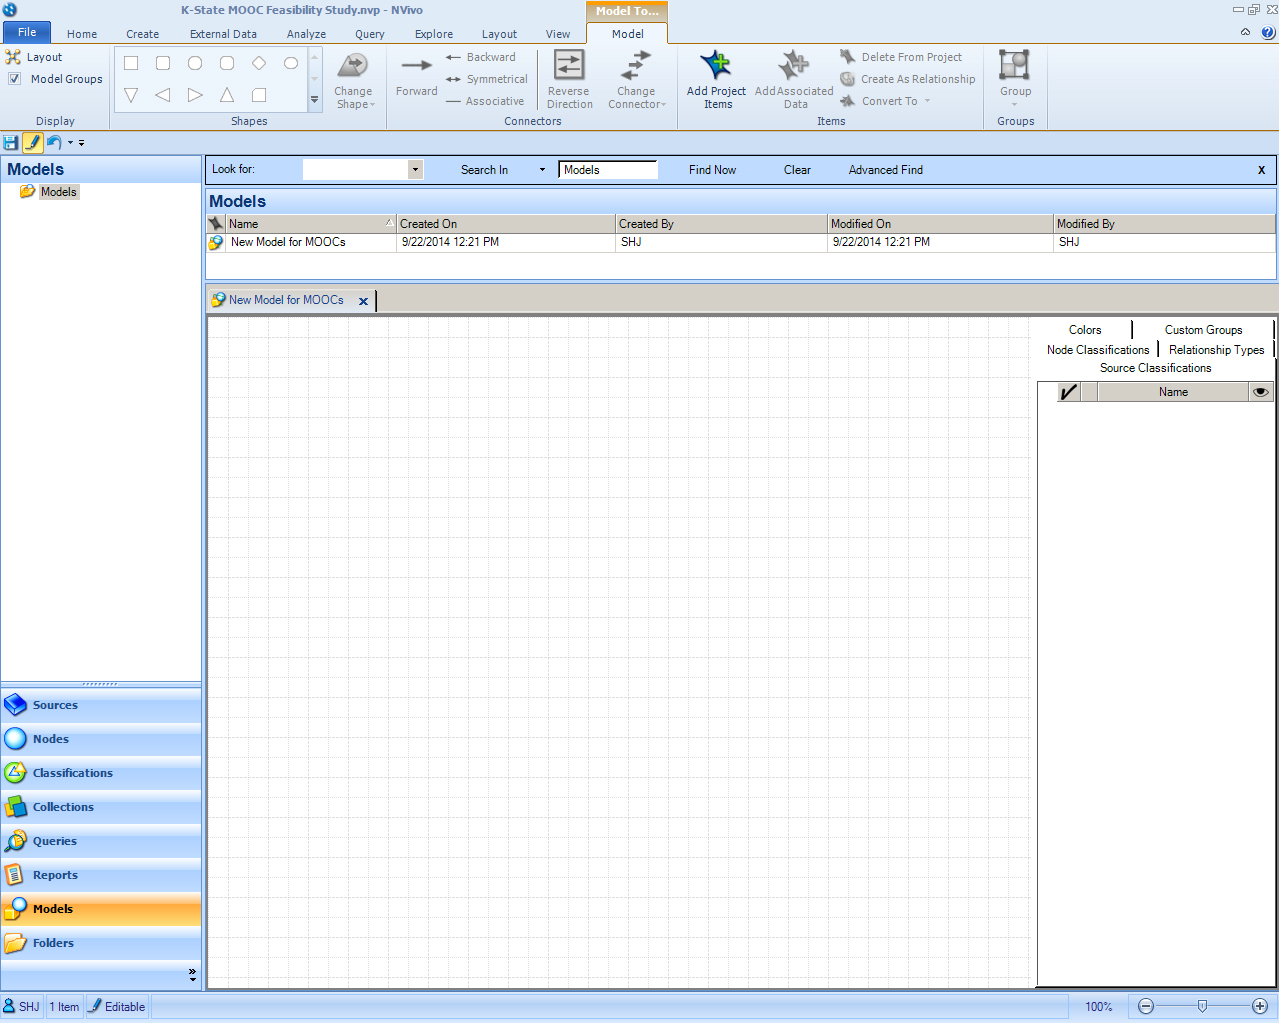
- Maps: Maps (2D diagrams) may be created with manually selected and / or auto-selected data...with the visuals that are editable. These maps are more like "concept maps." These may be used for modeling.
- Diagrams: The Diagrams area is used for various visualizations from clustered data, from comparative data, and others.
- Social Network Analysis: This area enables the display of data in networks...and of human groups as social network graphs. (These tools are used in an automated way with Twitter microblogging following data as well.)
- Output: The Output area enables the selective export of information in the form of a Report or a New Extract (a collection of contents based on "view," such as case classification, code, project item, file classification, or file). These are usable by others who have the same NVivo software.
- Project: The project may be exported as either of the following types: NVivo 12 (Windows) project, NVivo 12 (Mac) project, NVivo Server 11 project, or REFI-QDA project. Copying hte project may be result in any of the three main formats: NVivo 12 (Windows) project, NVivo 12 (Mac) project, or NVivo Server 11 project.
- Print: The "Print" area enables printing the view of the project to a Word file.
- Export: The Export feature enables the exportation of various elements like a list or a codebook or bibliography, depending on the available data in the project.
Some Notes about Earlier Versions of the Software
Flexibility and inflexibility. NVivo is a highly flexible tool. Any document, folder, or node may be named and re-named. Any object may be moved from one location to another. The hierarchical structures (such as of folders or nodes) may be reconfigured. Any items may be deleted (and these are one with an irrecoverable hard delete, so researchers should be certain that they want to delete the particular object).
There are two main aspects of the tool that are “inflexible.” One is the person’s name and initials that are input at the installation. Once that is input, those are the initials that will show up in the eventlogs and other metadata linked to source file uploads and node annotations. The other is ingested data. Once interviews, surveys, or articles or other multimedia are ingested into the project, the researchers cannot edit out the names (so as to anonymize the data) or make changes to the original underlying files. The underlying data that is ingested is essentially immutable (not able to be changed or revised). While researchers may annotate over the files and may code on top of the underlying data, they may not change the underlying "autolocked" information. (What this means is that data anonymization has to be achieved during the data processing before that data is ingested into NVivo. Along the same lines, if the respective software programs capture hidden data, that should also be scrubbed before ingestion into NVivo since files may be downloaded from NVivo with hidden metadata intact. For this issue, think "Properties" in MS Word or other information that may be seen in a Word file when opened in other word-processing software programs.)
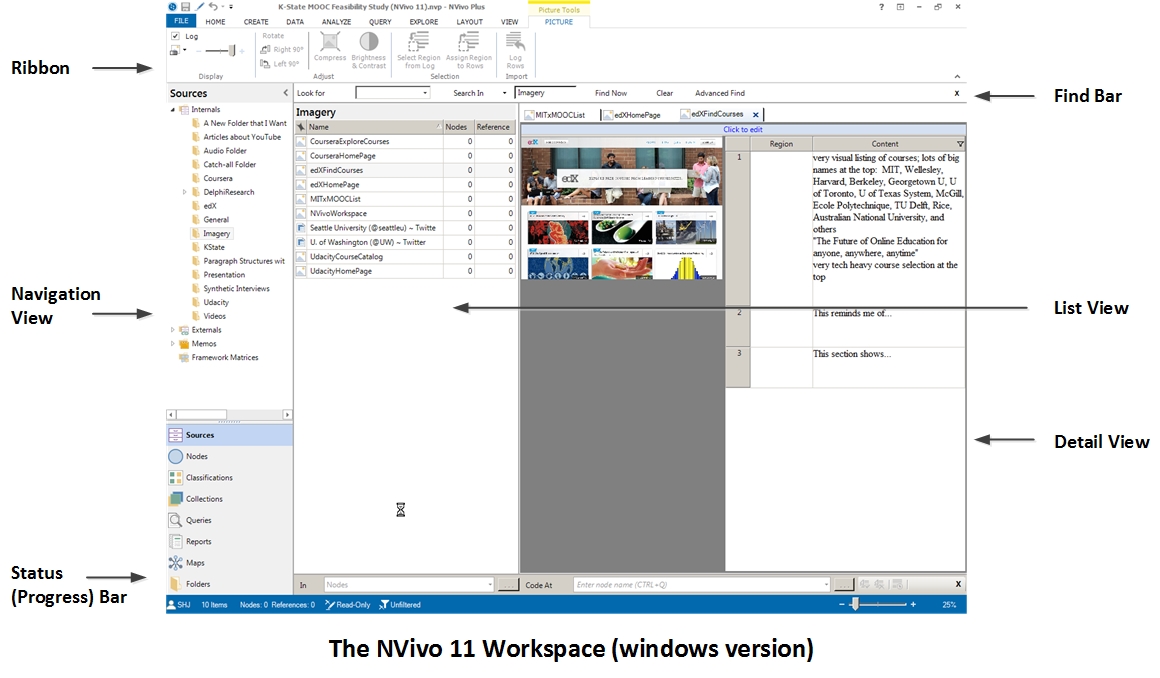
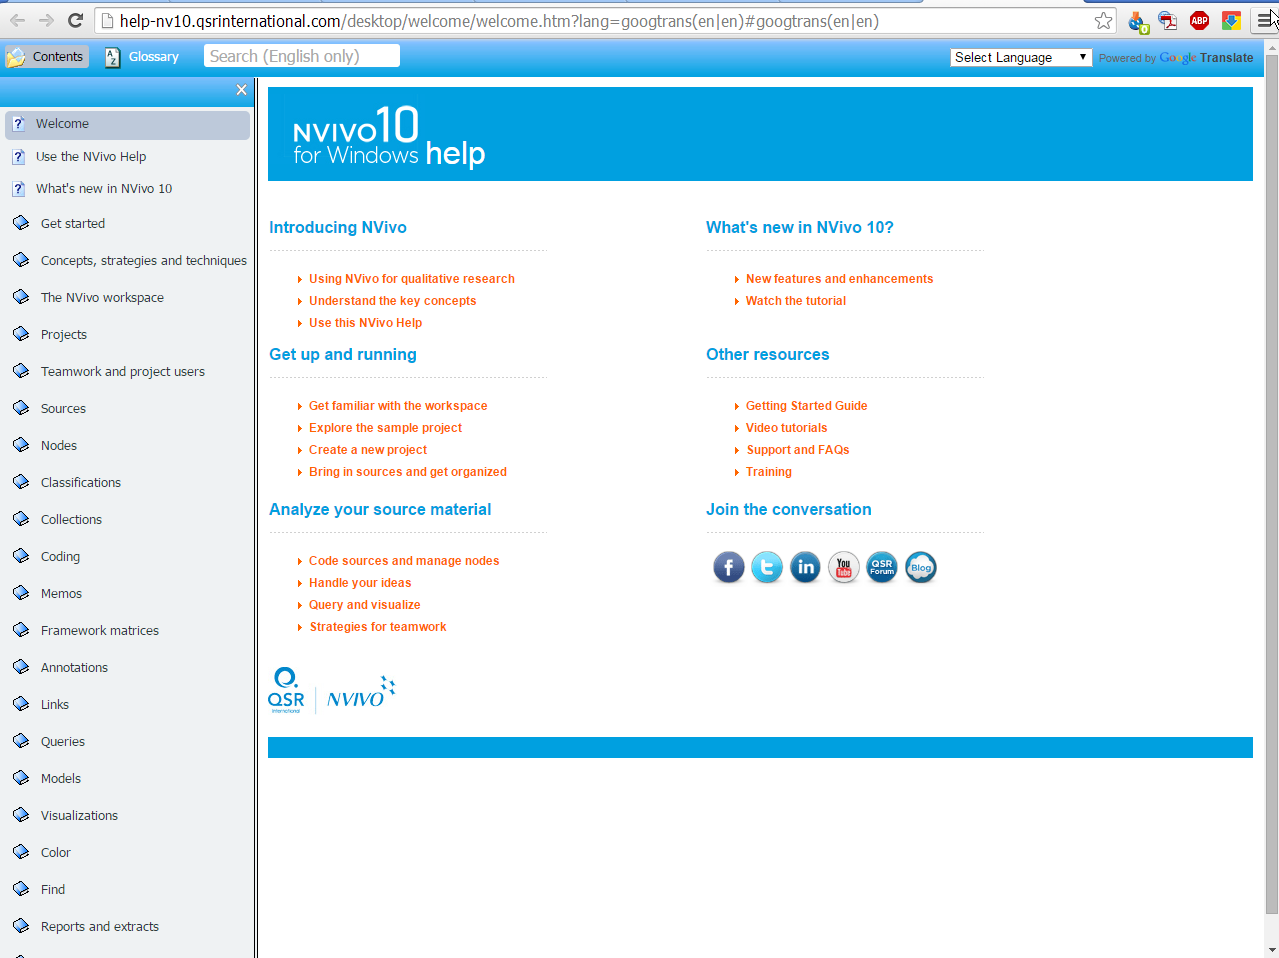
More about the NVivo 10 User Interface (on Windows)
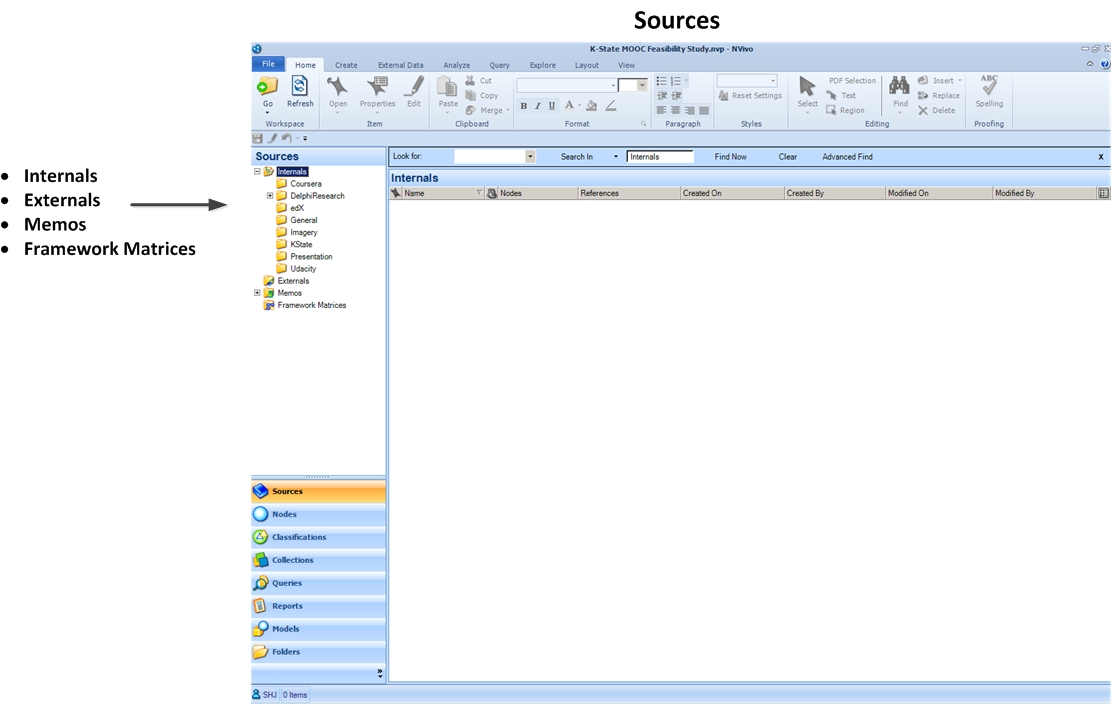
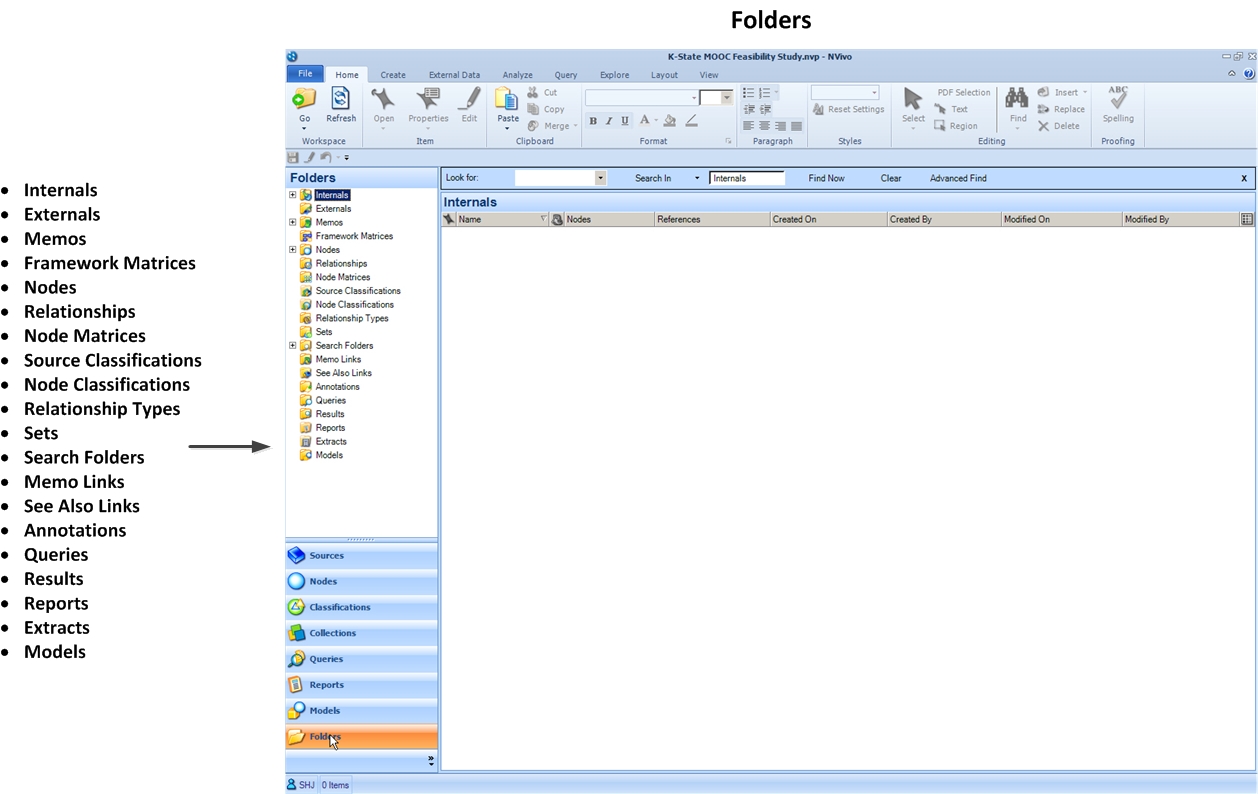
The Internals folder contains any sort of digital files that are usable in NVivo: text files (.doc, .docx, .txt, .rtf, and others), document files (.pdf), imagery (.png, .jpg, .tif, and others), audio files (.mp3 and others), video files (.mov, .mp4, and others), datasets (.xl, and others), and so on. Microsoft slideshows (.ppt and .pptx) are not ingestable, but they may be easily converted to PDF with a free PDF converter. (Make sure all PDFs are optical character recognition-enabled or OCR-enabled, so it may be machine-read for analyses. That said, even OCR-ed PDFs may not be reading a file accurately in a useful way. One way to test this is to OCR the .pdf...and then output a Word file from the OCR-ed version. Is the Word file readable through natural human close-reading? Oftentimes, the output file has a lot of "noise" and very few readable words. The state-of-the-art in 2020 still is problematic in terms of computer reading of files. Some computer vision-enable artificial intelligence can do better...but only with small pieces of visuals...and often with high-contrast manipulations to make a muddy file more readable by machine. Check the output file to ensure that the file you're using is not "lossy.")
The Externals folder contains “proxies” for non-digital (and digitally inaccessible) sources of relevant information for the research. These “external” types of data sources may include file types that are not ingestible into NVivo, such as eight-track tapes, cassette tapes, vinyl records, some types of camcorder-recorded video, and so on. Certainly, it is possible to recapture or transcode some data in non-digital or defunct media.
The Memos folder contains notes about the research by the researcher / research team.
Framework Matrices are matrices that may be used to help provide a summary overview (framework) of source materials. One example that is used is the pulling out of particular themes in the columns (and listed in row A1) and then various individual cases or exemplars in the rows below. In each of the intersected cells, then, are the respective summaries. Another organizational method may be to have each of the rows be different age groups or different regions of the interview subjects or different socio-economic status factors used to group the respondents…and themes about their responses on a number of variables (in the columns). A framework matrix is not automatically populated. Rather, the intersecting cells are filled in manually by the researcher or research team.
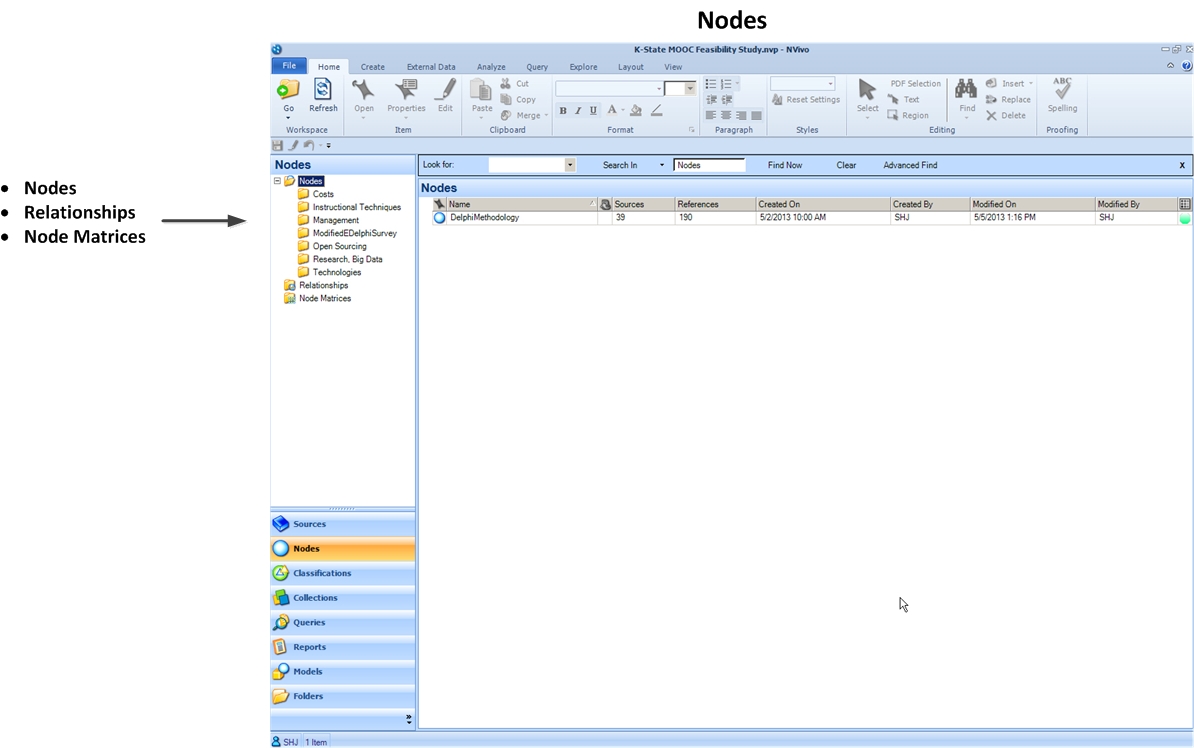
The Nodes space contains the coding linked to the particular project. This may include codes that were both human-created as well as those that were auto-coded (by data ingestion and / or by machine-emulation of human coding patterns).
The Nodes section also contains any of the defined relationships between the nodes.
Also, any node matrices are included. Node matrices are created when particular nodes are selected and cross-referenced against other nodes to find points of overlap.
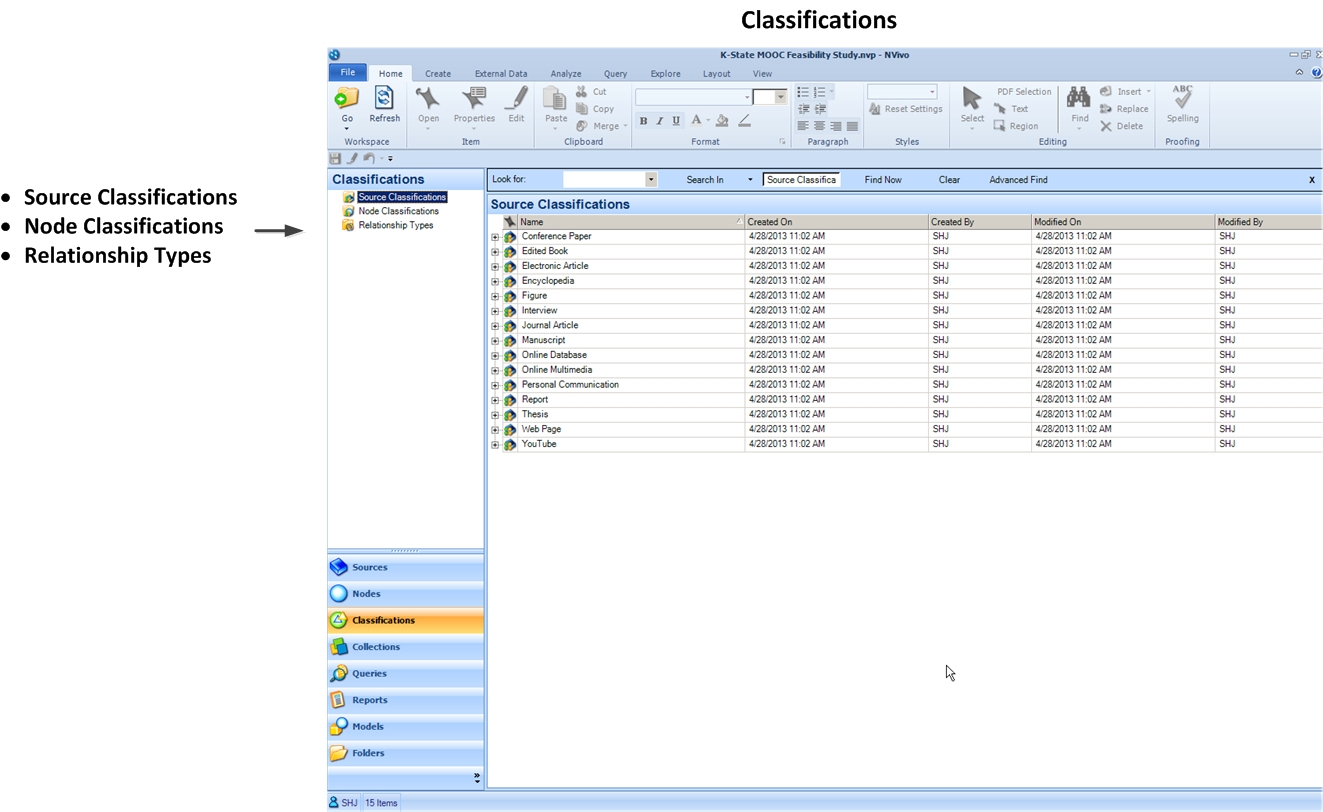
For example, the Sources types include top-level categories as follows: conference paper, edited book, electronic article, encyclopedia, figure, interview, journal article, manuscript, online database, online multimedia, personal communication, report, thesis, web page, and YouTube. Within each of these categories are all sorts of metadata about that particular object type. Additional categories may be created while in the Classifications space.
Node classifications may be manually created.
Relationship classifications may be manually created.
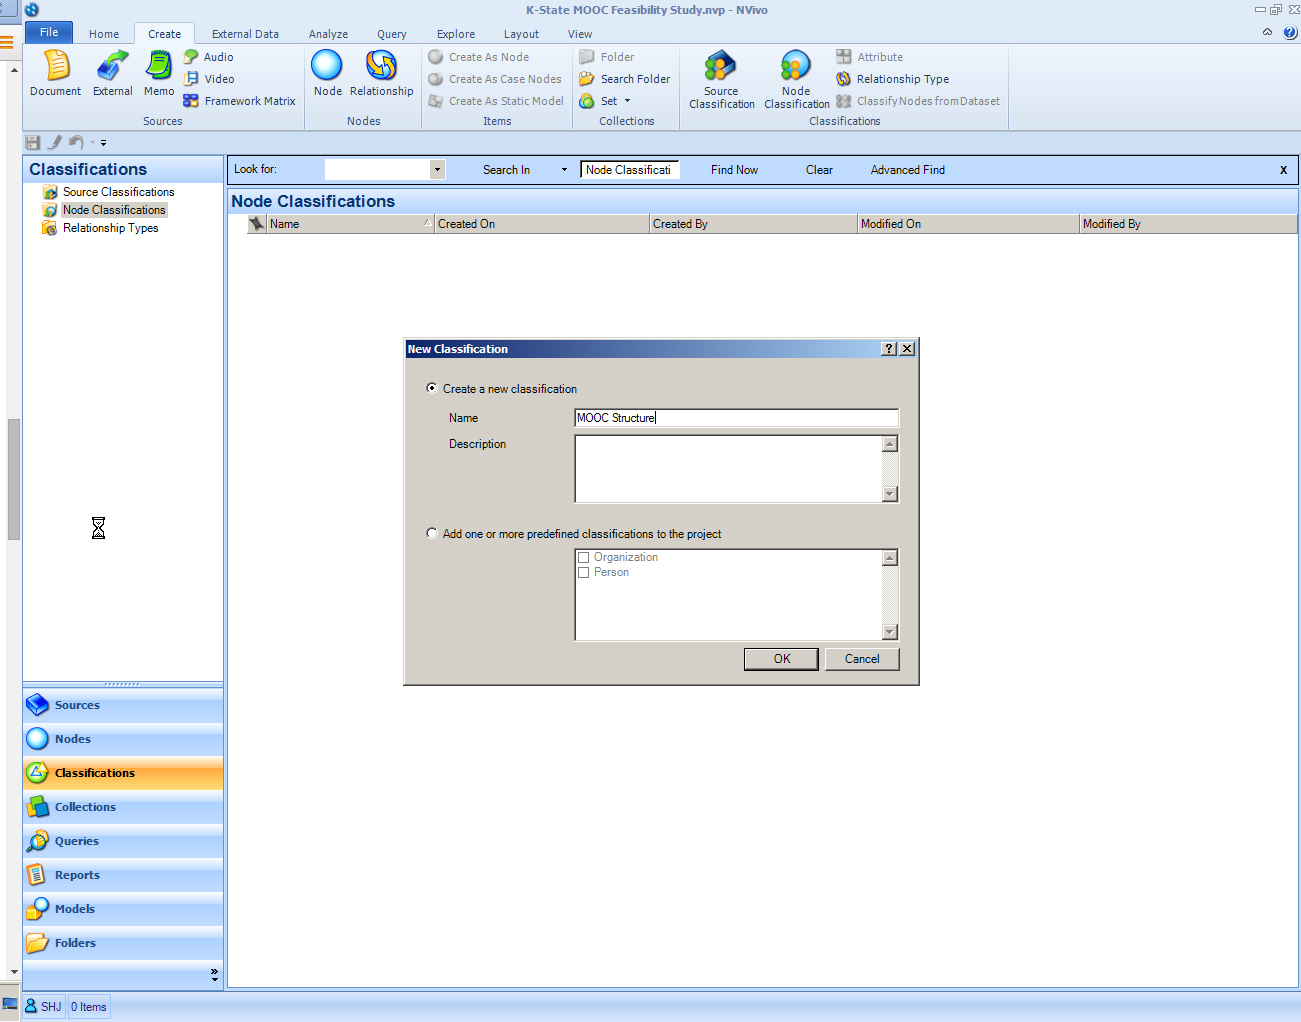
A new node classification enables the categorizing of node types. (Nodes may be categorized as individuals, such as respondents to focus groups, interviews, and surveys. They may be categorized as entities, organizations, or communities. The “types” of nodes may be classified then as certain node types based on their attributes—to enable comparing across attributes.) Some nodes may represent attributes of survey respondents, such as age groups or SES (socioeconomic status) or gender. Other nodes may be conceptual ones. Yet other nodes may point to individuals who are named interview subjects. A contemporary qualitative or mixed methods research project may entail a wide variety of different variables and perspectives—in order to make the most of the collected data. A meta-data approach to looking at the various codes is this sort of classification (a typology of nodes).
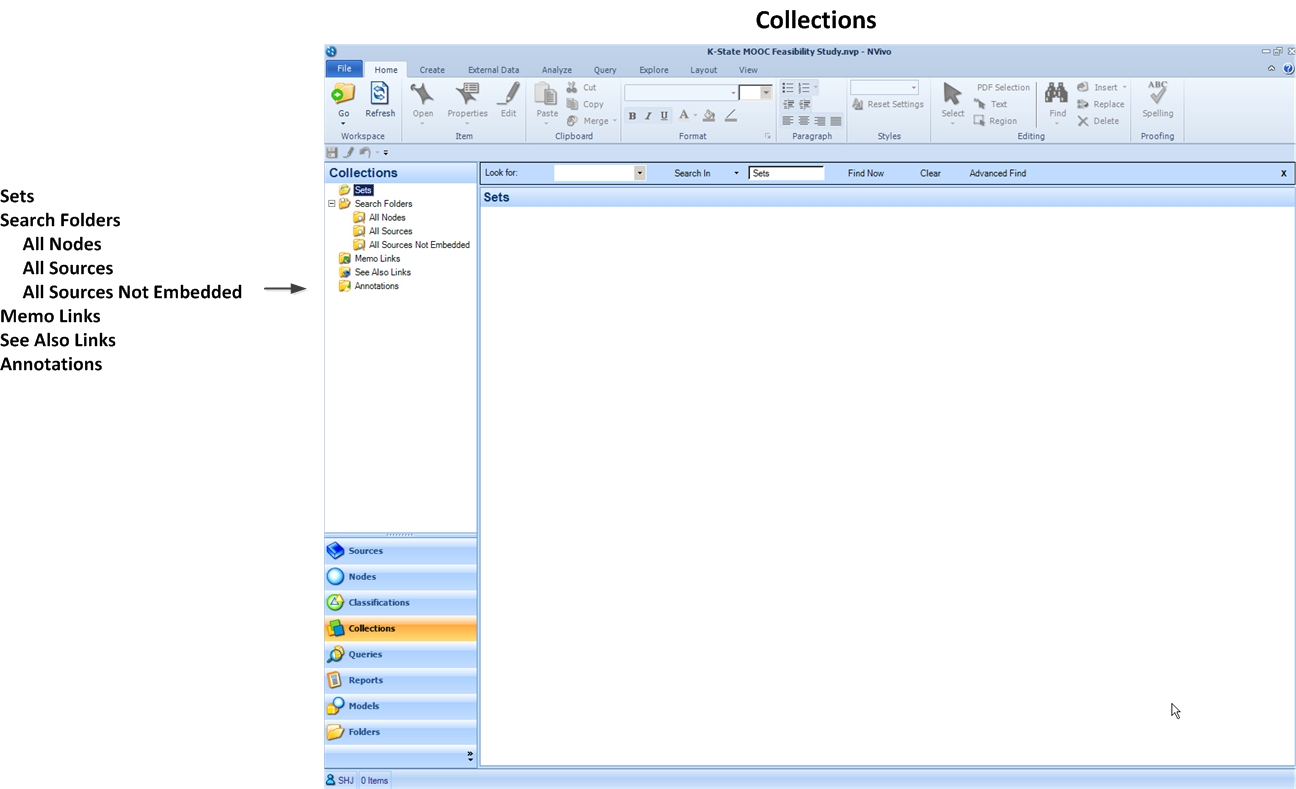
Sets
Search Folders
All NodesAll SourcesAll Sources Not Embedded
See Also Links
Annotations
QSR International’s site defines the above elements:
- "Sets—a set is a group of selected sources or nodes. For example, a group of video sources that you need to transcribe.
- Search Folders—groups of project items that meet specified search criteria. The items shown in a Search Folder change as you add, remove or modify the items in your project.
- Memo Links folder—all the memo links in your project are listed in this folder
- See Also Links folder—all the 'see also' links in your project are listed in this folder
- Annotations folder—all the annotations in your project are listed in this folder."
Depending on how source information was ingested and processed, they would show up here. There may be sets of different types of digital objects. There may be sources organized in folders of different contents. There are many ways to use this space in the Navigation View based on researcher needs and researcher definitions.
These folders are partially auto-populated. They can also be manually populated based on how the researcher or research team wants to use these.
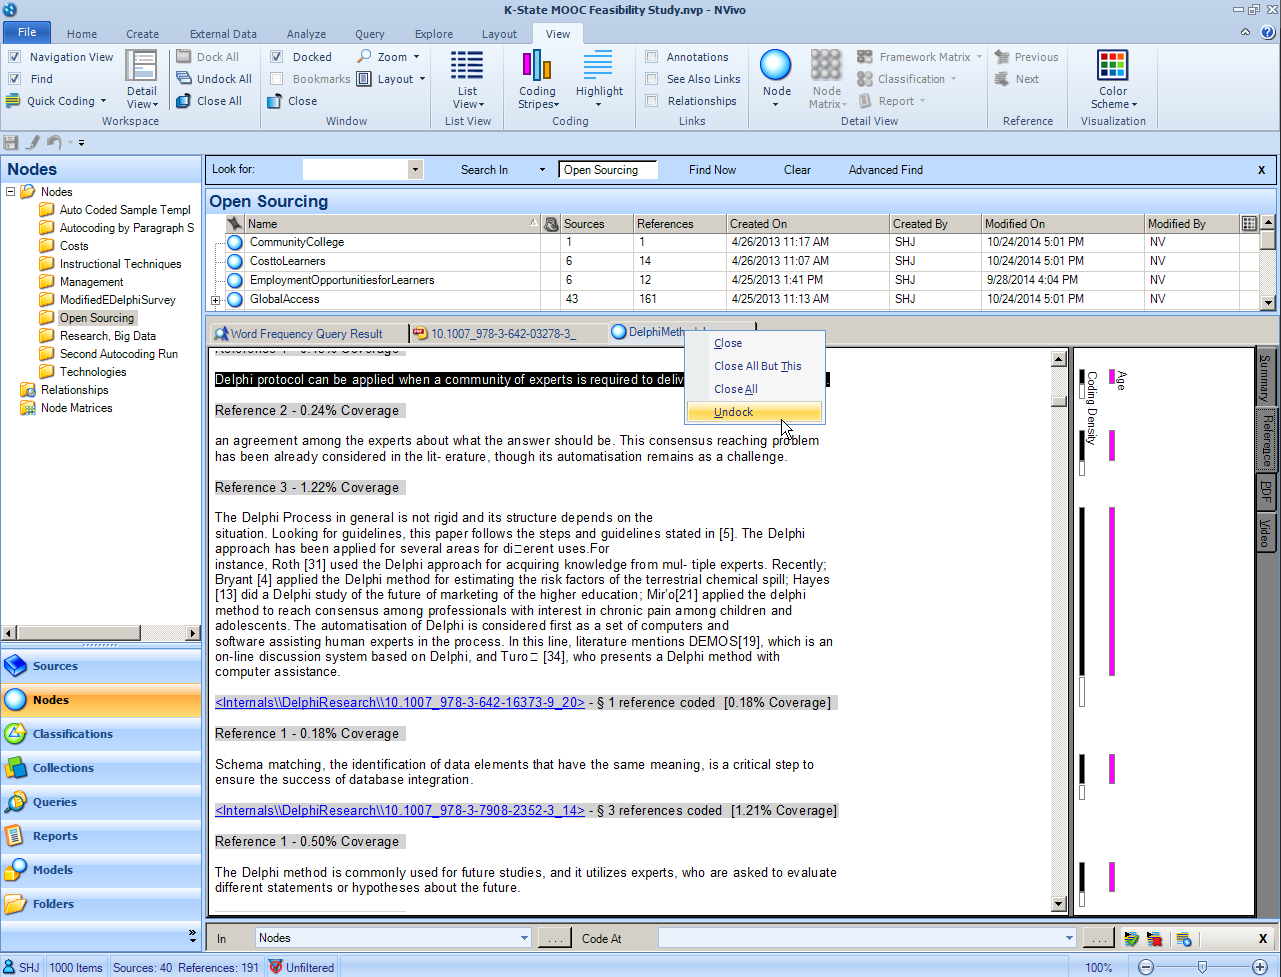
Below is a screenshot of the “All Nodes” folder within the Collections space.
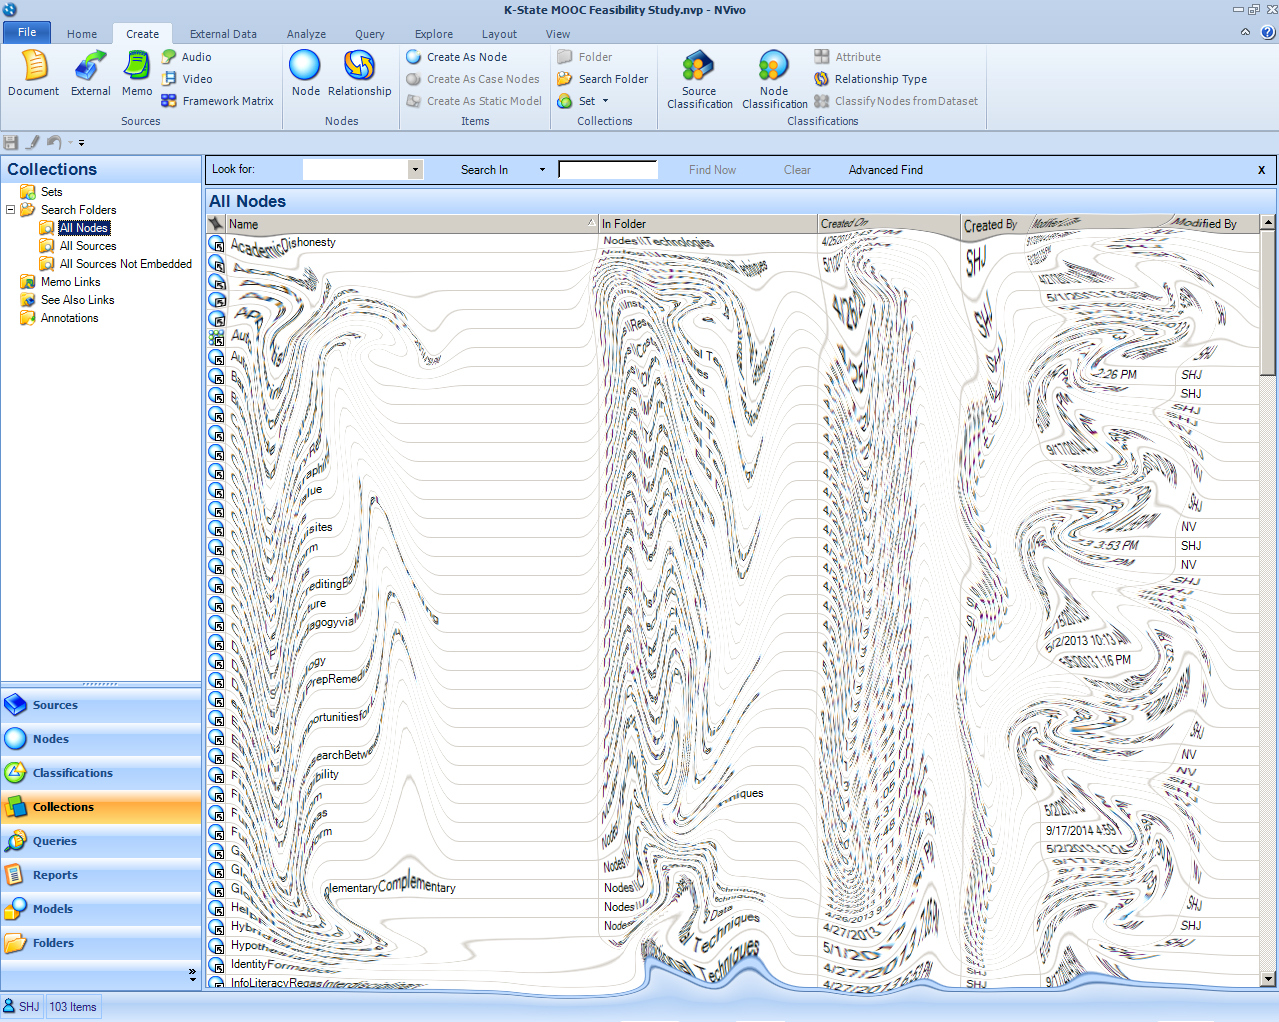
Queries Space
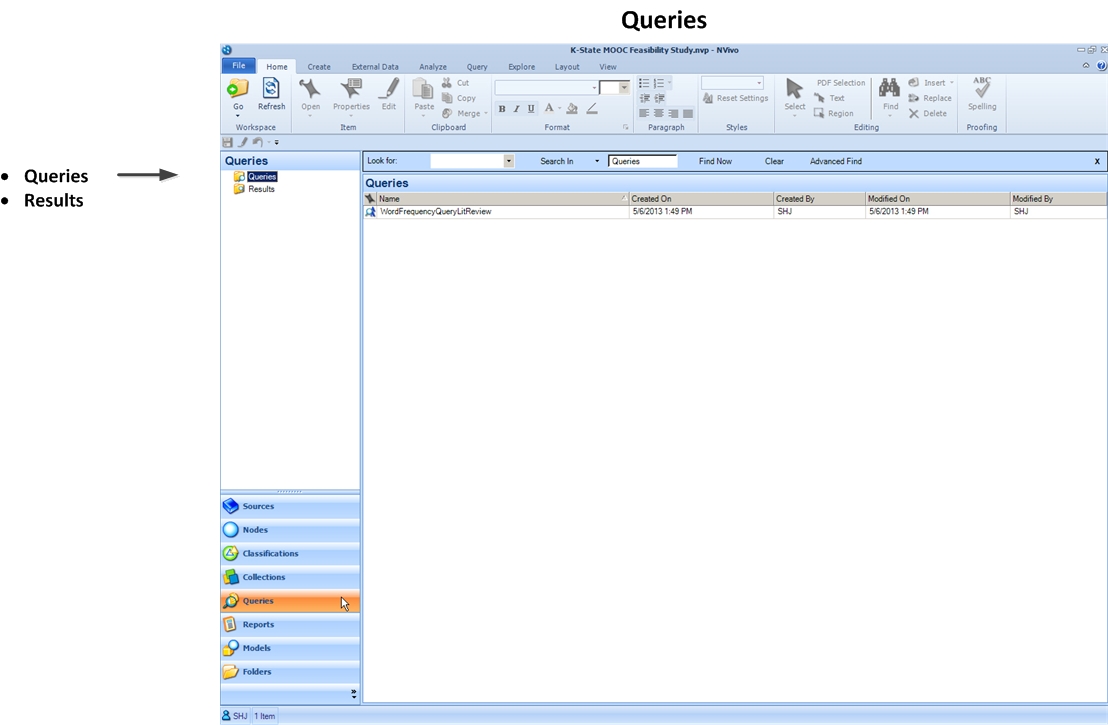
Models Space
- Multiple points of access. NVivo is designed to have multiple points of access to updating nodes, memos, annotations, and so forth. If you have a preferred way of accessing contents, jot down some notes about how you achieved certain functions, so you can repeat those steps to repeat the functionality at a later time.
- Encapsulated capabilities. Like many software tools, NVivo "hides" capabilities for certain work until a user highlights the requisite file. What this means is that if a user knows how to navigate to a certain file, he or she will find "context menu" options that he or she may not have realized were available. If a researcher knows how to navigate to an object, he or she will have a range of options.
- Findability. Generally, it is a good idea to have a coherent folder structure, a coherent node structure, and so forth. It may take some hard work to achieve those, and NVivo is highly flexible in allowing re-naming and the moving of resources and nodes, and so forth. Even if a researcher did not label objects appropriately, the various items may be found based on a simple "search-find"...or on the default folder structure inside NVivo. It may help to review the various elements in the NVivo interface because that will help if a researcher ends up on a hunt for a lost file or memo or node or some other object.
- Reorientation. The "opening screen" of a project is generally to the Sources area and the Internals source folder. The software does not maintain a context-sensitive memory about where a person was working last. To aid in re-orienting researchers, it may help to have a memo that records where a researcher last left off coding, if he or she wants to start again in that context.
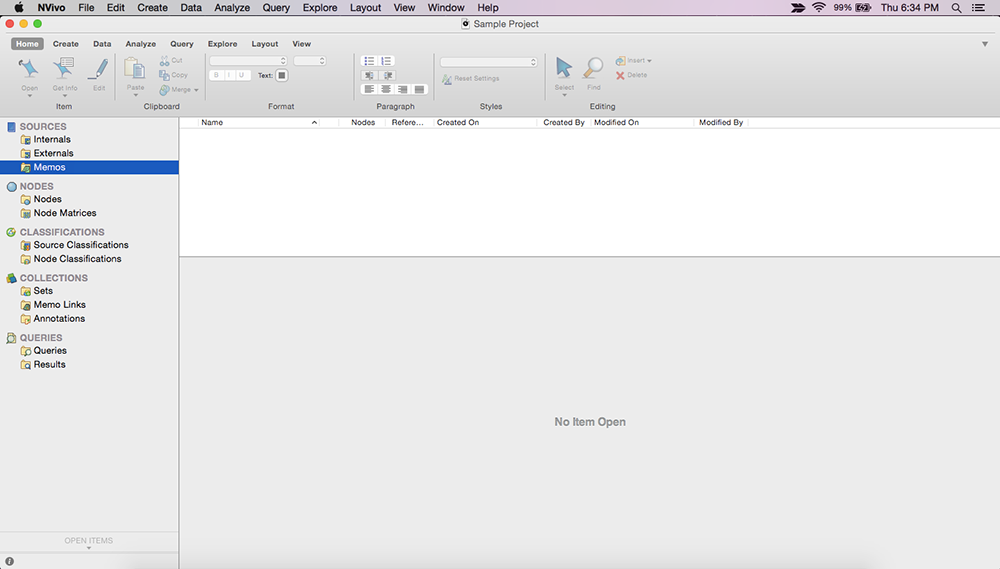
The NVivo for Mac opening screen (with its left menu fully expanded) is shown below. A sample project was not built into the Mac tool, so this visual is only a kind of placeholder image to remind readers that there is a native NVivo for Mac version (which debuted in mid-2014).
NVivo (Windows) <-> NVivo (Mac/OS)
It is possible to convert from .nvp projects on Windows to Mac OS and vice versa.
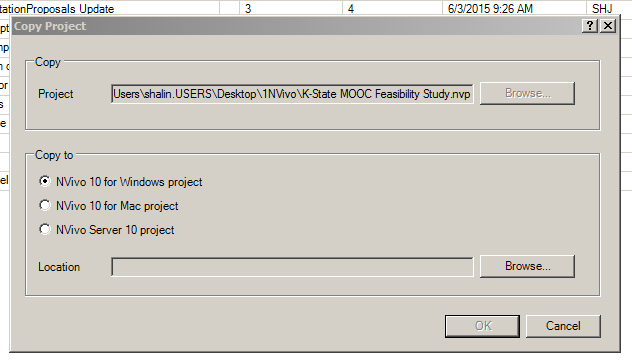
The basic sequence is File -> Manage -> Copy Project -> Copy to "NVivo 10 for Windows project" OR "NVivo 10 for Mac project" (or "NVivo Server 10 project"--if the organization has a server license and project hosting on its own servers).
An example screenshot follows.
To go in the other direction, there is not an equivalent process on the Mac version. Rather, open up the NVivo on Windows version, and open the .nvpx file (created in the Mac version of NVivo), and the user will be enabled to access that project and convert it to a Windows format file.
Discussion of "The NVivo User Interface"
Add your voice to this discussion.
Checking your signed in status ...