Exporting Code Categories (Nodes) for Close-in Analysis
Some researchers want to be able to export a node (a coding category) and its contents in order to examine the coded contents in more detail (and maybe using external software tools--such as those that enable unsupervised "network text analysis" and other approaches not currently available in NVivo).
NVivo enables the exporting of nodes and their descriptive contents in several forms.
Exporting Nodes from NVivo
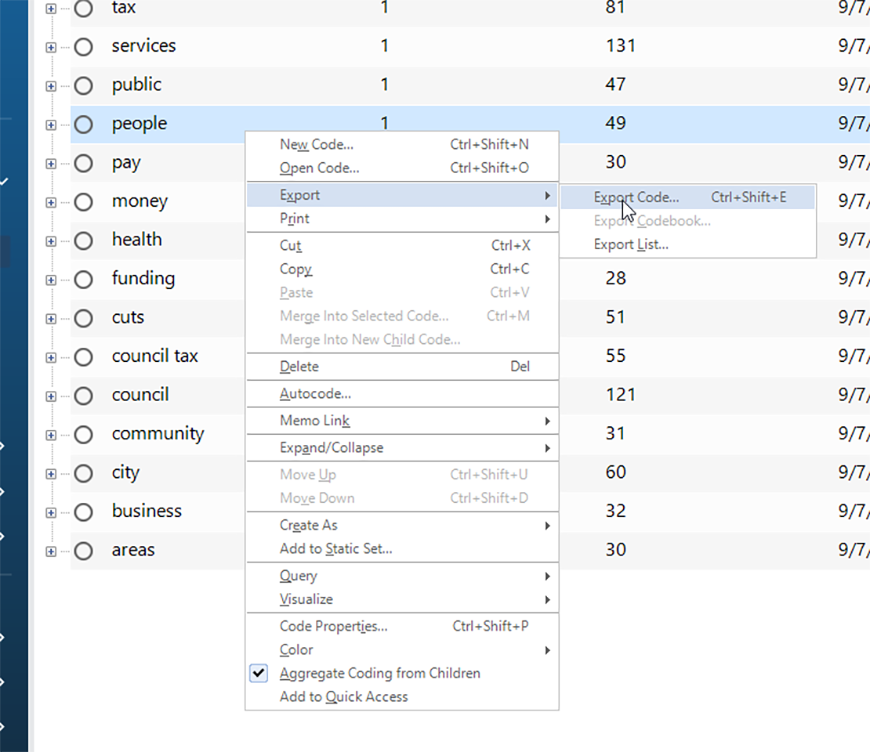
First, identify the desired node (coding category or classification) for export. Place the cursor on the node, and right-click on it. A dropdown menu will appear. Go to Export -> Export Code ("node" in the earlier nomenclature).
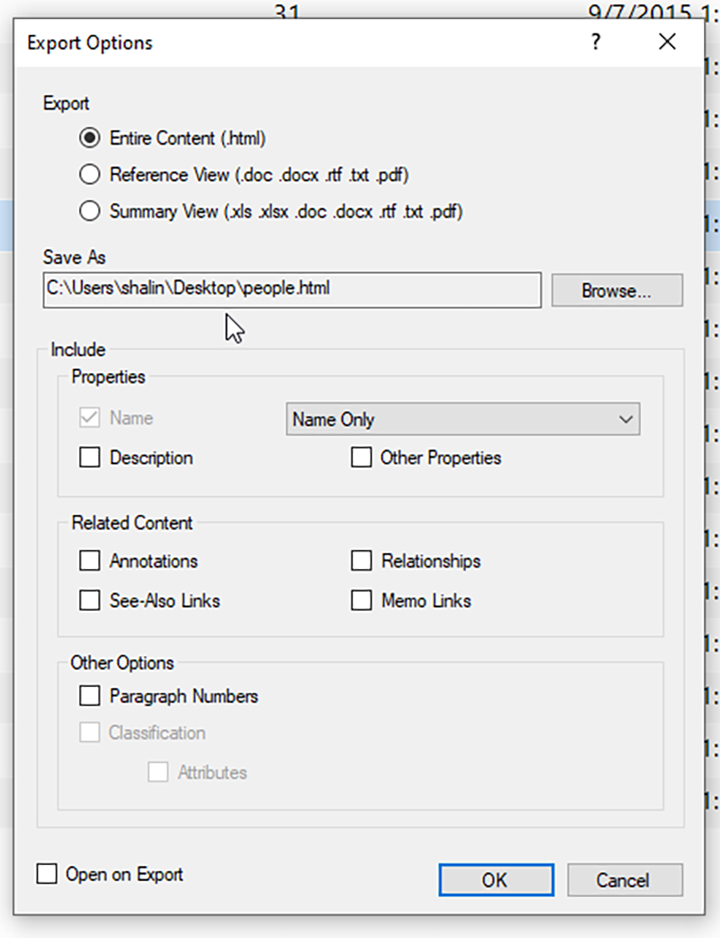
The Export Options window will open.
Users will be able to export the entire contents of the node as an html file, a reference (overview) as a .doc, .docx, .rtf, .txt, or .pdf, a summary view (similar to the view that the user sees inside NVivo when the node is double-clicked into and viewed textually) as .xls, .xlsx, .doc, .docx, .rtf, .txt, or .pdf. Further, the user may select what properties of the node to include, whether related contents (like metadata) are desired, whether paragraph numbering should be included, and other features. Users also need to decide where to save the file.
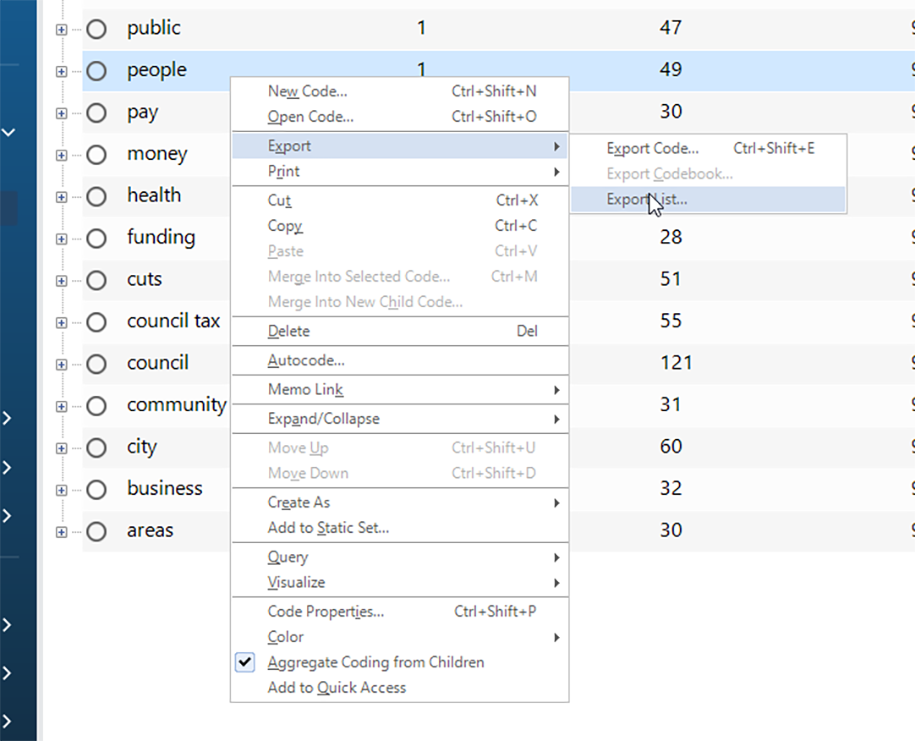
When exporting by list, the contents will show in .xlsx.
Exporting Node Matrices
Whole node matrices may also be exported as .xlsx, .xls, .sav, .txt, and other files (think data tables that may be explored with various software programs, like Excel and SPSS). These capture not only particular nodes but also the interrelated node data.
Why %age of Coverage Notations?
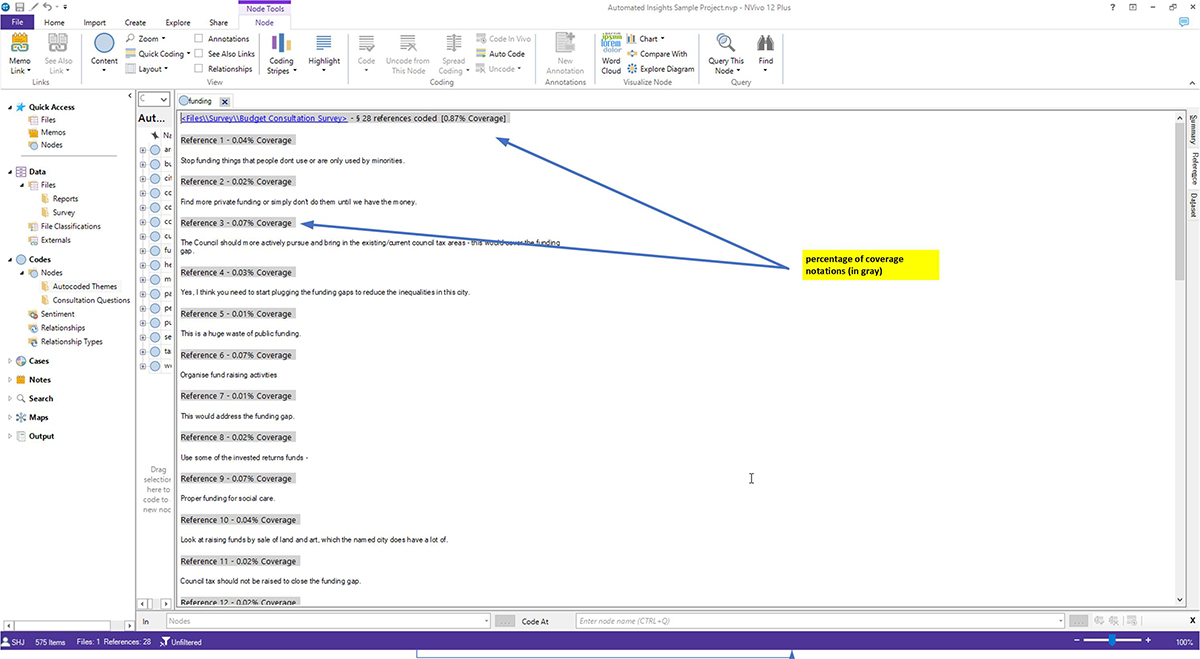
As a side note, people have asked why the nodes show how much a coded segment represents a % of the coverage (of both the node and then of each coded portion. These can show perhaps the contribution of each particular source to a concept...and also cumulatively how much each concept weighs in on the particular issue (assuming the codebook has been coded to saturation).
That percentage coded information informs at the level of data visualizations, too, such as various area charts and word clouds. However, I have not seen direct citation of those numbers in articles I've read that referred to NVivo as the data analytics tool.
Also, I have seen such measures in various qualitative data analytics tools, and they are included almost as an affectation (IMHO). Those working in computing like counting everything. Or / and perhaps I am missing the point.
Discussion of "Exporting Code Categories (Nodes) for Close-in Analysis"
Thanks!
Dear Typo: Thank you for your observation. I've made the change.It's rare that anyone will add a fix, so I am especially grateful for your help.
Posted on 5 September 2016, 3:04 pm by Shalin Hai-Jew | Permalink
Add your voice to this discussion.
Checking your signed in status ...