Creating Network Sociograms (Social Network Graphs)
Social Network Diagrams from Social Media Data
Manually Drawn Node-Link Diagrams
In their most basic form, network diagrams are comprised of nodes (vertices) and links (edges). The nodes are represented by labeled circles, and the links are represented by lines. (Lines with arrows or directions are used in directed graphs, and lines without arrows or indicated directions are used in undirected graphs. Lines without arrows indicate an association but not the direction of it.) Different social network graphs (sociograms) focus on different types of relationships. The nodes represent entities, and the links represent relationships. Network diagrams are used to depict a variety of relational phenomena. Sociograms are a particular type of social network diagram that show relationships between social (individuals and groups) entities. These may be drawn manually, or they may be drawn by machine based on data.
NVivo enables the creation of two types of network sociograms: (1) an egocentric sociogram and (2) a network sociogram. It also captures some basic social network metrics at the node (vertex) level and also at the network graph level.
The sociograms tend to be multimodal ones. This means that the depicted vertices may be of different categorical kinds: persons, organizations, source documents, coding nodes, locations, attributes (like source types), and so on.
Two Types of Sociograms
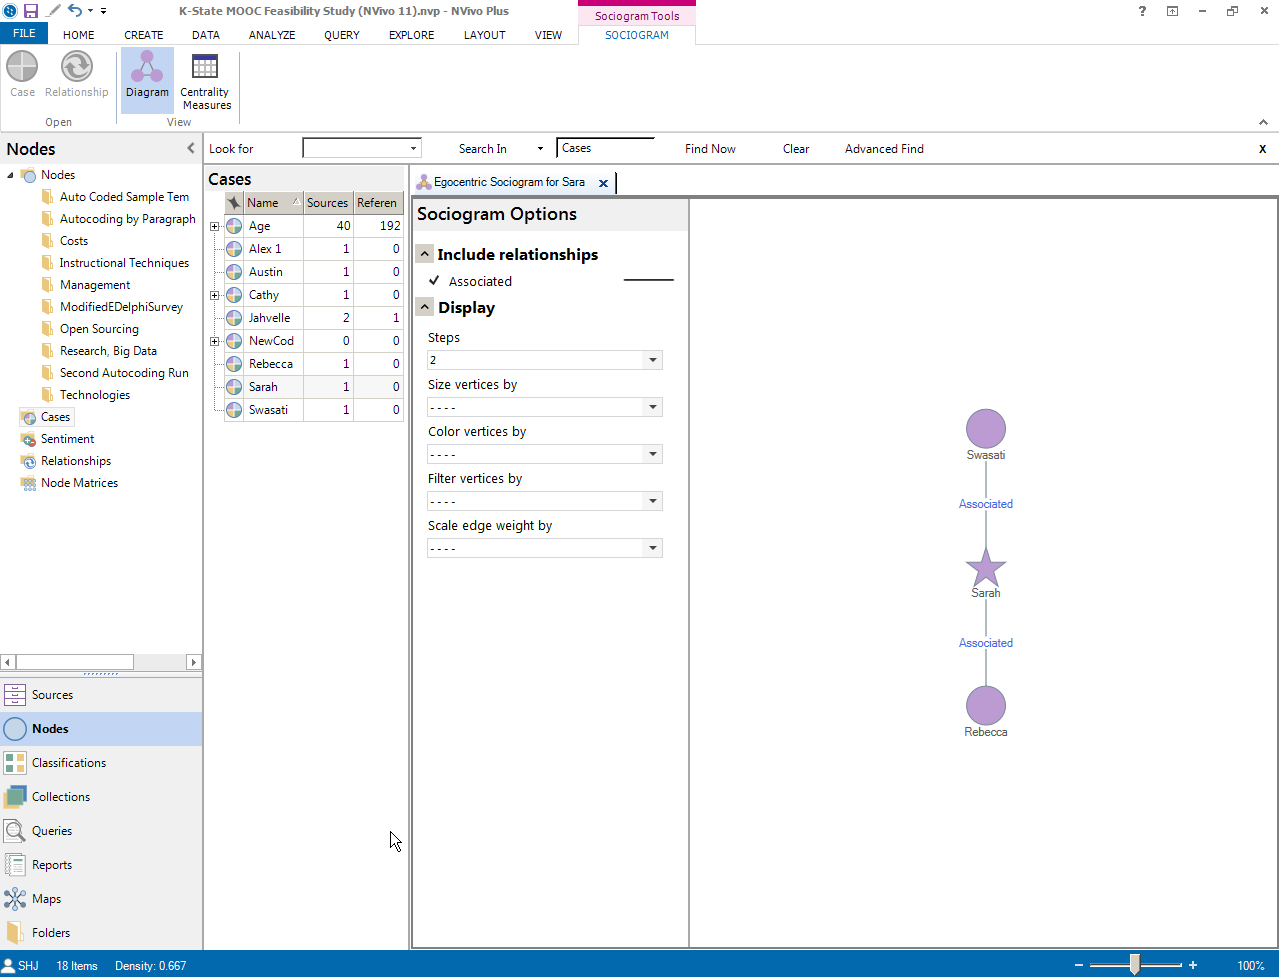
An egocentric sociogram is based on a particular focal case node (representing an individual or organization) and shows all links to that particular ego-based node, such as other individuals, themes, locations, and other mixes of data. In this type of network, the individual case is at the center of the network, and the networks are directional ones (vs. undirected networks in which the edges do not have arrows). The egocentric sociogram depicted is a one-degree ego-neighborhood one (with direct ties between the focal node and the other vertices in the network).
To create an egocentric sociogram, there must first be nodes that are case nodes (representing individuals or groups, or "egos" or "entities"). These nodes must have some defined relationships. Then, a target case node is selected as the focal one around which all extant relationships are drawn.
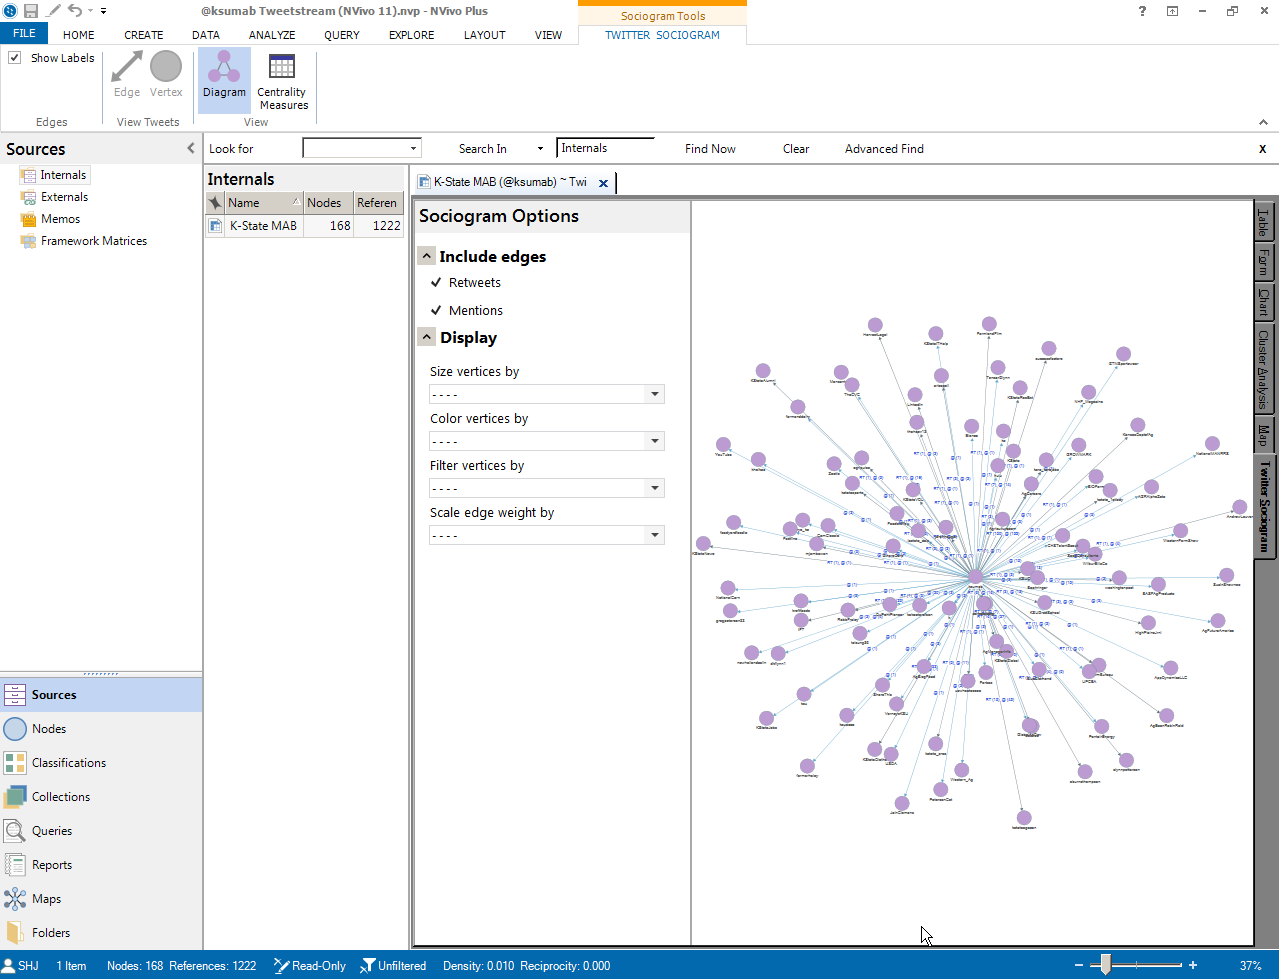
The second type of sociogram is a network sociogram. In this latter type, the social network may not be focused around on ego (person or organization) node. Here, a network sociogram may be comprised of extracted Twitter information and the relationships (edges or ties) from reply-to, re-tweeting, follower-following, and other types of interrelationships on that microblogging platform.
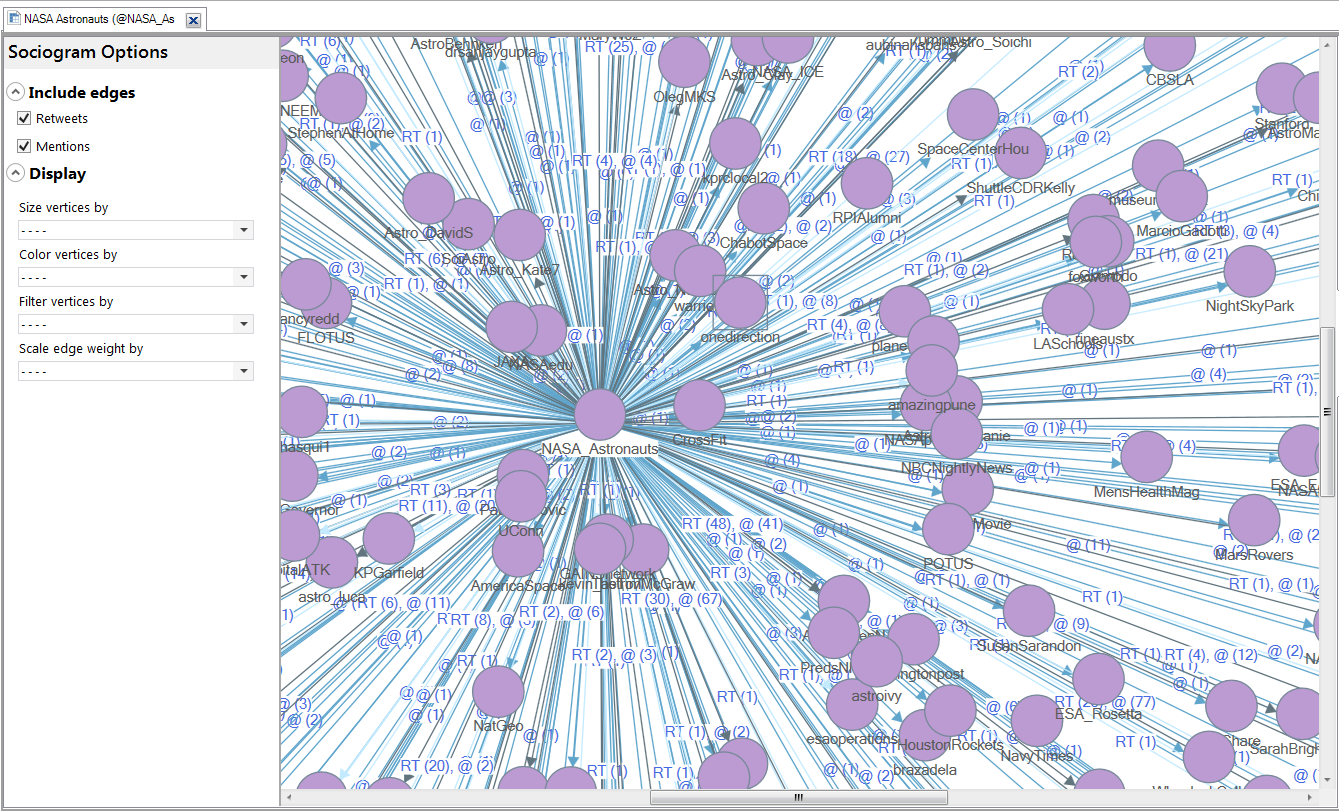
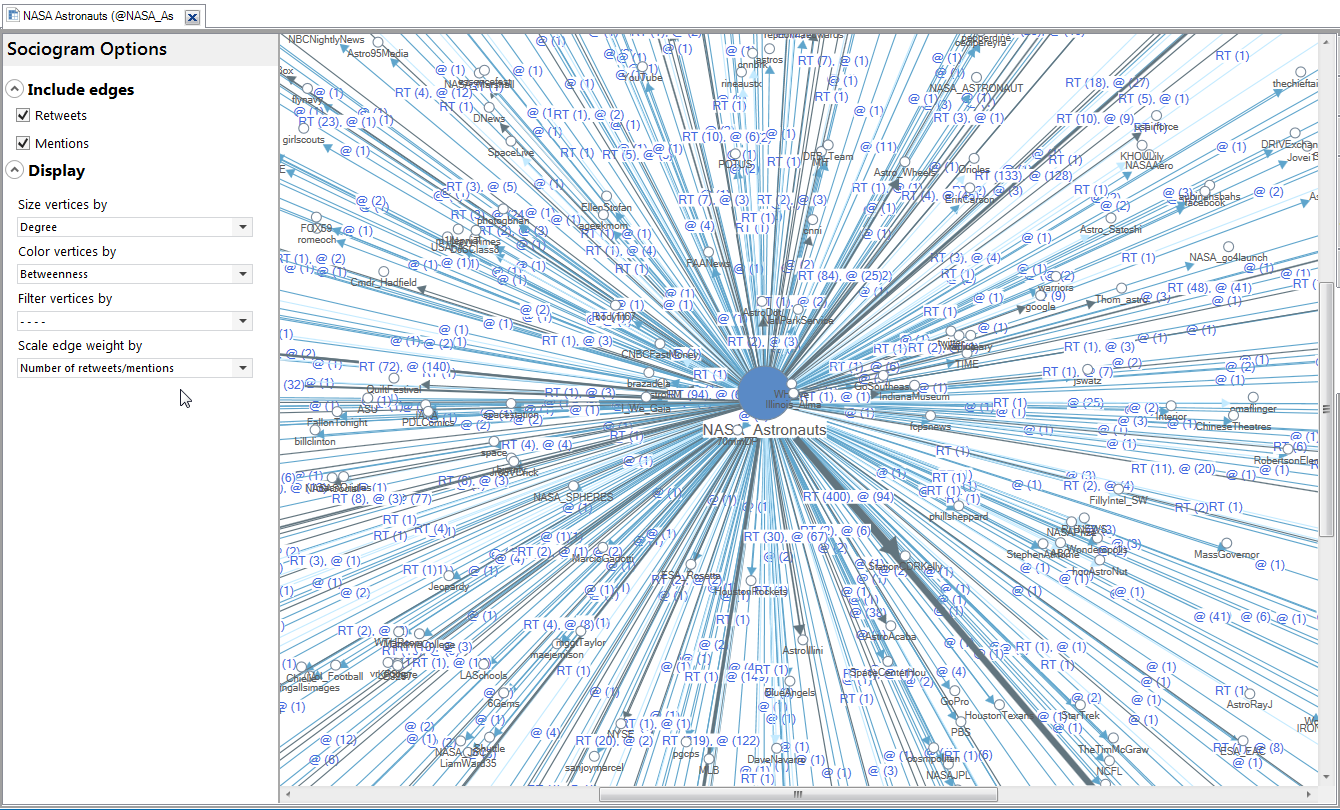
So what does the sociogram visual show? The following shows a close-in view of a sociogram created from a data extraction of the @NASA_Astronauts verified account on Twitter. This relational graph is captured from a dataset of 3,151 recent Tweets from this Tweetstream. The edges in the graph show retweets (RT) and mentions (@), with the actual raw counts in ( ). To zoom in to the graph on a Windows machine, use the CTRL + Plus key. At the time of this data extraction, the target account had 15,000+ Tweets, 79 following, 436,000+ followers, 613 favorites, and 2 lists. (Tweetstream datasets may be extracted without retweets included. Or the retweeted messages may be filtered out after the data capture.)
NVivo also enables redrawing of the sociogram based on various graph metrics. Vertices may be redrawn based on degree, in-degree, out-degree, betweenness centrality, and closeness centrality...expressed in size and in color respectively. There are filtering options based on the prior metrics as well to aid in thinning out a sociogram. Edge or link weights may be depicted based on Retweet (RT) counts and Mentions (@) counts.
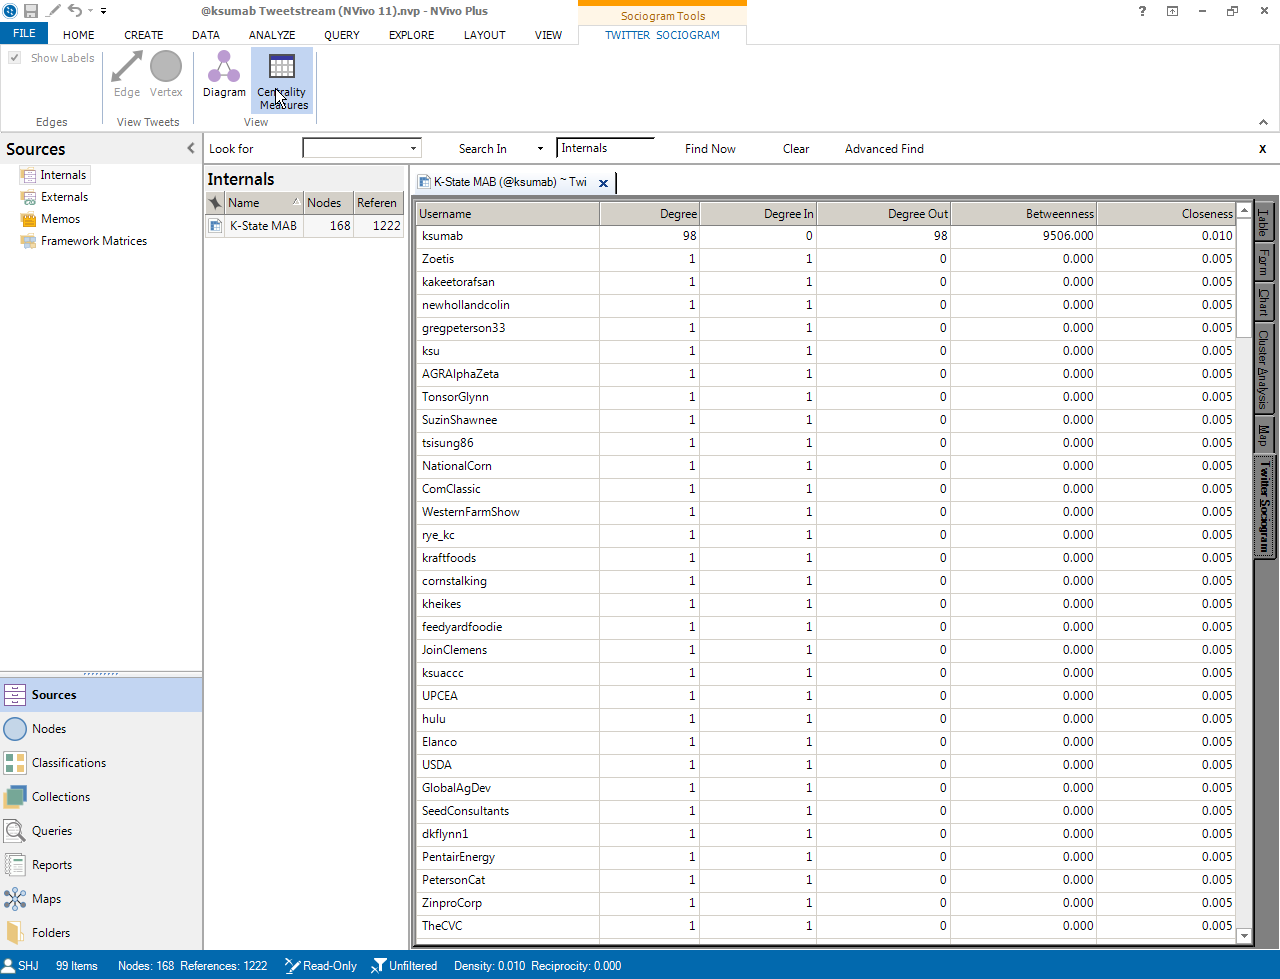
Extracted centrality measures from the Twitter user's Tweetstream relationships may also be accessed.
Network sociograms may also show interrelationships between nodes that are based around a particular locale, a particular phenomenon, a particular research group, or some other depiction (this all depends on the available data and on the defined relationships). Relationships may be manually created by the researcher in NVivo, and these may be extracted from social media platforms (which enable the extraction of user account data and interrelational trace data). Some sociograms may be created from metadata as well (such as folk-based tag data). Sociograms may be used at any point in the research--for data exploration to data summarization and presentation.
Exporting Sociograms
These sociograms may be exported as a digital image or as a Pajek file (which enables further and more complex visualizations). Within NVivo, the network sociograms are necessarily sparse for readable visualizations. The workspace for viewing sociograms is also relatively small.
There are settings to sparsify social networks, too, by removing particular types of relationships and re-drawing the social networks.
The initial data capture from social media often is in the format of a data table. Those should be transcoded from .nvcx files...into a .csv within NVivo and exported out. Those data tables can be reformatted in ways that can be read as relational sociograms in other technologies (like NodeXL, Pajek, Gephi, Cytoscape, R, and others).
Note: Do note that there are limits to the sociograms in NVivo. While the graphs are directed, they only show the followings of the particular ego node. Followers that subscribe to the target node are not listed.
Discussion of "Creating Network Sociograms (Social Network Graphs)"
Add your voice to this discussion.
Checking your signed in status ...