Analyzing Social Media Data in NVivo
Social media platforms are a feature of Web 2.0 or the Social Web. These platforms enable people to create accounts, share digital information, intercommunicate, and interact with each other. Social networking sites include Facebook and Linked In. Microblogging sites include Twitter, Sina Weibo, and others. Wiki sites include Wikipedia. Social content sharing sites (and services) include YouTube, Vimeo, Flickr, Instagram, Pinterest, SlideShare, and others. Only some of the prior social media sites enable broad extraction of their data through application programming interfaces (APIs). Publicly accessible sites hosted using MediaWiki as an understructure are accessible through usual http-crawlers and special third-party analysis tools.
[Note: The examples here are depicted visually with some older versions of NVivo.]
Types of data extractions from social media platforms.
In terms of data extractions from social media platforms, some of the data may be simple extractions of a website (as a PDF document), which would include the text and images from the site, and maybe links to videos. Those may be analyzed and coded piecemeal as information from any other basic website. [Notes: To access a website as a .PDF, to with ctrl + print (to PDF)...rather than going with the NCapture version. The NCapture version seems to add size to the file without additional other benefit. Do run the OCR on the .pdf file to ensure that it is machine readable in NVivo.]
Other content extractions may be collections of microblogging messages, blogging messages, wiki pages, extracted images, or links to videos. There is also metadata captured about content tags and social relationships among user accounts or contents. In those contexts, more analytical capabilities may be applied to the datasets.
Application programming interfaces (APIs).
The availability of these types of information depends in part on the application programming interfaces (APIs) for the social media platforms and the developer work of various middleware tools to extract the data. Many of the platforms "rate limit" access to their data, and some require "whitelisting" to their site in order to regulate and control access. (There are some capabilities of data scraping from web servers that may be done in a command line way to capture yet other data sets. Some browser-based plug-ins enable fast and efficient downloads of data hosted on Web servers.) Many APIs also do not offer access to a full dataset of information (no N = all). It is important to read the fine print about what each social media platform makes available and the respective terms of use for that data. Some also require citations for use of the social media platform data or web facing tool (through which some of the data may be accessed).
There are various required dependencies to access social media data.
A Tweetstream Dataset
In this section, the focus will only be on how to analyze social media data that is capturable by NVivo. In particular, the focus will be on analyzing Tweetstream datasets from Twitter and YouTube videos (based on YouTube links).
Fresh data was captured for this page using the NCapture plug-in to Google Chrome and Internet Explorer. For this project, a Tweetstream dataset was captured from both @CNN and @DHSgov. Also, one video each was collected from the YouTube channels for CNN and ushomelandsecurity.
First, the data from these sources were ingested. In the NVivo ribbon, within the External Data tab and the Import group, “From Other Sources” was selected. In the dropdown, “From NCapture” was selected.
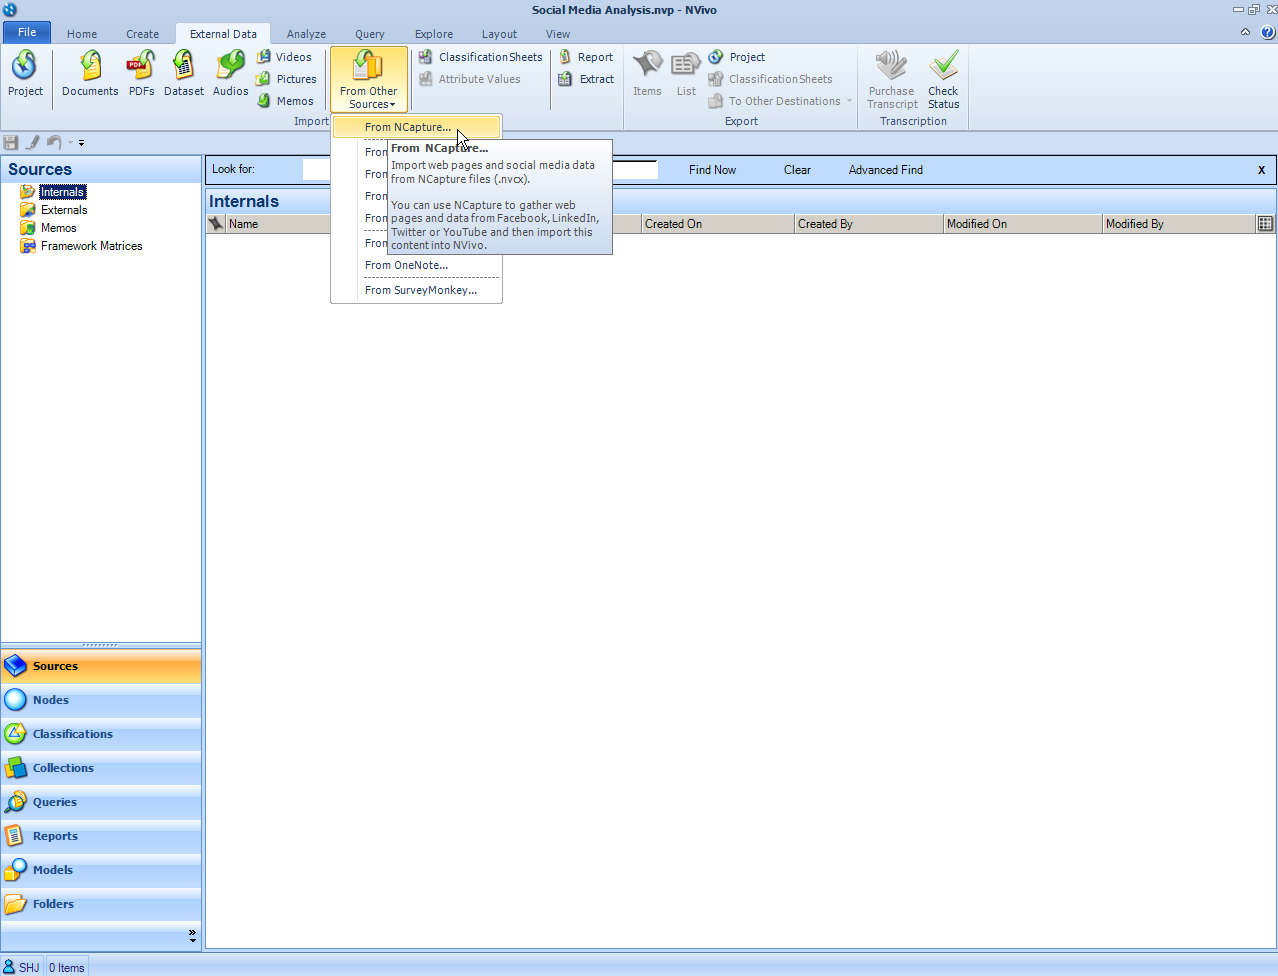
In the “Import from NCapture” window, check the captures that should be ingested. Click “Import.”
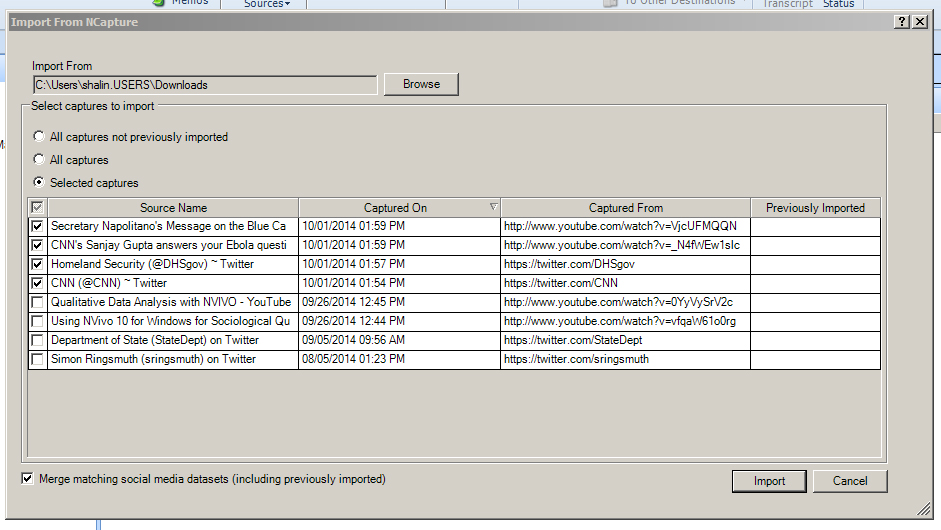
The datasets are ingested.
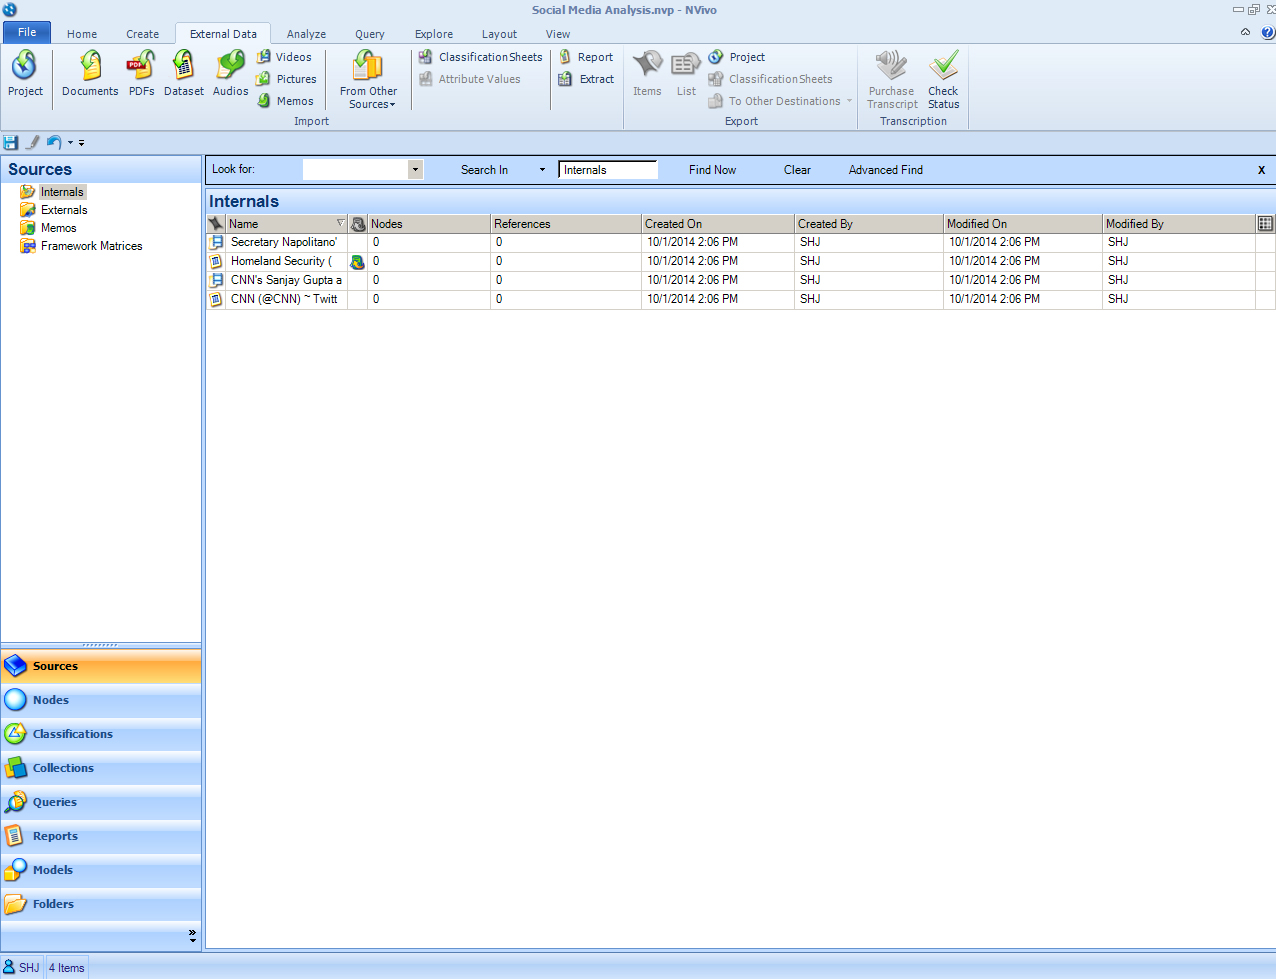
Analyzing Tweetstreams in NVivo
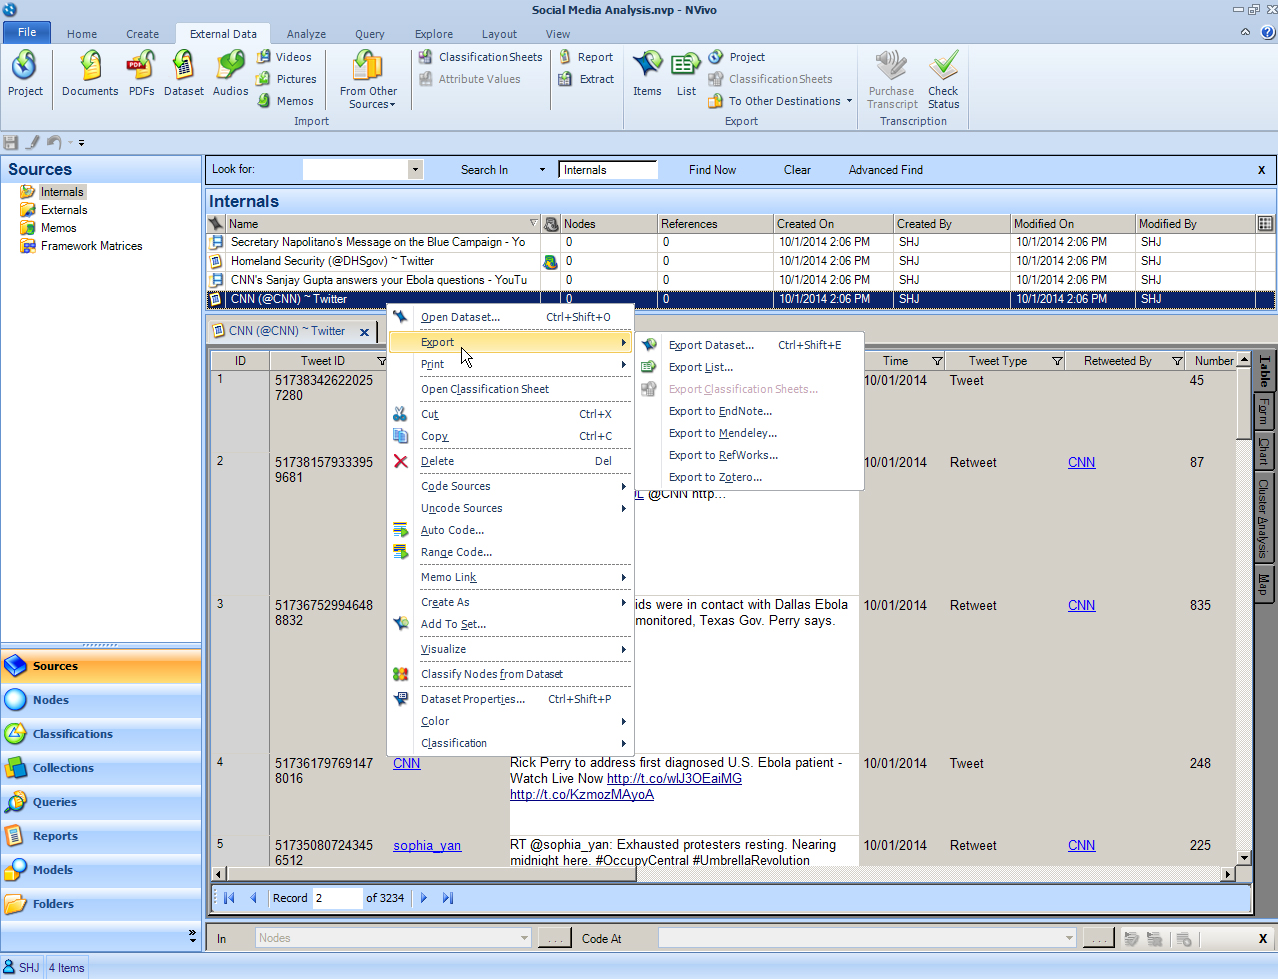
To analyze a Tweetstream, double-click on the desired dataset. The dataset will open in the Detail View. In this case, 3,234 recent Tweets were captured (but from an account with 43,000 Tweets, 2,213 photos and videos, 987 following and 14.2 million followers a the time of the data extraction). The dataset is exportable. Just right-click on the dataset in the List View, go to Export, and Export Dataset.
Within NVivo, there are various ways to approach the data.
In the Detail View, look at the tabs to the right of the Table data. The sequence reads: Table, Form, Chart, Cluster Analysis, and Map. The default Table view offers a way to scroll through the data for a close-in reading of the microblogging messages. The capture also captures the times of the messaging, the accounts, the relationships between accounts in terms of re-Tweeting, and other data.
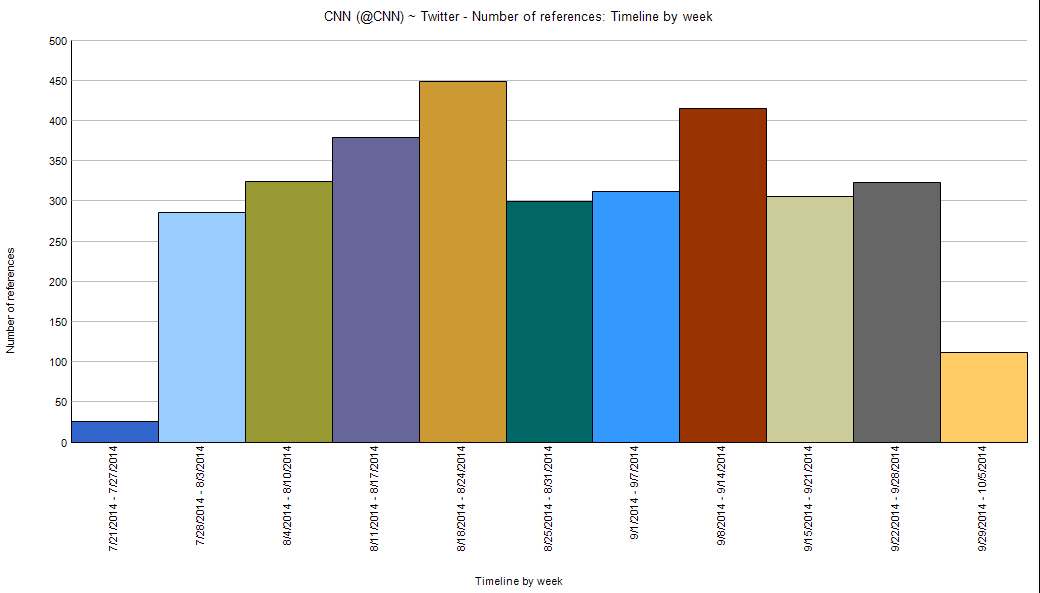
A Chart View gives a sense of the numbers of Tweets from the account over certain time periods (by week).
The “Cluster Map” view enables a view of related terms. Zooming in would be critical to read the fine print.
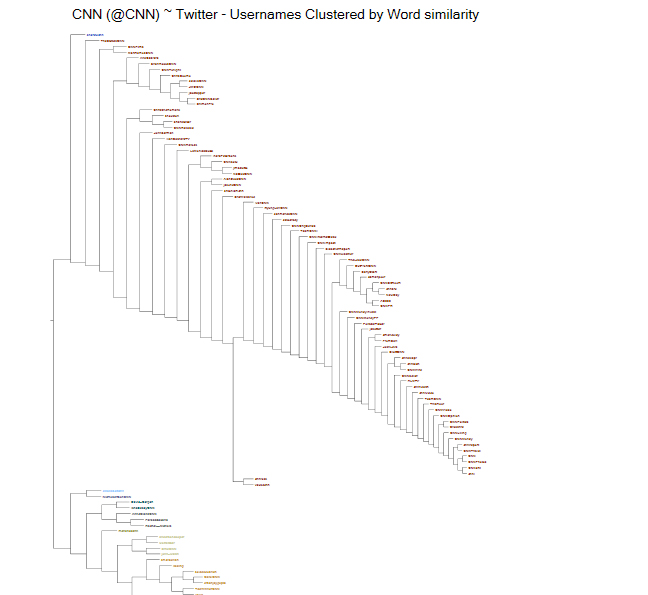
A 2D cluster view may be somewhat more informative at a glance.
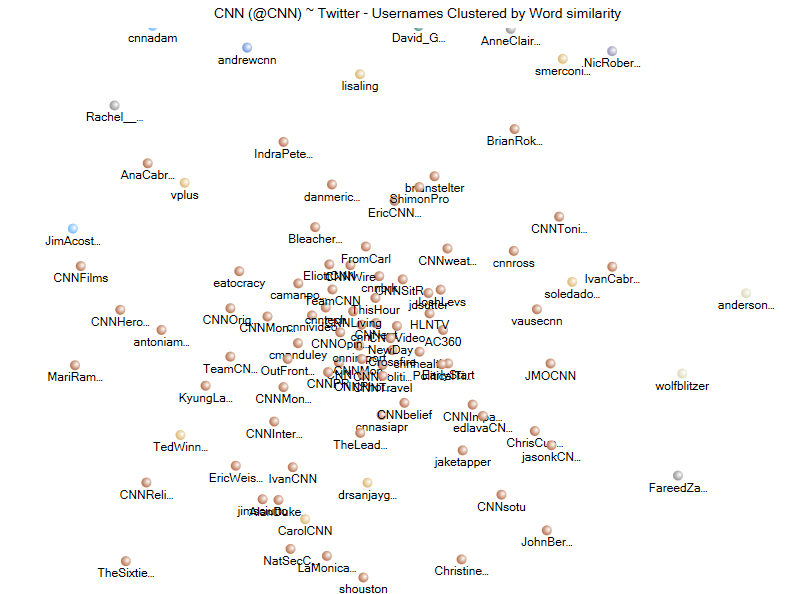
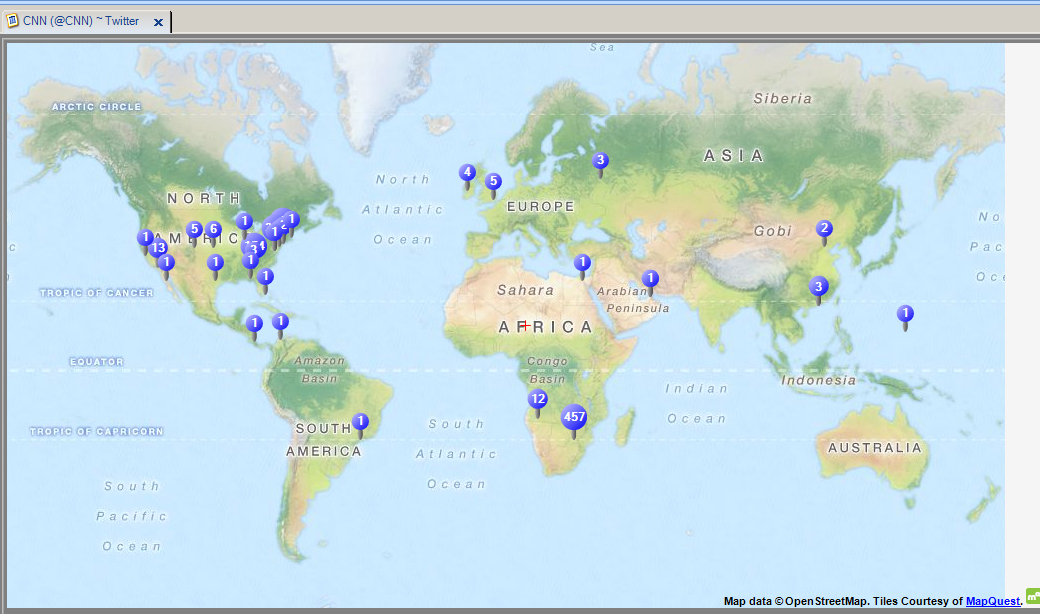
Finally, a map may be made of the locations of the accounts where individuals micro-blogged from.
If researchers want to use the locational information to place points on another map, say, in Google Maps or in ArcGIS, they can take the geographical data from that column in the Tables View, export, and map elsewhere.
Analyzing YouTube Videos in NVivo
To analyze a video, go to the List View, and select one of the videos. Double click on it.
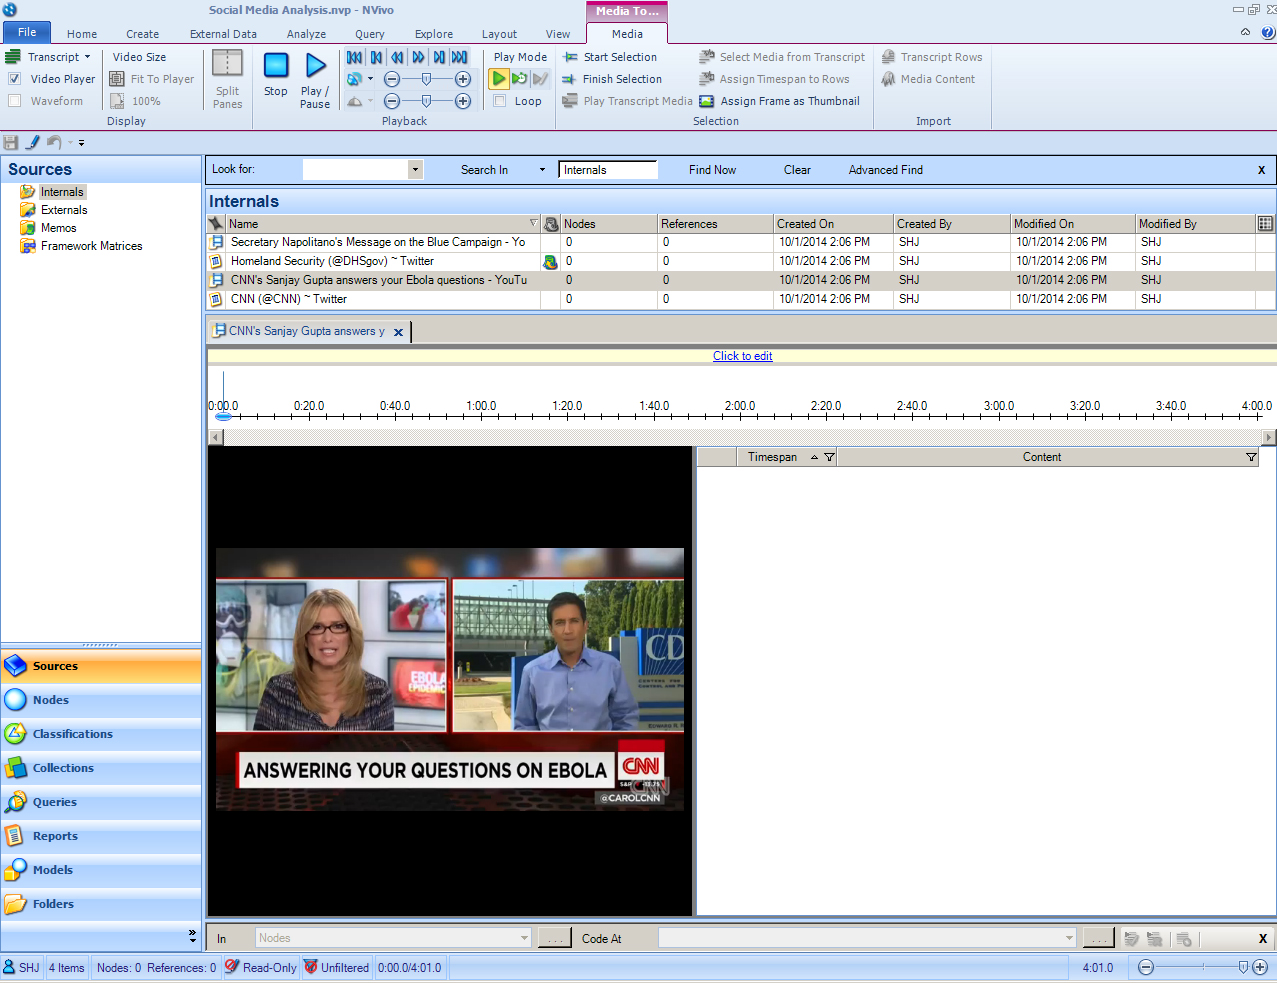
Dr. Sanjay Gupta Video on Ebola on CNN. An image from the video appears below in the active pane area of the project. The playhead for the video is at 0 or the start.
Just above the video’s timeline is the “Click to edit” command. Click that.
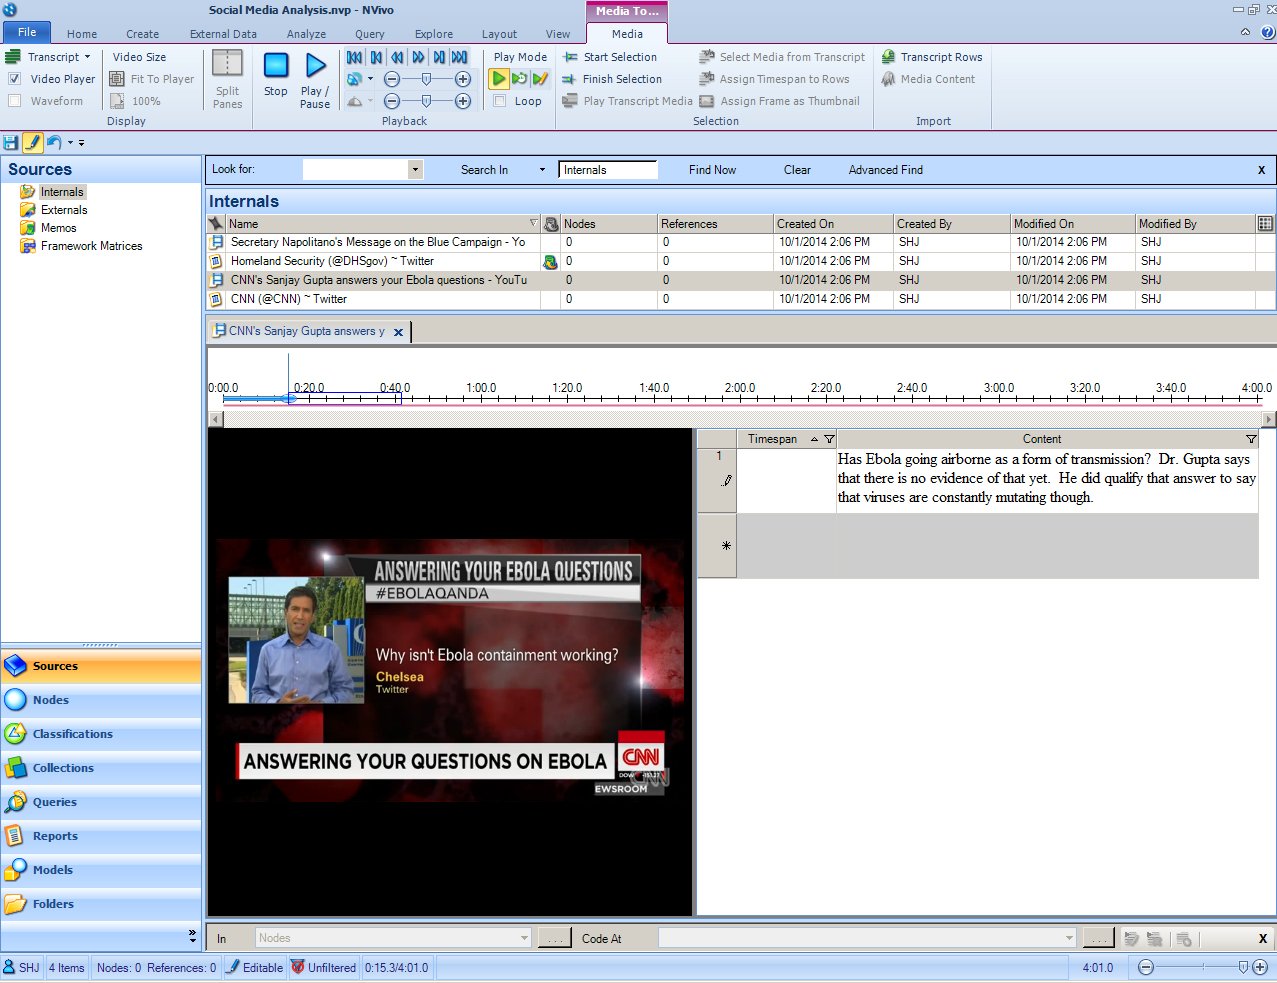
An annotating window has opened to the right of the video. Click anywhere on the video to start playing it. At any point in the video where there may be something of interest to annotate, stop the playhead, and move to the textual annotation window at the right. Input the notes there. (NVivo does not have visual - audio - video mining technologies. In terms of coding, only the text that the researcher inputs may be coded. Also, only the text may be queried and searched. Textual transcripts with time markers may be uploaded as well, for searchability and querying.)
Again, note that this ingestion of a YouTube video is only via "embed text". If the original YouTube video were removed from the YouTube archives, then the link would not exist in the NVivo project (although the textual annotations may remain).
Autocoding a Social Media Dataset
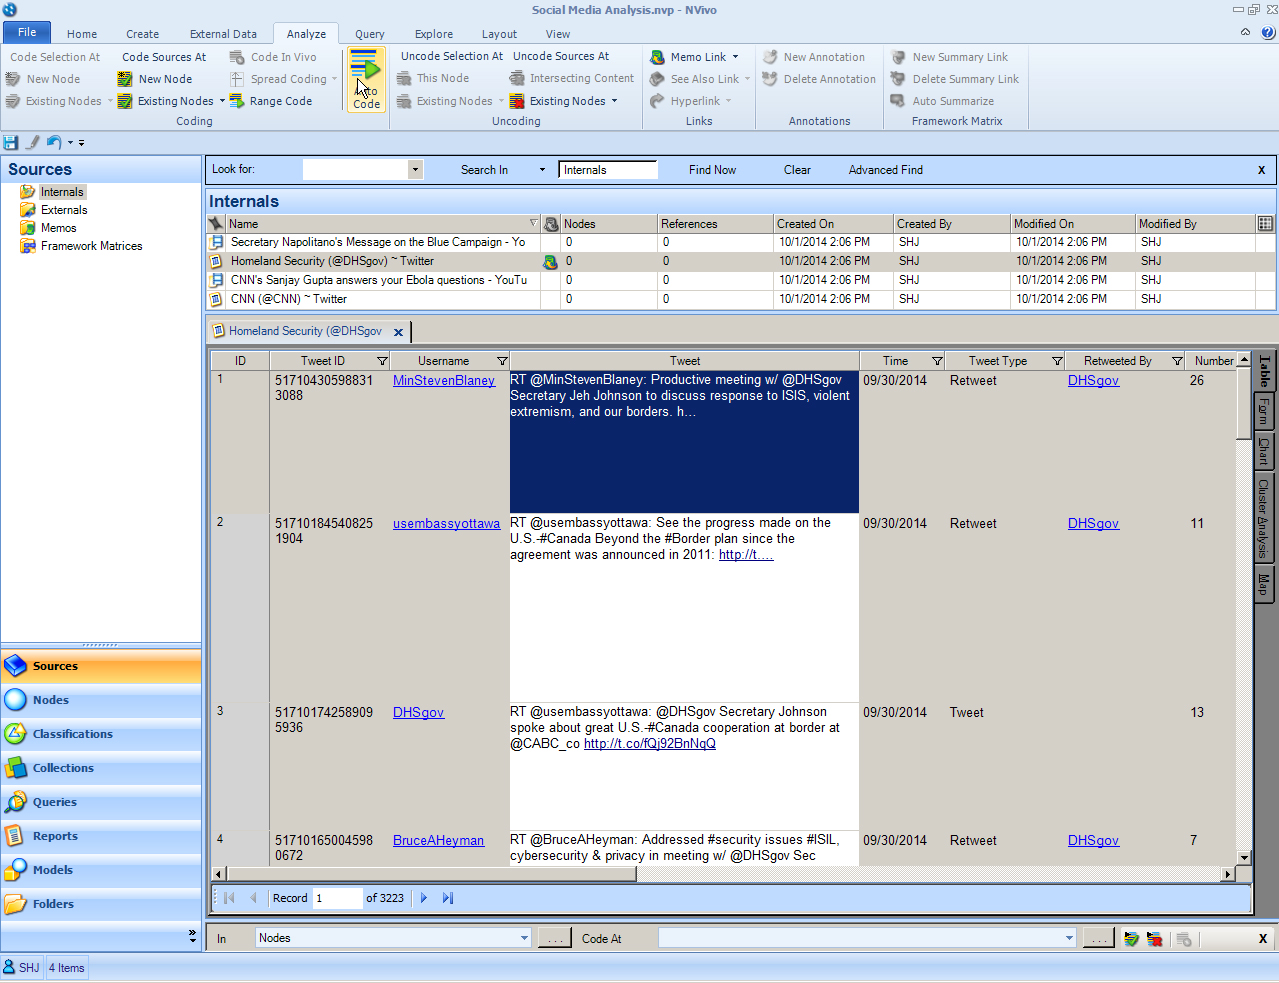
The Twitter datasets may be auto-coded with select columns coded to particular nodes. In the List View, right click the selected dataset, in this case the Homeland Security (@DHSgov) Tweetstream. This set contains 3,223 recent microblogging messages or Tweets. (At the time of the data extraction, the account had 6,042 Tweets, 260 photos and videos, 311 following, and 509,000 followers.
In the NVivo ribbon, go to the Analyze tab; in the Coding group, select AutoCode.
The Auto Code Wizard Step 1 window opens.
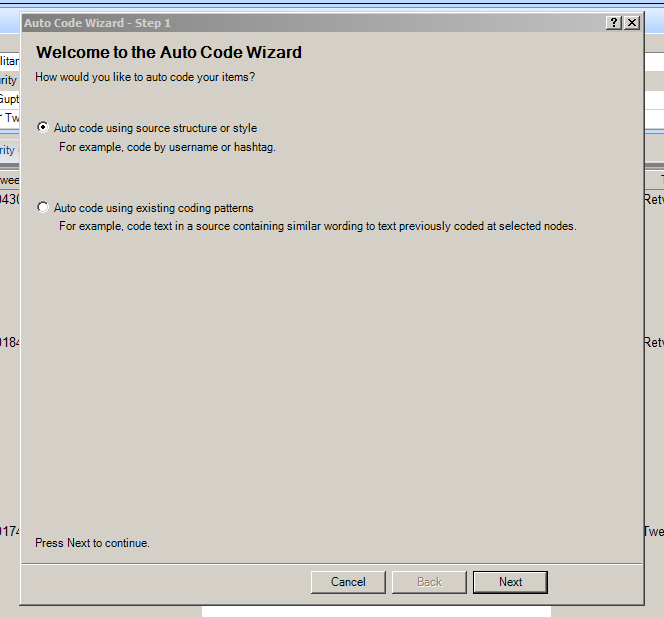
Keep the default selection: “Auto code using source structure or style.” Click “Next.”
Choose “Code at nodes for each value in predefined columns.” This selection is only available for NCapture extractions from Twitter and Facebook. (This is the default selection.) Click “Next.”
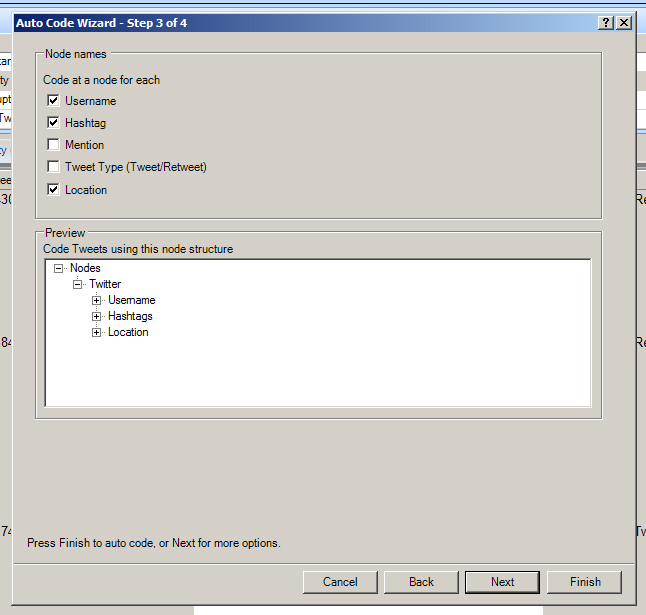
The next window asks the user how node names should be determined. The pre-set is for Username and Hashtag. Other choices are the following: Mention, Tweet Type (Tweet / Retweet), and Location. Twitter data is said to only be sparsely labeled with geographical information (at around 1% of microblogging messages). For this particular autocoding exercise, though, Location will be added.
Click “Next” for more options. (Or click “Finish.”)
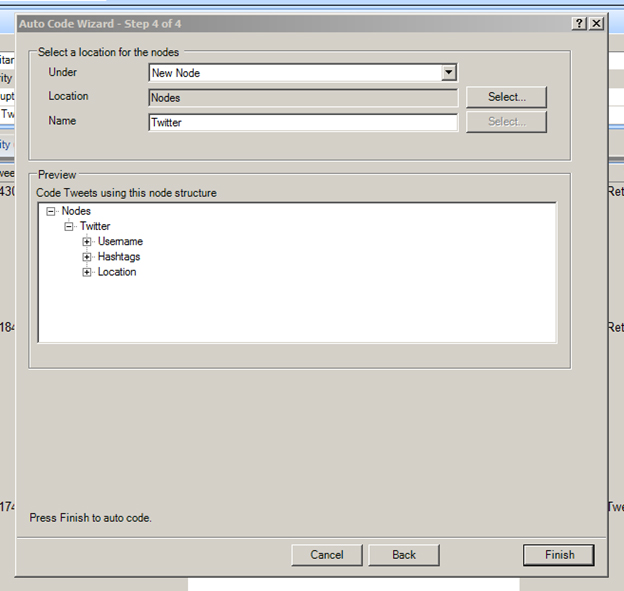
Step 4 enables users to save the results under a New Node or New Folder, or an existing node or an existing folder.
Click “Finish.” The status (progress) bar indicate the autocoding progress.
In the Navigation View at the bottom left, click “Nodes.” In the List View, see the New Nodes created. These may be queried in a variety of ways.
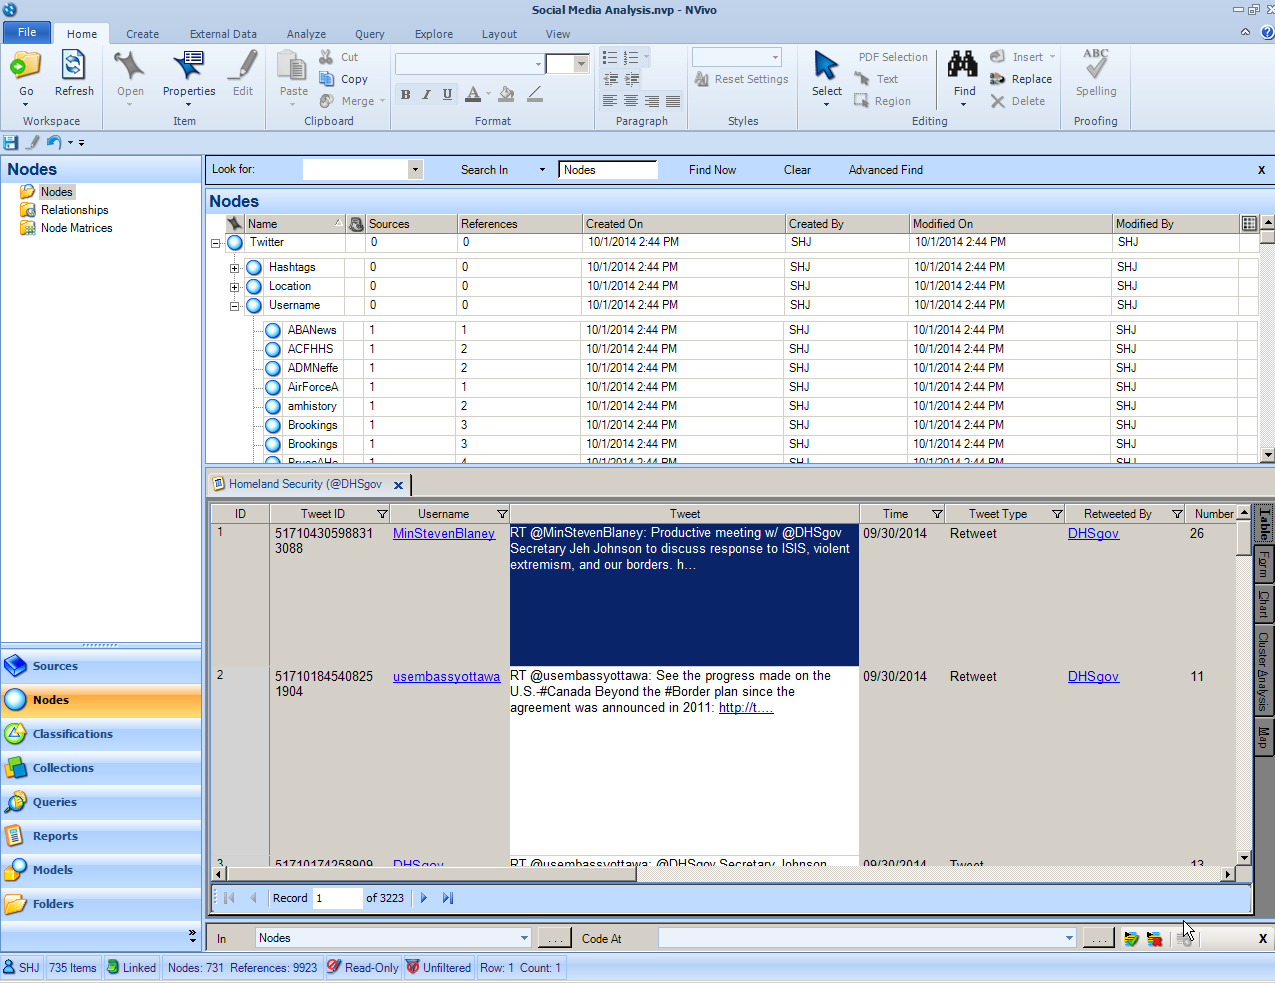
A researcher may examine user accounts and their related microblogging messages (Tweets).
“Hashtag” (#) conversations may be analyzed to understand online discussions around particular topics.
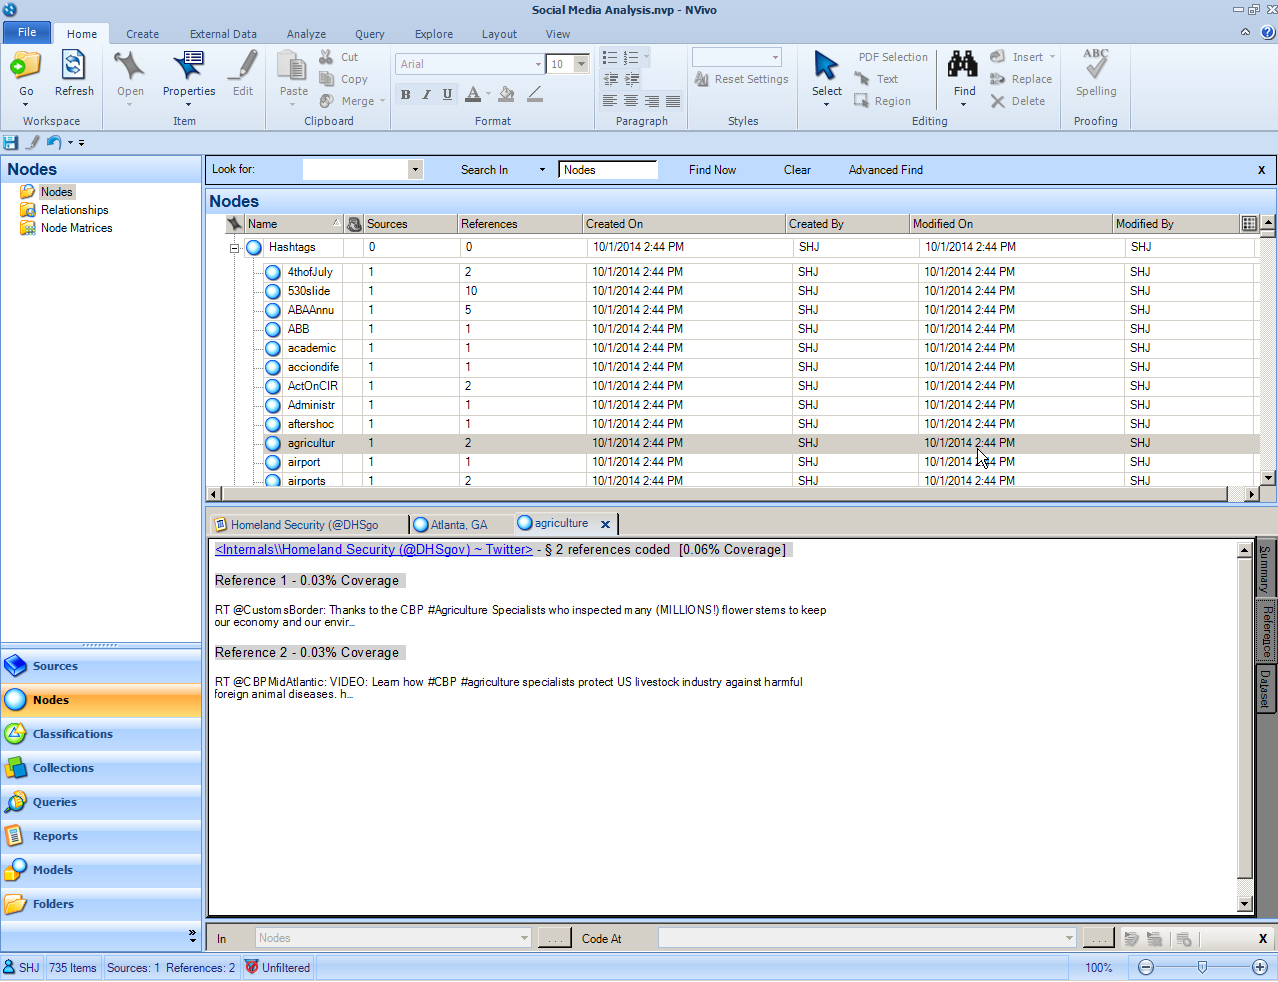
The geographical nodes (based on the geolocation data column in the extracted dataset) may be used to understand location-based issues. (There are two types of locations. One is the professed location by the owner of the social media account, and the other is the actual latitude and longitude from the smart phone, mobile device, or computer used in the communication. Either or both can be spoofed.)
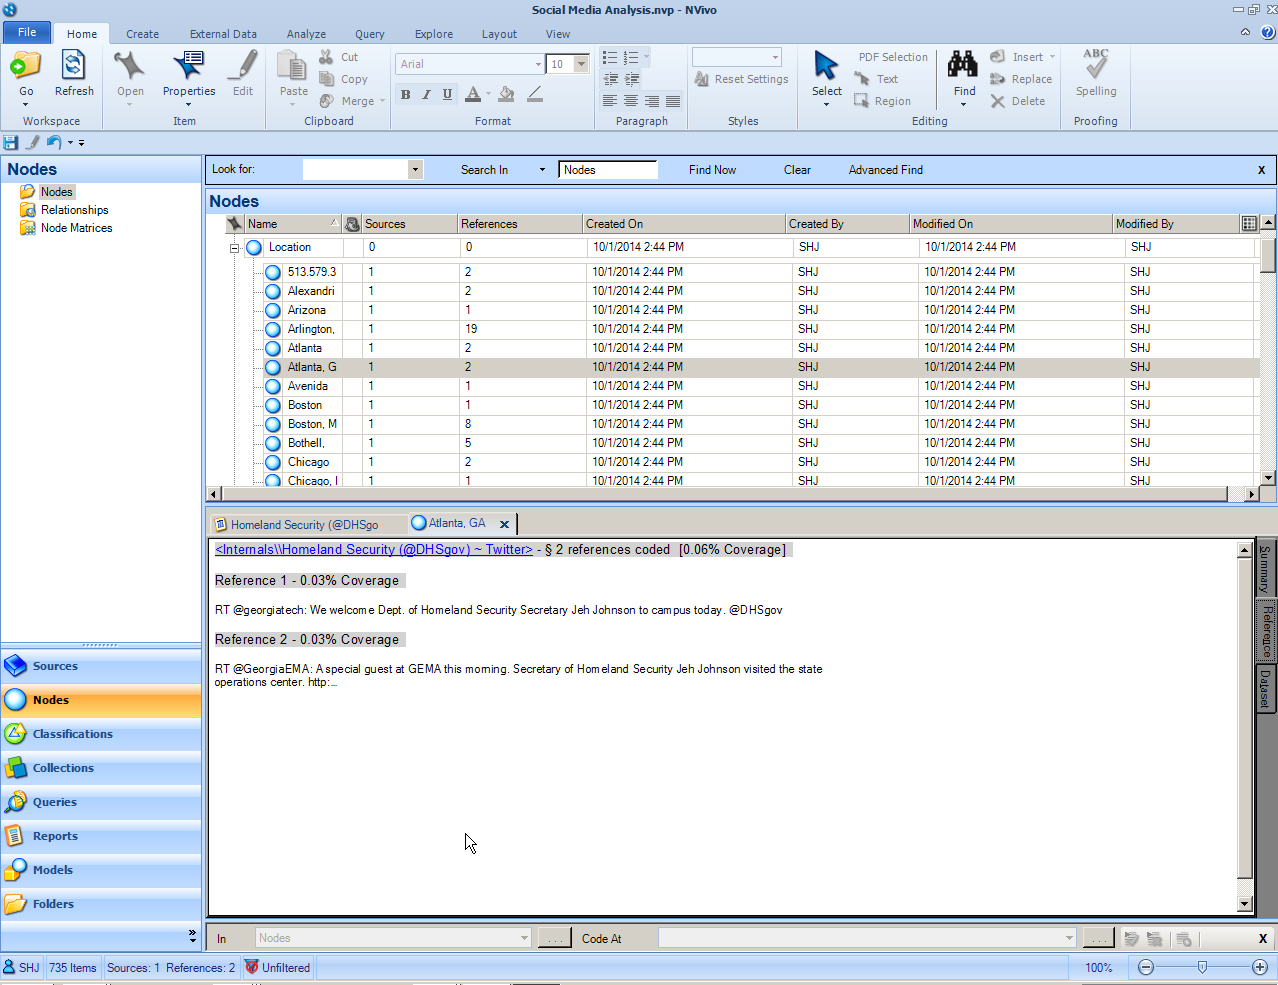
Facebook Poststreams
NCapture also enables the capture of user account-based poststreams from Facebook. The amounts of poststream records can be up to about 35,000+ in a data download.
(Note that the target social media platforms are constantly changing. The web browsers are constantly changing. The software is constantly changing. What may be working one day may not be working on other days.)
Types of Data from Social Media
Generally speaking, there are three main types of data collectible from social media:
content data (what people share on social media spaces): text messaging, profiles, audio, imagery, videos, slideshows, data tables, maps, and other contents
This data is comprised of structured, semi-structured, and unstructured data. Structured data is labeled data such as those in data tables.
metadata (descriptive or labeling information about digital contents): folksonomic tags, description data, locational data for image files, camera data for image files, and others
trace data (interaction data, relational data): follower / following data, replies, retweeting, liking, voting up/voting down, usage data, and others
In many ways, such data may be augmentary more than primary...but that all depends on the focus of the research. The "hot moment" for social media data seems to have passed.
In terms of human subjects research standards, the practical consensus seems to be that any data released by users to the public may be usable for research. Some will remove the personally identifiable information (PII) in the communications. Another challenge is that social media data may be auto-generated by robots (scripted agents), which muddies the value of the information.
Discussion of "Analyzing Social Media Data in NVivo"
Add your voice to this discussion.
Checking your signed in status ...