Incidents and Statistics
Incidents and Statistics
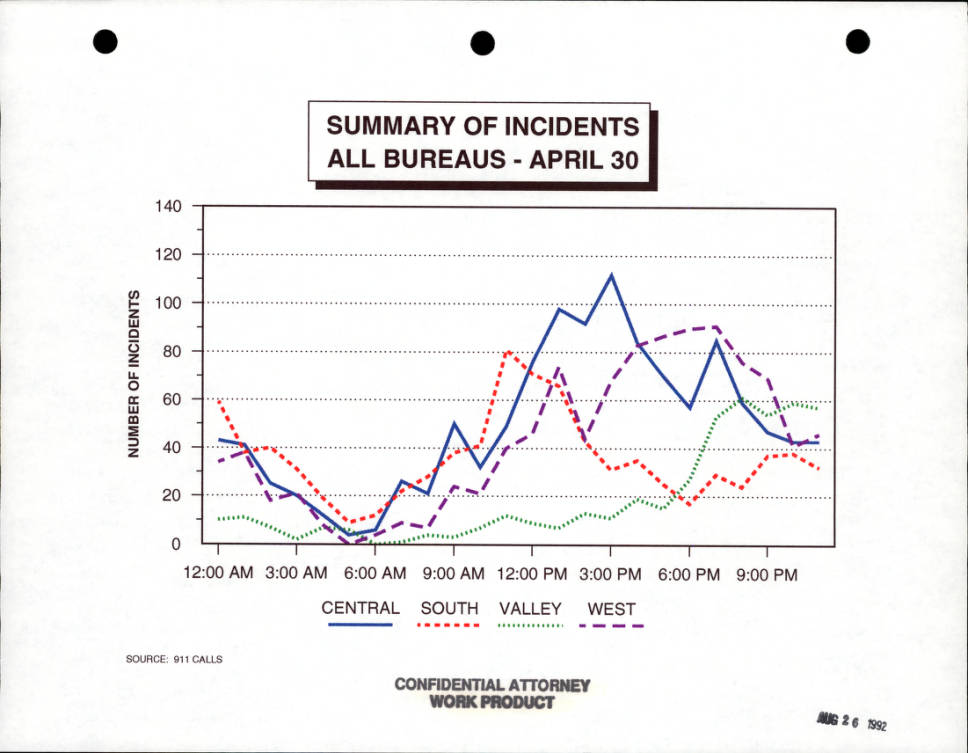
Over the six days of unrest in Los Angeles following the acquittal of the four LAPD officers who beat Rodney King, the city experienced a staggering level of damage to both life and property. One goal of the Webster Commission was to bring clarity to the myriad incidents that occurred throughout L.A. in those six days in order to comprehend the totality of damage and understand who and what had been involved and when and where events had unfolded. Staff from the law firms assisting the commission gathered data from a variety of sources, including 911 calls and arrest statistics, and visualized this data in a number of graphs, charts, and tables, a few of which are shared here.A riot chronology chart (1 below) outlines when major events such as arrests, fires, and deaths occurred from the time the verdict was announced on April 29 to the de-escalation of activity on May 4, showing a peak of incidents on April 30, the day after the verdict. Another incident graph for April 30 (2 below) breaks down the number of overall incidents reported by geographic areas policed by different LAPD bureaus, and indicates waves of activity throughout much of the city over a twenty-one-hour period, most of it concentrated in the Central, South, and West areas.
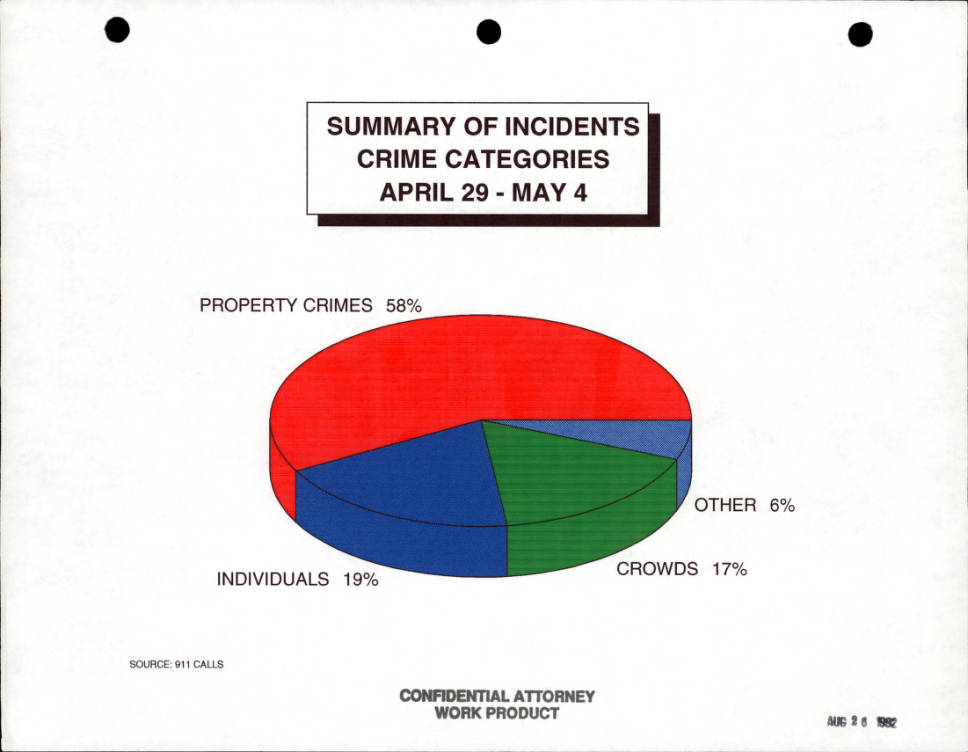
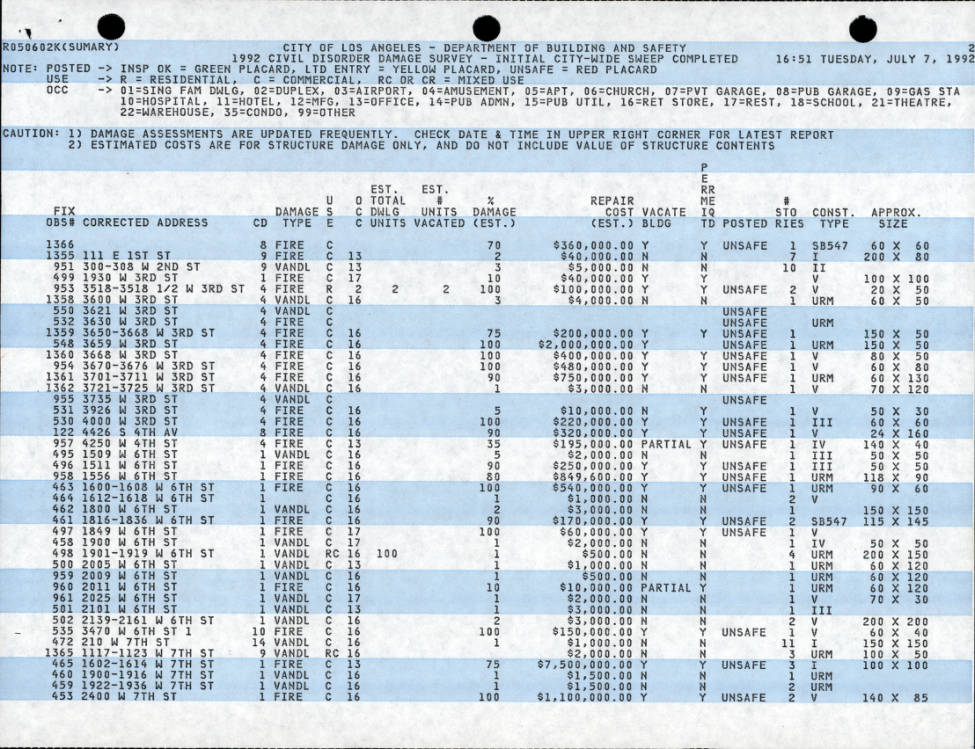
“Incidents” were broken down into a number of categories. Crime (3 below) was measured very broadly according to “individuals”, “crowds,” and “property crime,” with the last constituting fifty-eight percent of the overall crimes committed from April 29 to May 4. One page (4 below) of a thirty-page document listing the financial losses due to the destruction of property through arson and vandalism indicates the extent of loss in this crime category.
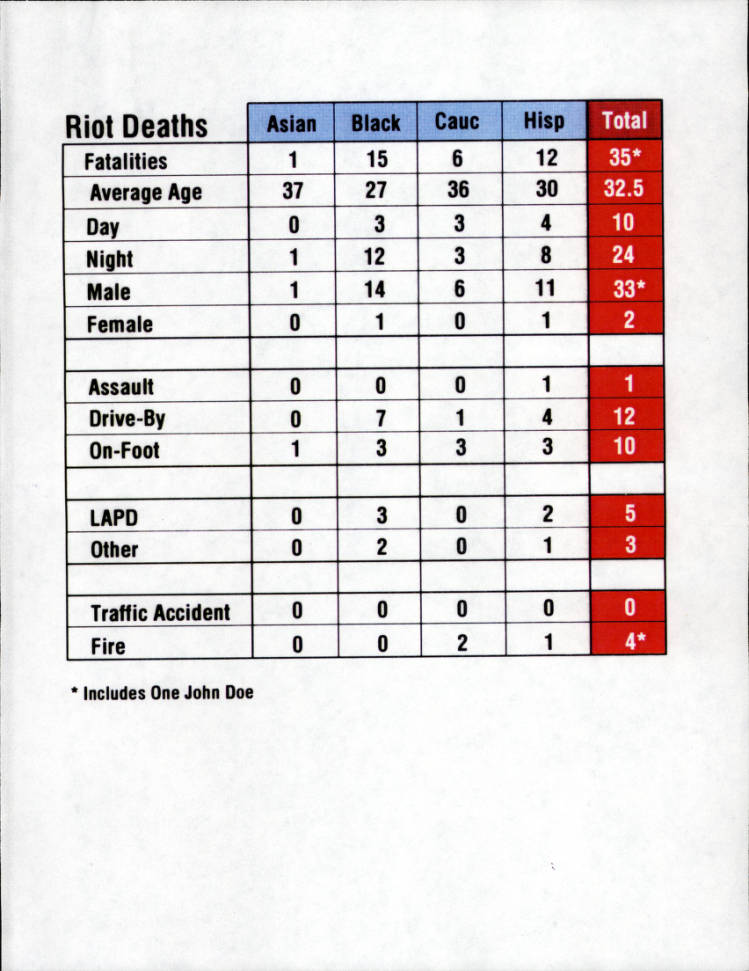
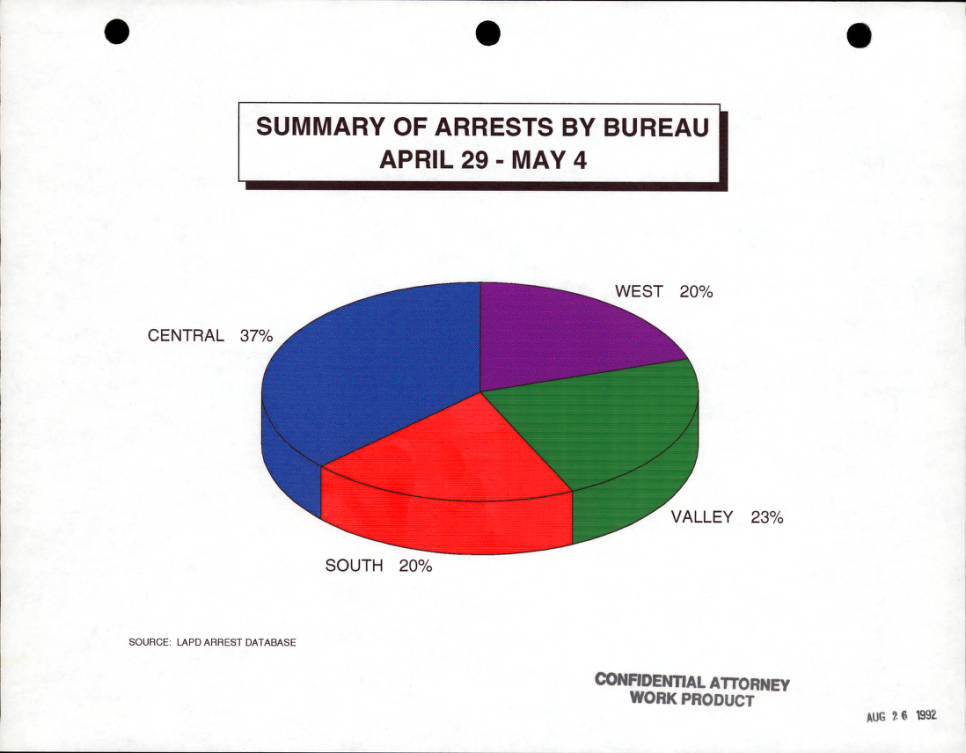
Charts summarizing overall arrest statistics indicate the breakdown of arrests by race (5 below), as well as the percentage breakdown of where the arrests occurred by LAPD bureau (6 below). Fatalities were located on a map of the city and in a chart (7 below) providing information—race, average age, cause and time of death—relating to those thirty-five individuals* who were killed in April 1992.
*The Los Angeles Times subsequently raised and tracked the total number of deaths during the riots to more than sixty.