Modeling and the Humanities: Questions
The answers to these questions rely on both mathematical and humanistic thinking. As such, they may not have "correct" answers, although some answers will be more convincing and involve more rigor, rationality and reflection.
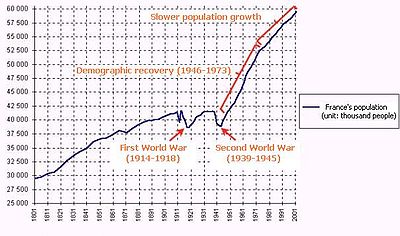
This graph shows the population of France between 1800 and 2000. What is the general trend? What model of growth does the graph roughly follow? How might we explain periods of little change? Periods of rapid change? High and low points? What happened in 1870 to explain the decline? Do the explanatory notes fully explain the graph? How would the graph look different if the y-axis started with zero, but the graph did not add any height? How would the graph look different if it started in 1900 instead of 1800? What happened in 1973? Are the world wars the most important events or trends in French history during this two-hundred year history? Does this graph include France’s colonial possessions?
Look at the point on this S-curve where the curve turns from up to down (at time roughly 2.5) —is this good news or bad news? Are things on the decline? Or just getting better at a slower rate? Is more always better?
When we observe the natural and social phenomena around us, we don’t always know ahead of time whether it is more appropriate to assume a normal distribution, a power law distribution, or some other model. What are the implications of a mismatch between the distribution we are modeling and the reality of the phenomenon? If we assume that extremes are very unlikely (following a normal distribution), what happens when an extreme event occurs? (The 2011 earthquake in Japan, September 11, the financial criss of 2008 to name a few examples.)
How might we reconcile a conversation about averages and distributions with respect for unique individuals and the complexity of the humanistic tradition?
| Previous page on path | Modeling, page 3 of 3 | Path end, continue |
Discussion of "Modeling and the Humanities: Questions"
Add your voice to this discussion.
Checking your signed in status ...