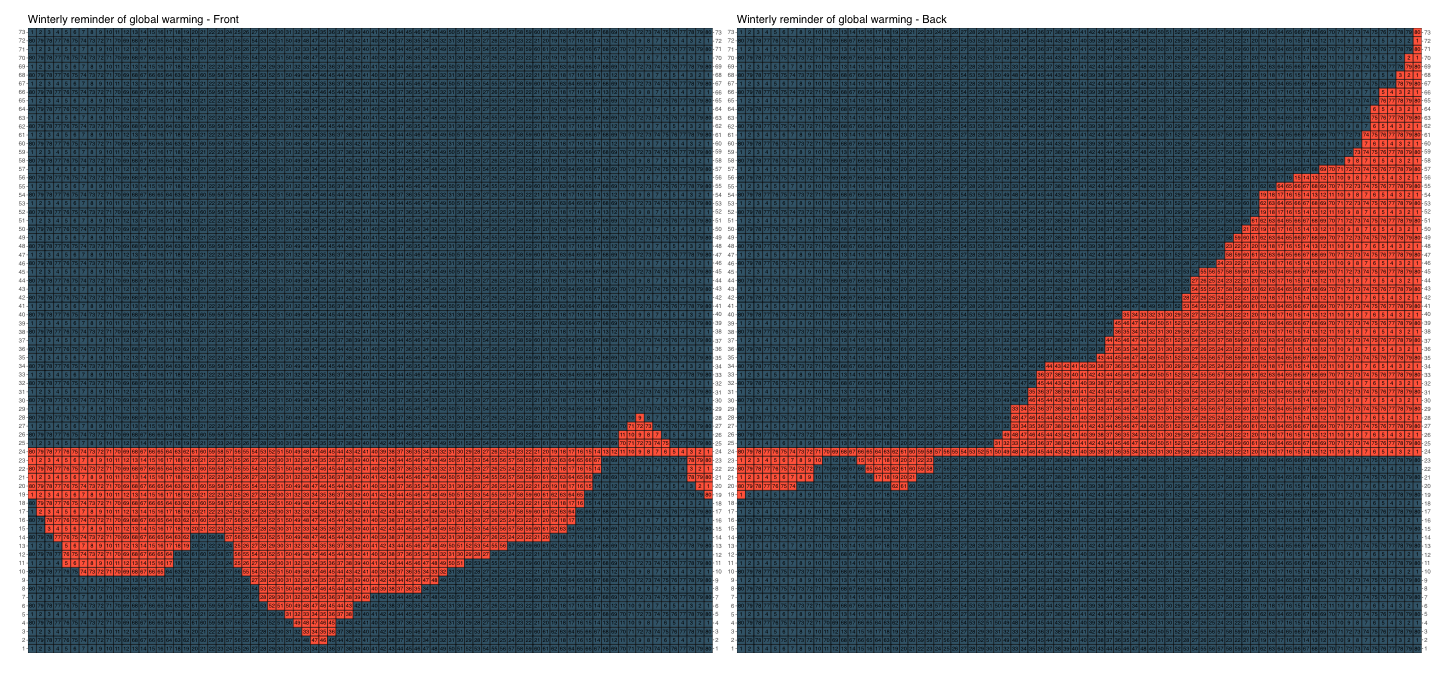
VizKnits Pattern Example
1 media/VizKnits Pattern for Global Warming_thumb.png 2020-05-04T13:31:18-07:00 Bryn Ziegler f534bbc0abefbfe22920edbf88bff7be084a5b70 37047 1 VizKnits Pattern Example for "Winterly reminder of global warming" Sweater plain 2020-05-04T13:31:18-07:00 Bryn Ziegler f534bbc0abefbfe22920edbf88bff7be084a5b70This page is referenced by:
-
1
media/Rainbow Scarf.JPG
2020-04-02T10:59:50-07:00
Knitting Data
27
plain
2020-05-06T13:48:38-07:00
Why Do Knitting and Data go hand in hand?
Perhaps the best jumping off point for the concept of visualizing data through knitting is project Skyknit. Optics research scientist Janelle Shane works with Neural Networks, feeding them information until they begin to create on their own, a process similar to teaching and learning language. If you give a neural network enough sentences, it will begin to string together its own. In 2018, Shane trained a neural network in the structure of knitting patterns-- a dense code that looks impenetrable to those of us who aren't in the know (a line of knitting might look something like 'Row 16: *C4B, C4F, p2* around'). Eventually the neural network began to write patterns, and a group of knitters on popular crafting site Ravelry accepted the challenge and proceeded to create them in the real world. This example of how knit patterns easily translate into codes and vice versa inspires us to look at other ways knitting and data have collided. Read more about Skyknit here.
Some interesting examples of personal data projects:
Claudia Weber decided to knit this scarf as a way of tracking the train she commutes on every day. Named the Rail Delay Scarf, she used a three color key, adding a row of grey, pink, or red depending on the severity of the delay. The end result is a fascinating representation of frustration and lost time that I'm sure we can all relate to. She is quoted as saying "It’s not a statistic; it’s one year and how I felt about it".
In a similar and very heartwarming example, father Seung Lee knit the sleep patterns of his one year old son into a blanket, with each row representing a day and different colors for time spent sleeping and awake. Seung created a program to assist him in creating the pattern and tracking his place, making the blanket a collaboration of craft and technology at every step. You can read more about the Sleep Blanket here.
Knitting and crocheting data has proven to be a useful tool for activists as well, particularly when it comes to displaying climate data in an accessible and engaging way.
Marine scientist Joan Sheldon created a scarf as a high impact way of demonstrating climate change from the year 1600 to 2015. When she presented it at a conference, Joan explained that "Even scientists who were familiar with the data wanted to touch the scarf, to find the year they were born. “They never would [do this] with a science graph,” she says. “It approaches you in a different way.” See Dr. Sheldon's work here.
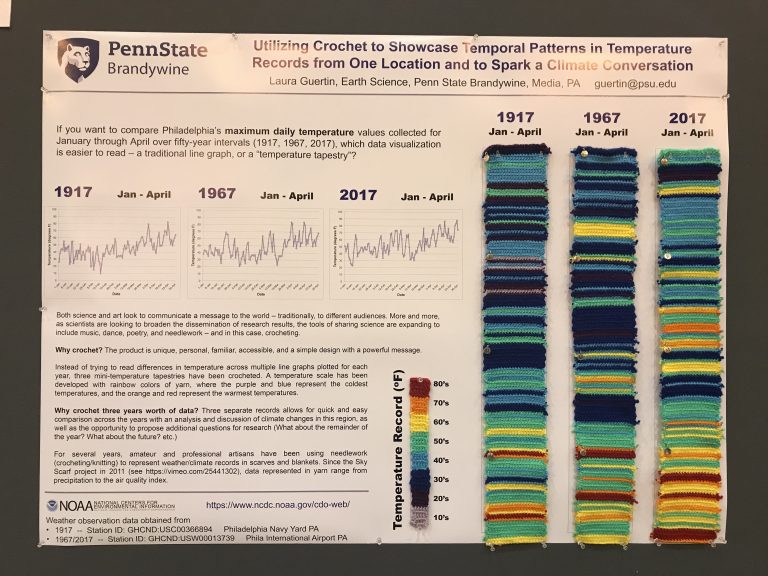
Dr. Laura Guertin of Penn State created this crocheted graph of temperature as a poster for a conference in 2017. Calling them "Temperature Tapestries," Dr. Guertin wrote: "I was surprised at how easy it was to talk about changes in weather and climate with people with yarn as my tool." Read more about Dr. Guertin's Tapestries here.
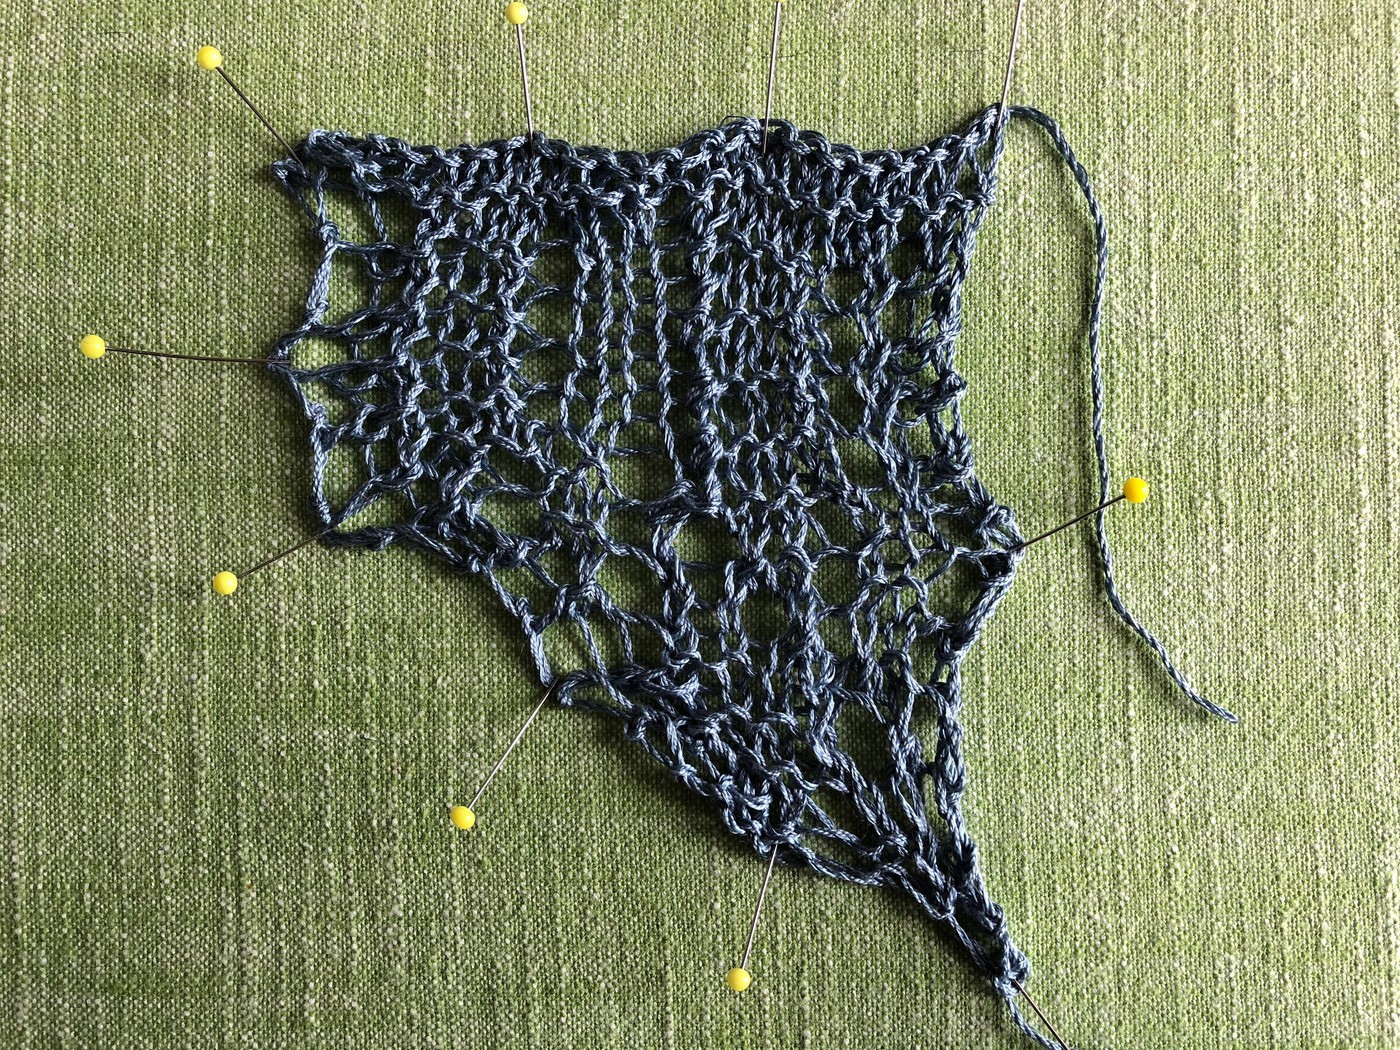
In a similar vein, the organization VizKnits has begun putting out patterns such as the "CO2 Emissions Pullover" and the "Wild Tiger Population Loop Scarf." On their site vizknits.com, they explain where the data comes from and how it was converted into this pattern, along with how to download the pattern to make the project for yourself. Their knits are functional, pretty, and they certainly pack a punch when it comes time to explain what they represent.
Another place to go If you are interested in creating your own climate scarf and aren't sure where to start is the Tempestry Project. Found at tempestryproject.com, the kits will provide everything you need to get started, from rolls of colorful yarn representing temperature ranges to NOAA climate data.
-
1
2020-05-06T14:12:33-07:00
VizKnits
5
gallery
2020-05-06T15:50:43-07:00
In a similar vein, the organization VizKnits has begun putting out patterns such as the "CO2 Emissions Pullover" and the "Wild Tiger Population Loop Scarf." On their site vizknits.com, they explain where the data comes from and how it was converted into this pattern, along with how to download the pattern to make the project for yourself. Their knits are functional, pretty, and they certainly pack a punch when it comes time to explain what they represent. Their projects allow you to learn and educate with style, and make abstract climate data into something personal and tactile to connect with, which may be why these projects gain such traction in the first place.
Another excellent option if you are interested in creating your own climate related knit and aren't sure where to start is the Tempestry Project. Found at tempestryproject.com, the kits will provide everything you need to get started, from rolls of colorful yarn representing temperature ranges to NOAA climate data.