Thanks for your patience during our recent outage at scalar.usc.edu. While Scalar content is loading normally now, saving is still slow, and Scalar's 'additional metadata' features have been disabled, which may interfere with features like timelines and maps that depend on metadata. This also means that saving a page or media item will remove its additional metadata. If this occurs, you can use the 'All versions' link at the bottom of the page to restore the earlier version. We are continuing to troubleshoot, and will provide further updates as needed. Note that this only affects Scalar projects at scalar.usc.edu, and not those hosted elsewhere.
Knitting Data: Data Visualization and CraftsMain MenuKNITTING DATA: DATA VISUALIZATION AND CRAFTSCraft as Recorded InformationKnitting DataPattern and Pattern KeyGalleryBibliographyRebecca Michelson4a4ccee9feeebed3cb8d89cff64cd7c90a95f6d5
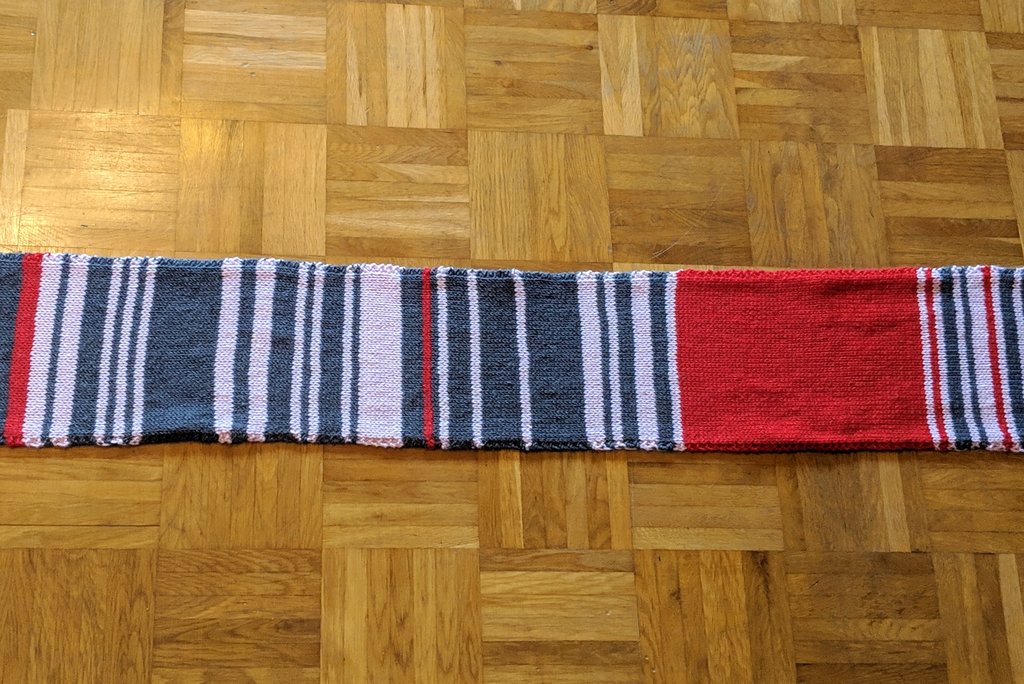
Rail Delay Scarf
1media/rail delay scarf_thumb.jpg2020-04-22T13:49:40-07:00Bryn Zieglerf534bbc0abefbfe22920edbf88bff7be084a5b70370472Image by Sarah Weber, from New York Times article "Commuter Knits a ‘Rail Delay Scarf.’ It Fetches $8,650 on eBay."plain2020-04-22T13:52:04-07:00Bryn Zieglerf534bbc0abefbfe22920edbf88bff7be084a5b70
Claudia Weber decided to knit this scarf as a way of tracking the train she commutes on every day. Named the Rail Delay Scarf, she used a three color key, adding a row of grey, pink, or red depending on the severity of the delay. The end result is a fascinating representation of frustration and lost time that I'm sure we can all relate to. She is quoted as saying "It’s not a statistic; it’s one year and how I felt about it". The scarf is not only pretty, it takes you on a journey when you look at it: When you see that block of red, you understand Ms. Weber's frustration. Each row of red tangibly represents more than thirty minutes of waiting!