Displacement #3: Itinera as Code
I was first introduced to Itinera when, as a first-year computer science student, I was given the opportunity to work on a long-term project focused on updating Itinera’s “Travelers” visualization. The “Travelers” visualization was initially very intimidating to me. I was not familiar with the historical aspect of the data, and I had no idea how the code worked. Over the past four semesters of working on Itinera as a student, I have had many new and important learning experiences. This project has increased my understanding of how to work with data, specifically unfamiliar data. I have also had the experience of working in a computer lab environment with a team of people who are all working on different parts of the same project. In the lab, I have learned the value of having an understanding of everyone else’s contributions, processes, and goals. Over this time, I have also developed a better understanding of the value of Computer Science in combination with Art History and other disciplines. The process of teaching myself a new programming style has also contributed to a fair deal of trial and error, which has frequently led me into and out of rabbit holes. I can now better distinguish these rabbit holes and climb out of them quicker than I could in the beginning. I have learned the value of what a data visualization can offer to students, researchers, and anyone curious about data relationships. Working on Itinera has been a very informative opportunity due to all of the different approaches I have had to take and the many challenges I have been faced with.
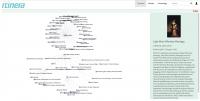
In the beginning, I did not know where to start, so one of Alison’s lab project managers, Sarah, helped guide me through the initial steps. The first step we decided would be best was to increase my familiarity with Itinera’s current functionality. The best way to do this was to spend time looking at the functionality of the JavaScript visualization from the front-end. For reference, the back end of the Itinera code (the code that runs the visualization) was not a part of my learning experience until three semesters later. Instead I began learning by simply interacting with the current Travelers visualization (Figure 1).
Familiarizing myself with the basics of Itinera, such as how the current visualization performs and the significance of how the data is presented, was an incredibly important foundation step. Just by clicking through the visualization, I was able to recognize patterns and form an idea of how I thought it worked. This was a small but important first move because I was able to form my own understanding without being overwhelmed by completely new and unfamiliar code. I was able to develop ideas on how to critically approach what is necessary to make a more informative visualization in the future.
One part of the visualization that initially struck me as being very confusing was the cloud of unfamiliar names, and how clicking on a name would produce another cloud of unfamiliar names. I was very concerned that it would be difficult to work on the code without also being familiar with eighteenth-century history. Similar roadblocks have appeared throughout the project. It takes effort to recognize these roadblocks and remind myself that I cannot let it stop my productivity. It is much more productive to consider what I do know, rather than what I do not. Sure, I don’t understand the history of these names, families, and relationships, but the purpose of being able to code is to use a computer to assist an understanding. Many times, I’ve had to refocus myself to the small steps that are the foundation for taking bigger steps.
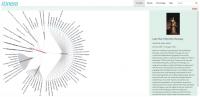
After understanding the front-end code, I began learning JavaScript D3. D3 is a JavaScript library that the current “Travellers” visualization uses. This library is used specifically for data visualizations. D3 has been very challenging for me to learn and understand because I am working with it before I have had the chance to take a formal JavaScript class in school. Without this type of training, I feel like the learning process was slower, which was very discouraging for me at times. A major benefit in working with D3, however, is that there are premade templates, meaning that examples of the complex and difficult code are freely offered as starting places for the coder. The final goal of my project is to utilize the D3 “Force-Directed Graph” template written by Mike Bostock to successfully create an enhanced representation of Itinera’s “Traveler’s” data. To the viewer, this would provide a descriptive and interactive visualization of the relationships between all of Itinera’s agents. Viewers will be able to look at multiple agents’ relationships at a time, or zoom in to look at more personalized relationships (Figure 2).
The process of making the template function properly has been one of my major goals. A few examples are provided for the template, and there are many other examples and tutorials online. Despite that, all of the online examples use small and pre-formatted amounts of data, already structured to work perfectly with the example visualization code. Itinera’s data is formatted in a complex way. There have been many times that I found it difficult to understand what to do next and how to do it. I entered this project without any understanding of how to code with large amounts of data. I still do not feel I truly understand it properly, but I am approaching a point where I can begin understand how to do what I need to do. The feeling of being stuck, especially with the large amount of resources online, has been challenging. One way I have been able to escape rabbit holes is by breaking the code down, line by line. Reading lines of code like paragraphs in a book does not always work the way I expect it to due to the overwhelming amount of information. Instead, reading each word and connecting it with a meaning has been a more productive route of working through problems.
Setting the coding aside, an important learning experience of this project for me relates to working with the representation of data. It is important to me that I am able to accurately and productively represent the data that my colleagues have spent a long time gathering and researching. Despite not knowing much about eighteenth- and nineteenth-century Europe, when the data is visualized it is very informative. Working on Itinera has helped me to understand how very different disciplines can successfully work together. Art History, Digital Media, Computer and Data Sciences are incredibly interesting when combined into a single project, such as Itinera. These disciplines as a combination are not just intriguing, but are also capable of providing new and complex historical understandings.
This page has paths:
- Itinera's Displacements Alison Langmead